

I. Introduction
Aging degrades the health-related quality of life (HRQoL) for the elderly with chronic diseases. The HRQoL is a broad, multidimensional concept covering significant domains of daily functioning and subjective experience, such as physical functioning, social role functioning, somatic sensation, and subjective wellbeing [1]. Multidimensional analysis of the HRQoL requires considerable effort and expertise, demanding the development of more sophisticated ways to facilitate such complex, preferably automatic analysis.
Previous studies on the HRQoL have limited their focus to specific demographic groups, such as adults [2,3], women [4], and vulnerable aged men [5] or to specific diseases, such as diabetes mellitus [6], stroke [7], and cerebral palsy [8]. Previous studies have mainly used regression analysis and structural equation modeling [9] methods, with decision tree [10] as the only data mining method.
In this study, we used screening materials from a large-scale, comprehensive national survey with a prolonged analysis period, including many chronic diseases of diverse types, and influencing factors for the elderly with chronic diseases. This study used these resources to develop a HRQoL prediction model to identify HRQoL risk groups who require intervention.
Health and medical data are exponentially increasing, necessitating various means to take advantage of huge amounts of data. Big data technologies enable the fast processing of massive amounts of data [11]. Among these technologies, artificial intelligence has regained prominence as an important tool to provide intelligent services for big data, and machine learning (ML) techniques have also been used extensively for such purposes [12].
Clinical nursing datasets are now being generated in an increasing number of healthcare settings, and nurse researchers have been gradually adopting large datasets for studies on nursing quality and the effectiveness of nursing intervention [13]. Though data mining has been used more widely in the business world than in nursing and healthcare, it can be an important tool for the development of healthcare knowledge and knowledge structures. It can also potentially improve the quality of decision-making by clinicians and healthcare administrators.
The purposes of this study were to identify the factors affecting the HRQoL of the elderly with chronic diseases and to develop a HRQoL prediction model that expressly exposes HRQoL risk groups who require intervention. ML techniques were applied and examined for their use in the analysis and prediction of HRQoL for the elderly with chronic diseases. Problems and their solutions in using ML techniques are presented. This study provides vital insights that can be incorporated into the design of personalized health management strategies and the development of interventions program, specifically for HRQoL improvement for the elderly with chronic diseases.
II. Methods
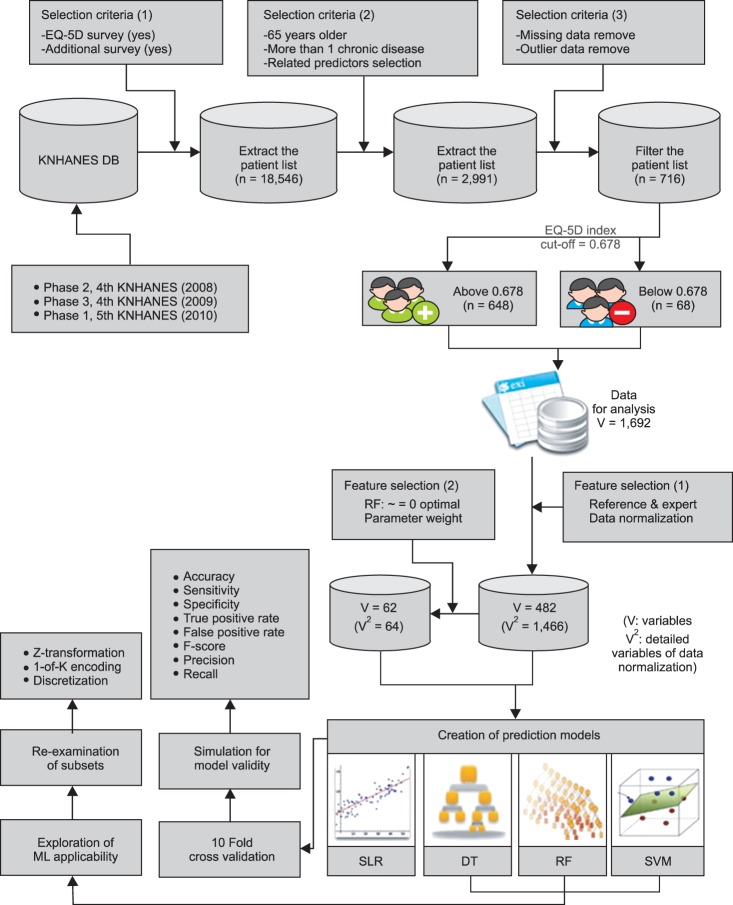
The data extraction and analysis process of this study are shown in Figure 1.
1. Data Source and Preparation
Study samples were extracted from the Korea National Health and Nutrition Examination Survey (KNHANES), which was conducted from 2008 to 2010. This survey, sponsored by the Korea Centers for Disease Control and Prevention, consisted of health interviews, screening, and nutrition examination surveys. Approximately 10,000 people were randomly selected annually. There were 2,991 elderly people (65 years of age and over) with chronic diseases out of the 18,546 cases in total. A set of 716 cases was chosen for our study after elimination of those with missing values, including outliers.
The survey used the EQ-5D as a HRQoL measurement tool, developed by the EuroQol Group. The EQ-5D comprises five health state dimensions (mobility, self-care, usual activity, pain/discomfort, and anxiety/depression) regarding which the respondent is asked to indicate a health state from one of three levels: no problem, some problems, and major problems [14]. A higher EQ-5D index score (range, -0.171 to 1) indicates a better HRQoL.
The HRQoL levels of the elderly with chronic diseases should inform both the content and regimen of healthcare programs. From the vantage point of cost and efficiency in healthcare policy, it is advisable to categorize HRQoL scales in ways that the most vulnerable group receives top priority in intervention. To identify the risk group, the cut-off value was set to the EQ-5D index score of 0.678, which is equivalent to the value when all of the five EQ-5D questions receive the response of 'some problems'. Based on the cut-off value, our study cases were divided into two groups.
The study cases were limited to the chronic diseases included in KHANES: hypertension, hyperlipidemia, stroke, angina pectoris, myocardial infarction, diabetes, thyroid disease, kidney failure, osteoarthritis, rheumatoid arthritis, osteoporosis, tuberculosis, asthma, gastric cancer, hepatoma, colorectal cancer, breast cancer, cervical cancer, lung cancer, other cancers, hepatitis B, hepatitis C, and liver cirrhosis. They were also limited to those who, in the morbidity question of the survey, answered 'yes' to past illnesses, and 'yes' to having been diagnosed by doctors, and who were diagnosed with diseases more than one year ago. In the data preparation stage, both the number of chronic diseases and the total duration of the diseases for each case were calculated. The duration of a disease was calculated by subtracting the current age of the case from the year when he/she was diagnosed with the disease.
Data normalization is a process in which data are transformed in ways that ensure consistency, minimal redundancy, and maximal stability of data, without data loss or unnecessary information added to the original data. For normalization, Z-transformation [15], 1-of-K encoding scheme coding [16], discretization [17,18], and new variable generation methods were used.
2. Data Analysis
The Statistical Package for the Social Sciences (SPSS) ver. 20.0 (IBM, Armonk, NY, USA) and Matrix Laboratory (MATLAB) ver. 7.14, R2012a (MathWorks, Natick, MA, USA) were used for data analysis. MATLAB is a high-level technical computing language and interactive environment for algorithm development, data analysis, visualization, and numerical computation.
We carried out descriptive statistics, Žć2-test, and stepwise logistic regression (SLR) analysis, with the significance level of p < 0.05. Decision tree (DT), random forest (RF), and support vector machine (SVM) algorithms were used in MATLAB.
The HRQoL was measured by EQ-5D. Using an EQ-5D score of 0.678 as a threshold value, our cases were grouped into two groups: one (n = 648) with an EQ-5D score equal to or greater than 0.678 and the other (n = 68) with a score lower than 0.678.
3. Development of Prediction Models
We built a DT model by running the 'ClassificationTree.fit' function in MATLAB on 482 variables as input data, and the 'COST' function was applied for feature weights.
RF is a combination of tree predictors such that each tree depends on the values of a random vector sampled independently and with the same distribution for all trees in the forest. The 'TreeBagger' function in MATLAB was used to build our RF models using 482 variables with the 'COST' function applied for feature weights.
SVM tries to model input variables by finding the separating boundary called the 'hyperplane' to achieve classification of the input variables. The 'svmparam' function in MATLAB was used to build our SVM model with the radial basis function kernel applied as its classification method. Against the 64 variables identified as important from the RF model, we assigned various values to c (cost) and ╬│ (gamma) to measure F-scores.
SPSS was used to build our SLR model, with the p-value <0.05. At the 8th step of variable selection, a statistically significant result was obtained (p = 0.000). In terms of a goodness-of-fit measure, the regression model had a Cox & Snell R2 value of 0.200, and a Nagelkerke R2 value of 0.429.
III. Results
1. General Characteristics of Participants
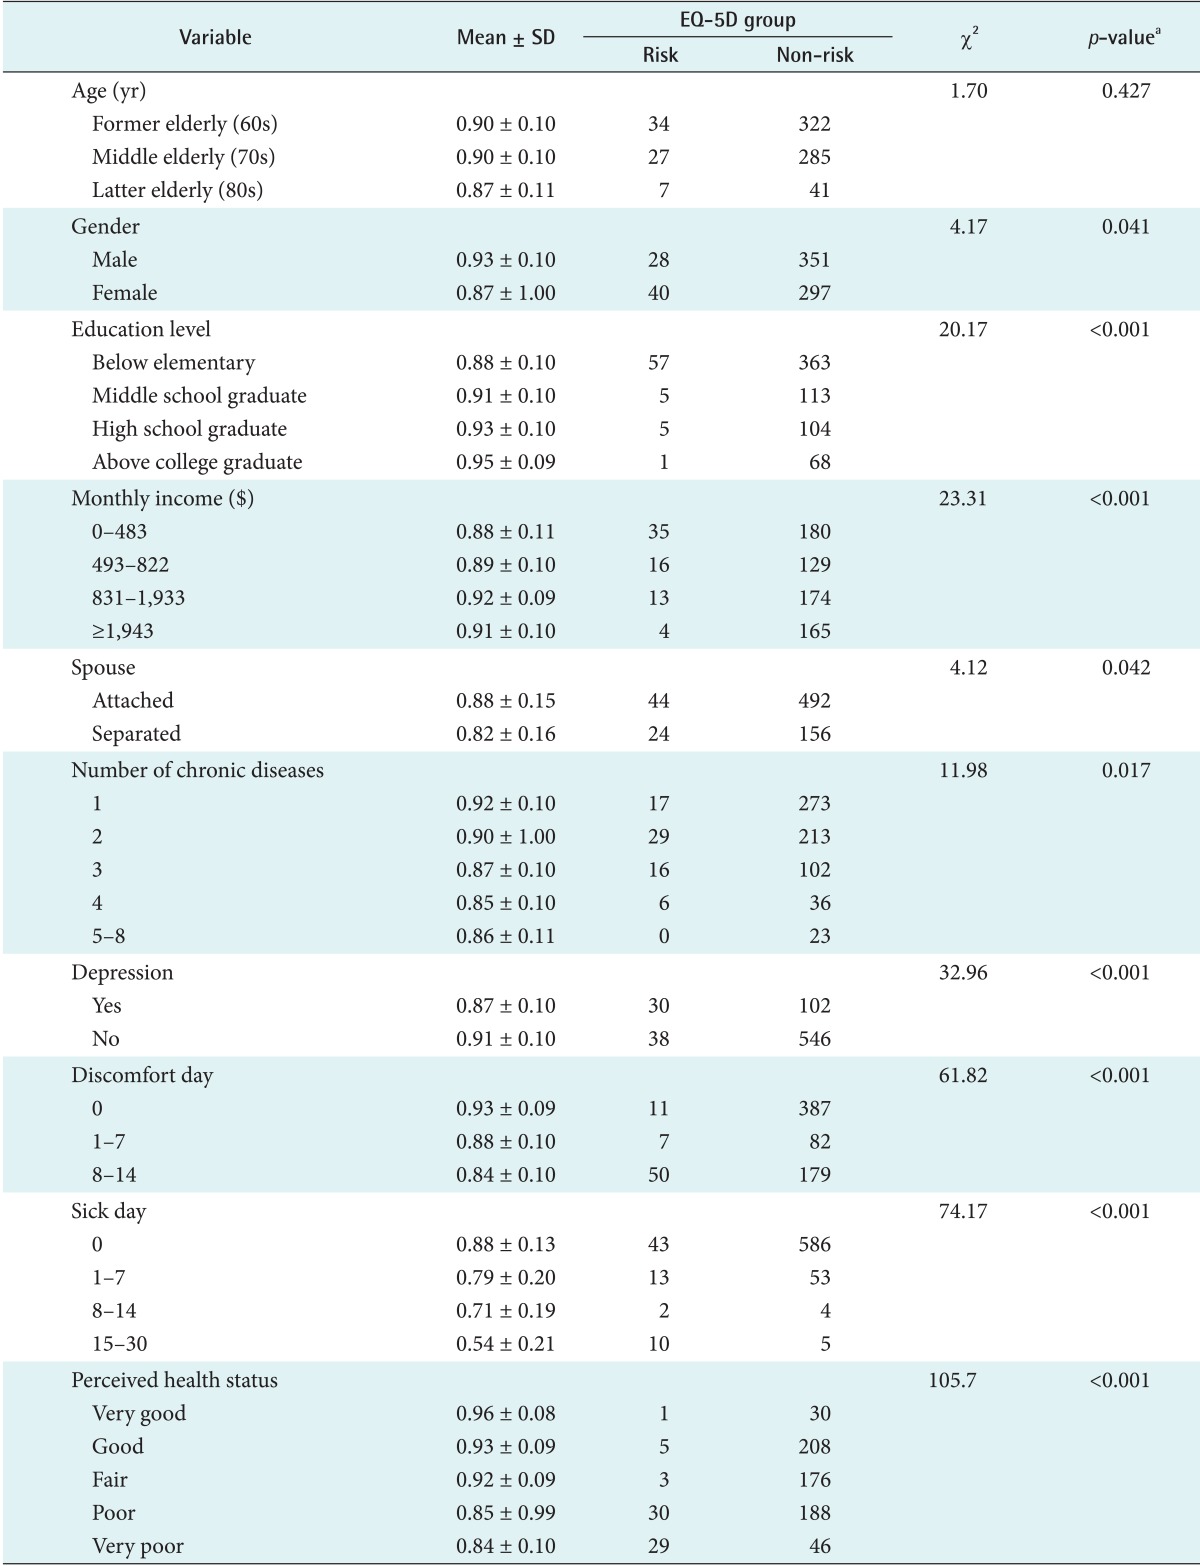
The mean age of the participants was 70.6 years. There were 379 males (52.9%) and 337 females (47.1%). There were 136 cases (19.0%) who belonged to the top 25% in income levels and 221 cases (30.9%) who belonged to the lowest 25%. There were 420 cases (58.7%) who had elementary education or lower. There were 536 cases (74.9%) who lived with their married spouses and 157 cases (21.9%) who were widowed. There were 451 cases (63.0%) who were unemployed and 146 cases (20.4%) who were engaged in agriculture or fishing (Table 1).
2. Differences in the Level of HRQoL according to General Characteristics
Taking an average EQ-5D score for each variable, the following variables exhibited higher average EQ-5D scores when the values of the variables were male, higher education (education), higher income (monthly income), living with spouses (spouse), lower number (chronic disease number), no depression (depression), fewer days (discomfort days), fewer days (sick days), or better (perceived health status). There was no significant difference between the risk group and the non-risk group for age, job, family, chronic diseases total duration, body mass index (BMI), and drinking variables. Table 2 shows differences in levels of the HRQoL in light of the general characteristics of the subjects.
3. Influencing Factors of HRQoL
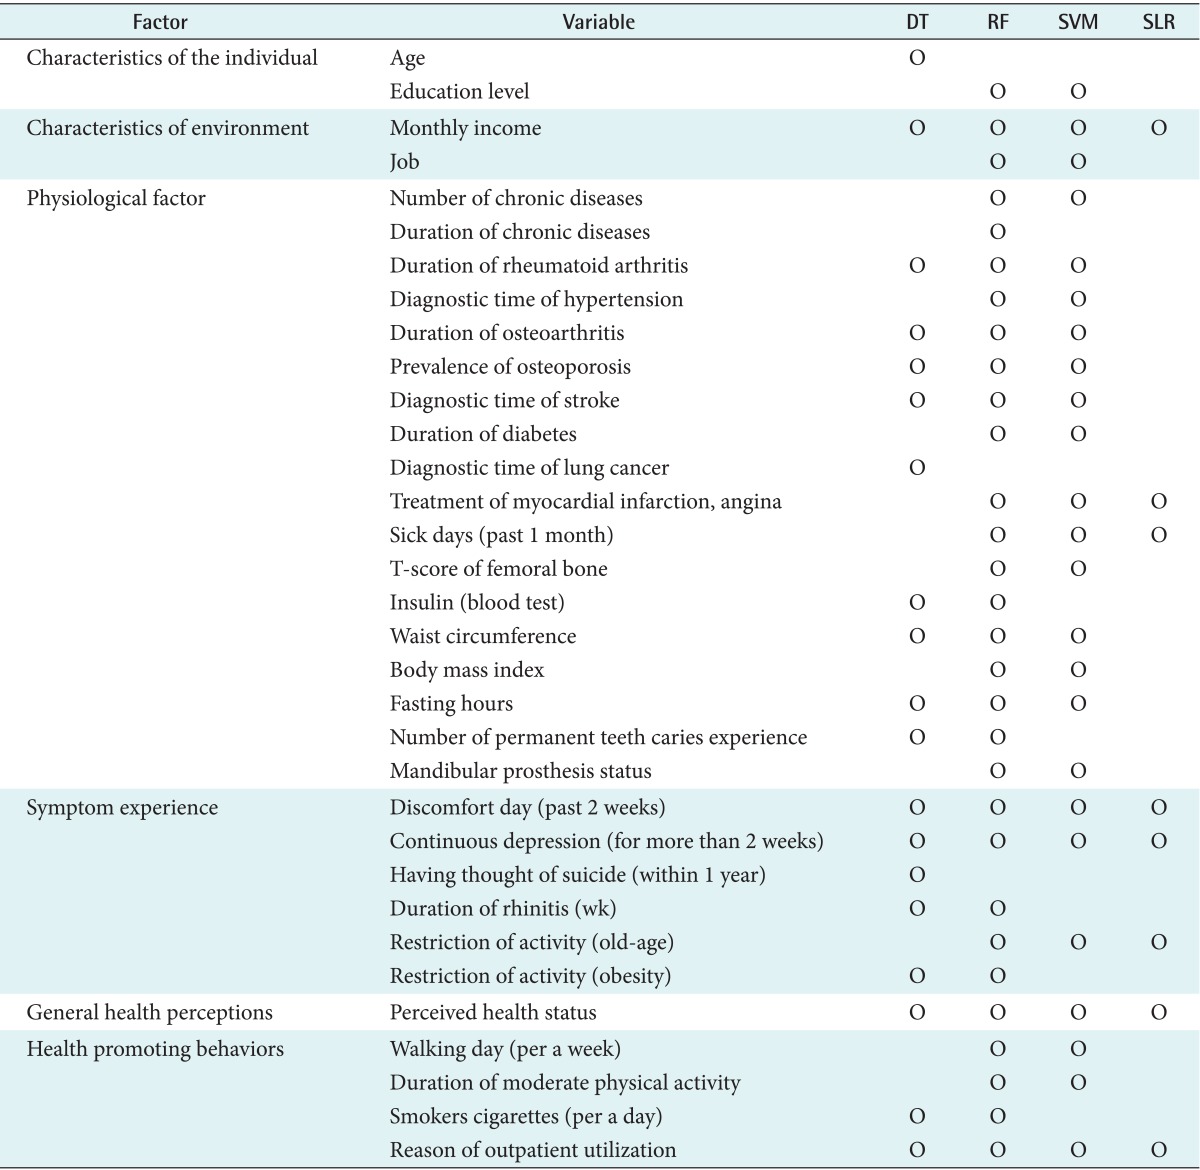
SLR analysis and three ML techniques, DT, RF, and SVM, were used to identify the factors affecting the HRQoL of the elderly with chronic diseases. The DT analysis identified 26 variables of importance with reason for activity restriction (obesity) being the root node. By the RF analysis, important variables could be identified by variable weights of importance, and optimal parameter weights (OPW) were used to find 64 variables with OPW values being not equal to zero. There were 32 variables, identified by SVM. In the end, the number of variables to be used as input data for our study amounted to 74, and they were gathered through literature review combined with the results of the three ML techniques. Out of the 74 variables, the SLR analysis identified 8 variables as significant. Table 3 shows some of the 74 variables organized by factors that affected the HRQoL of the elderly with chronic diseases.
By applying the SLR and complementary ML techniques, additional variables were identified that helped predict the HRQoL of the elderly with chronic diseases: duration of osteoarthritis, prevalence of osteoporosis, diagnostic time of stroke, mandibular prosthesis status, having thought of suicide, and others. However, these variables, though affecting the HRQoL, were excluded from the current study because they could not be validated statistically.
Univariate and multivariate analyzes were performed on the variables identified from the ML analyses. The variables used in the multivariate analysis did not show any statistical significance; however, in the univariate analysis, duration of osteoarthritis, prevalence of osteoporosis, diagnostic time of stroke, mandibular prosthesis status, and having thought of suicide were significantly different between the two groups. In other words, the elderly people with chronic diseases had lower HRQoL scores when they had longer periods of osteoarthritis, suffered from osteoporosis, were diagnosed with stroke at a later stage of their life, had thought of suicide within one year, and had extensive mandibular prosthesis.
4. Resulting Prediction Models
In the resulting DT model, the diagnostic time of stroke was the dividing factor for the HRQoL for those subjects for which the restriction of activity was not due to obesity and the duration of osteoarthritis was less than 2.5 years. Also, the prevalence of osteoporosis was the dividing factor for those subjects for which the restriction of activity was not due to obesity and the duration of rheumatoid arthritis was more than 2.5 years. On the other hand, when the restriction of activity was obesity, if the discomfort day (recent 2 weeks) was less than 5.5 days, the diagnostic time of osteoarthritis was an important variable, or else the perceived health status was a variable of significance.
In the resulting RF model, the number of trees built was increased from 1 to 200 consecutively to measure the performance of each tree. Four trees showed the highest F-score of 0.346.
In our SVM model, the best performance was achieved with an F-score of 0.507 when c = 0.819, ╬│ = 0.3012, the number of used variables = 50, and the feature weight (w) = 10.
In our SLR model, 8 variables were found to be significant as shown in Table 4: continuous depression for more than 2 weeks (p = 0.002), treatment of myocardial infarction, angina (p = 0.038), reason of outpatient utilization (p = 0.004), monthly income (p = 0.007), perceived health status (p = 0.011), sick days (past 1 month) (p = 0.007), discomfort days (past 2 weeks) (p = 0.002), and restriction of activity (old-age) (p = 0.002).
5. Evaluation of Prediction Models
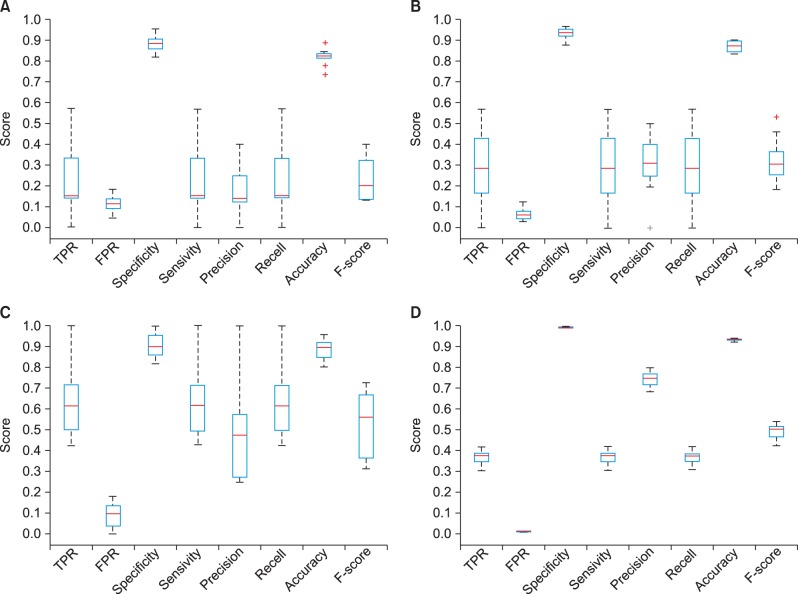
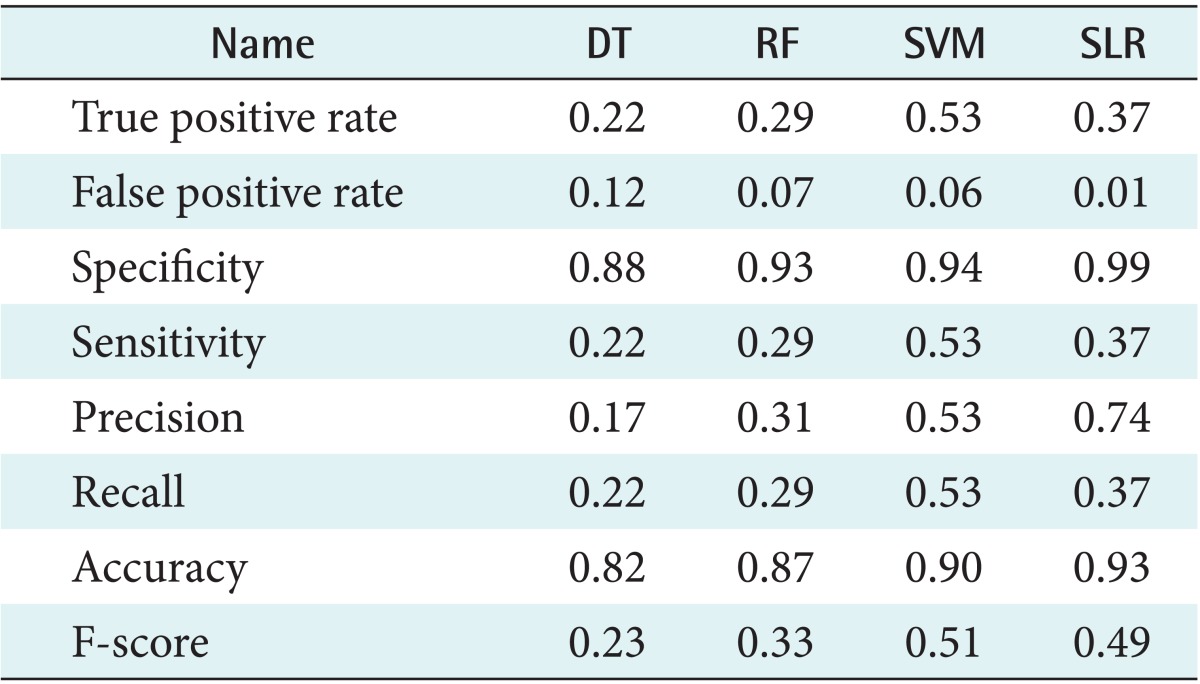
To validate each prediction model, we used a 10-fold cross validation. In 10-fold cross-validation, the data set is divided into 10 parts. Then training is carried out with 9 and testing with1; the process is repeated until all parts have been tested. A confusion matrix was built to gauge the performance of each model. Each model's performance was measured by 8 parameters, such as accuracy, sensitivity, precision, recall, and F-score. As shown in Table 5 and the corresponding box-plots provided in Figure 2, the SLR model ranked the highest (accuracy = 0.93, F-score = 0.49). After the SLR model the SVM (0.90, 051), RF (0.87, 0.33), and DT (0.82, 0.23) models rank in decreasing order of performance.
The accuracy measure was given the highest importance because the main goal of the study is to find a prediction model that best divides the variables. The SLR model not only exhibited the highest accuracy, but also used the fewest variables (8 variables). The DT model used 1,482 variables, the RF 64, and the SVM (c = 0.819, ╬│ = 0.3012, w = 10) 32. Hence, the SLR was found to be the optimal model that efficiently predicted the HRQoL groups for the elderly with chronic diseases.
A series of SVM models was created by applying 1-of-K encoding and discretization normalization schemes. For example, the 11 variables-number of chronic diseases, total duration of chronic diseases, age, femoral bone T-score, discomfort days (recent 2 weeks), sick days (past 1 month), duration of osteoarthritis, duration of rheumatoid arthritis, duration of diabetes, BMI, copayments for outpatient-from the hierarchical clustering were normalized by the application of discretization and 1-of-K encoding. They were then used to create an SVM model, which was in turn compared against the SVM model that was not normalized. The accuracy of the model with data normalization was 0.87, whereas that of the model without normalization was 0.72. In our tests, though limited in scope, we found that the performance of an SVM model increased as variables were normalized by the application of discretization and 1-of-K encoding.
IV. Discussion
Out of the 8 variables or factors that the SLR model demonstrated to be significant, 5 factors were found: monthly income, diagnosis of chronic disease, depression, discomfort, and perceived health status. The values of these factors dictate the HRQoL of the elderly with chronic diseases.
On the other hand, variables, such as age, gender, education level, job, family, number of chronic diseases, duration of chronic diseases, BMI, physical activity, smoking, drinking, did not seem to significantly affect the HRQoL. It is, therefore, necessary to steer more focus on, and to build health management strategies and intervention in accordance with, those variables that affect the HRQoL. In other words, considering the fact that factors affecting each chronic disease vary, intervention methods should be developed to address such differences. Also, previous studies [19,20] on adults or the elderly showed that employment and the types of employment act as significant factors, but when restricted to the elderly with chronic diseases, employment exerted no influence on the HRQoL. Hence, for the elderly with chronic diseases, intervention focus should be directed towards ways to help them adapt to diseases, rather than towards employment.
As one study reported [21], factors, such as cultivation of self-confidence, levels of self-management, and acceptance of chronic diseases, decide health status and eventually quality of life. According to the univariate analysis in the present study, the number of chronic diseases and the combined period of chronic diseases do not always correspond to the HRQoL levels. That is, for example, a higher number of chronic diseases do not necessarily translate into lower levels of HRQoL; rather, as a patient adapts more to his/her illnesses, the HRQoL level bounces back to higher levels at certain point in time.
Of course, an elderly person with chronic diseases will show a lower level of HRQoL than the elderly without them do. Intervention focus, however, should not be so much on diseases themselves, but on comprehensive intervention methods that alleviate depression and/or discomfort, and promote higher perceived health status.
The ML models in the study showed relatively less promising accuracy and efficiency levels than the SLR model did. To ascertain the problems, we tested SVM by applying different data normalization schemes as follows. A sample re-test set was created, which consisted of the 8 variables found to be significant in the SLR model. Eleven additional variables were selected by experts from 74 variables that were clustered by way of hierarchical clustering [22].
This study had the following limitations. 1) It was limited to examining the impacts of individual variables; we did not examine how each variable affects others; nor did we study the nature of direct or indirect influencing factors. 2) Since the survey used EQ-5D, a general instrument without any specific population groups being targeted, it may be necessary to develop HRQoL measurement tools for the elderly with chronic diseases that address disease-specific requirements and factors related to both individual and complex chronic diseases.
Our study is, to the best of our knowledge, the first attempt to use ML techniques to identify the influencing factors and to apply prediction models for the HRQoL of the elderly with chronic diseases as an alternative and complement to the traditional statistical approaches. Our source data were designed to be used for statistical analysis, which may explain the reason for relatively poor performance of the ML models [23]. Nevertheless, ML models may open new possibilities to find health-related factors that otherwise would be hidden in traditional analysis methods.
This study used data from the KNHANES to analyze factors that affected the HRQoL of the elderly with chronic diseases. We used ML techniques as a supplement to the SLR to develop prediction models for HRQoL risk groups. New influencing factors were identified, with incidental insights that, for ML techniques, data normalization of mixed-type data and careful selection of variables had significant impact on the performance and efficiency of the techniques.
Our study can be used as data in healthcare for the development of new clinical assessment and interventions for the elderly with chronic diseases. In other words, it would be possible to develop, specifically for the elderly with chronic illnesses, an HRQoL measurement tool that helps prioritize intervention for HRQoL risk groups. Based on the identified influencing factors, this study could also provide guidelines for healthcare staff in caring for the elderly and could help fine-tune and improve healthcare intervention in practice.