I. Introduction
Traditional face-to-face detailing methods with paper brochures have been steadily replaced by electronic detailing (hereafter, e-detailing) [
1]. E-detailing is a new communication channel to promote pharmaceutical products to physicians using digital technology, including the internet, video conferencing, and interactive voice responses [
2]. However, new technology does not diffuse automatically. Professional interactions between individual medical representatives (MRs) and doctors in the hospital as a social setting are often “sticky” and have often stubbornly resisted substantial changes. In our context, MRs refer to experts who promote and sell companies’ medical supplies, including prescription drugs and medical equipment. They provide general practitioners and hospital doctors with various details about their companies’ medications. Kwak and Chang [
1] found that MRs still used paper brochures more frequently than PCs or mobile devices, even when their company provided laptop computers and/or tablet PCs.
Concerns regarding the global spread of coronavirus disease 2019 (COVID-19) have recently made it more difficult for MRs of pharmaceutical companies to physically visit hospitals and meet medical doctors than ever before. Hospital policies often strongly discourage face-to-face interactions between MRs and physicians. Therefore, MRs have become increasingly interested in marketing activities that provide drug information without physically contacting doctors in person. In the contactless era, most marketing activities are based on information and communication technologies (ICT), mainly internet and mobile devices. Although practical interest in e-detailing has grown among pharmaceutical companies, little research has investigated MRs’ attitudes and perceptions regarding remote e-detailing.
Accordingly, this study attempted to identify the perceptions of MRs, in addition to personal innovativeness attitudes, that affect users’ intentions to adopt new remote edetailing technologies. To accomplish this aim, this study adopted the technology acceptance model (TAM), which was developed by Davis [
3] to predict the acceptability of information systems, and originated in the theory of reasoned action [
4]. The model suggests that the user acceptance (UA) of an information system is determined by both the (potential) user’s attitude and his or her perception of its utility. Davis [
3] also suggested two self-efficacy perspective concepts as antecedents that determine users’ attitudes and behavioral intention to use a novel technology. Explicitly, these two major concepts are (1) perceived ease of use (PEOU) or “the degree to which a person believes that using a particular system would be free of effort” and (2) perceived usefulness (PU) or “the degree to which a person believes that using a particular system would enhance his or her job performance” [
3]. The previous literature largely confirmed that (1) PEOU has a positive effect on (potential) users’ PU of the technology, and that (2) the relationship between PU and UA is stronger than that between PEOU and UA [
3].
Over the past 30 years, the TAM framework has evolved into a major analytical model for understanding human behaviors of acceptance (or rejection) of novel technologies, and a significant number of studies have been conducted based on the TAM model [
5]. The results of those studies have shown the strength of the model and its broad applicability to new technologies in various industries. The TAM model has been widely applied to various ICT areas such as electronic services, mobile data services, self-service technologies, and electronic learning [
6]. In the health services sector, the most commonly used technological contexts have been telemedicine, Electronic Health Records (EHRs), mobile applications, hospital information systems, and electronic prescriptions based on a review of 134 studies published from 1989 through 2017 [
7]. According to that review, the TAM model is useful for understanding users’ acceptance of ICT technologies, and a wide range of contextual factors and circumstances were introduced to account for the acceptability of various technologies. For example, for task-related systems such as EHRs, the model is often connected to educational processes, such that PU and self-efficacy related to learning can be expected to have stronger effects on usage than PEOU.
Independent of TAM, there is a strand of literature emphasizing the role of personal characteristics favoring technological innovativeness or individual propensities leading to early adoption of new technologies. Rogers [
8] defined personal innovativeness as “the degree to which an individual or other unit of adoption is relatively earlier in adopting new ideas than other members of a system.” Individuals with such attitudes can play the role of innovators or opinion leaders, who critically shape a group’s overall attitudes towards a specific technology. Several empirical studies have contributed to the conceptual validation of individual innovativeness in survey research contexts [
9,
10]. In particular, the inclusion of personal trait constructs commonly used in information systems research, such as personal innovativeness (PI) and technology-readiness, into the basic TAM model enhances its explanatory power, especially in terms of PEOU, but also in terms of PU and use intention [
11].
As opposed to theoretical expectations, however, many empirical findings in prior studies revealed that PI may not be directly associated with the adoption (or adoption intention) of various new ideas or technologies. For example, Al-Debei and Al-Lozi [
12] found that PI was not a significant predictor of adoption intention of mobile data services. Lu et al. [
13] found that PI was not a direct predictor of the adoption intention of wireless internet services via mobile technology. Likewise, Leonard-Barton and Deschamps [
14] found no direct effect of PI on adopting an expert system among salespersons in a multinational computer manufacturing company. Instead, many prior studies showed that PI is an antecedent of PU or PEOU or a moderator of new technology use. More specifically, Leonard-Barton and Deschamps [
14] found that pro-innovative attitudes had a moderating effect between management messages/support and expert system use, and Lu et al. [
13] showed that PI was a statistically significant predictor of PU and PEOU of wireless Internet services via mobile technology.
Based on the TAM framework discussed above, this study first addressed two research questions to account for the relationship among MRs’ PEOU, PU, and UA of remote e-detailing:
In addition, as suggested by prior studies on PI, this study also investigated whether MRs who have a greater pro-innovative attitude (high PI) and find remote e-detailing useful are more likely to have a stronger adoption intention of remote e-detailing than those who have a lower pro-innovative attitude (low PI).
The current study conducted similar analyses separately for PCs and mobile devices because these two platforms are the most widely known and representative instruments for remote e-detailing. However, these two technologies are different in that mobile devices can be used while moving from place to place, whereas desktop PCs can be used only at a fixed place. The scope of e-detailing in this paper included remote detailing channels through PCs and/or mobile devices.
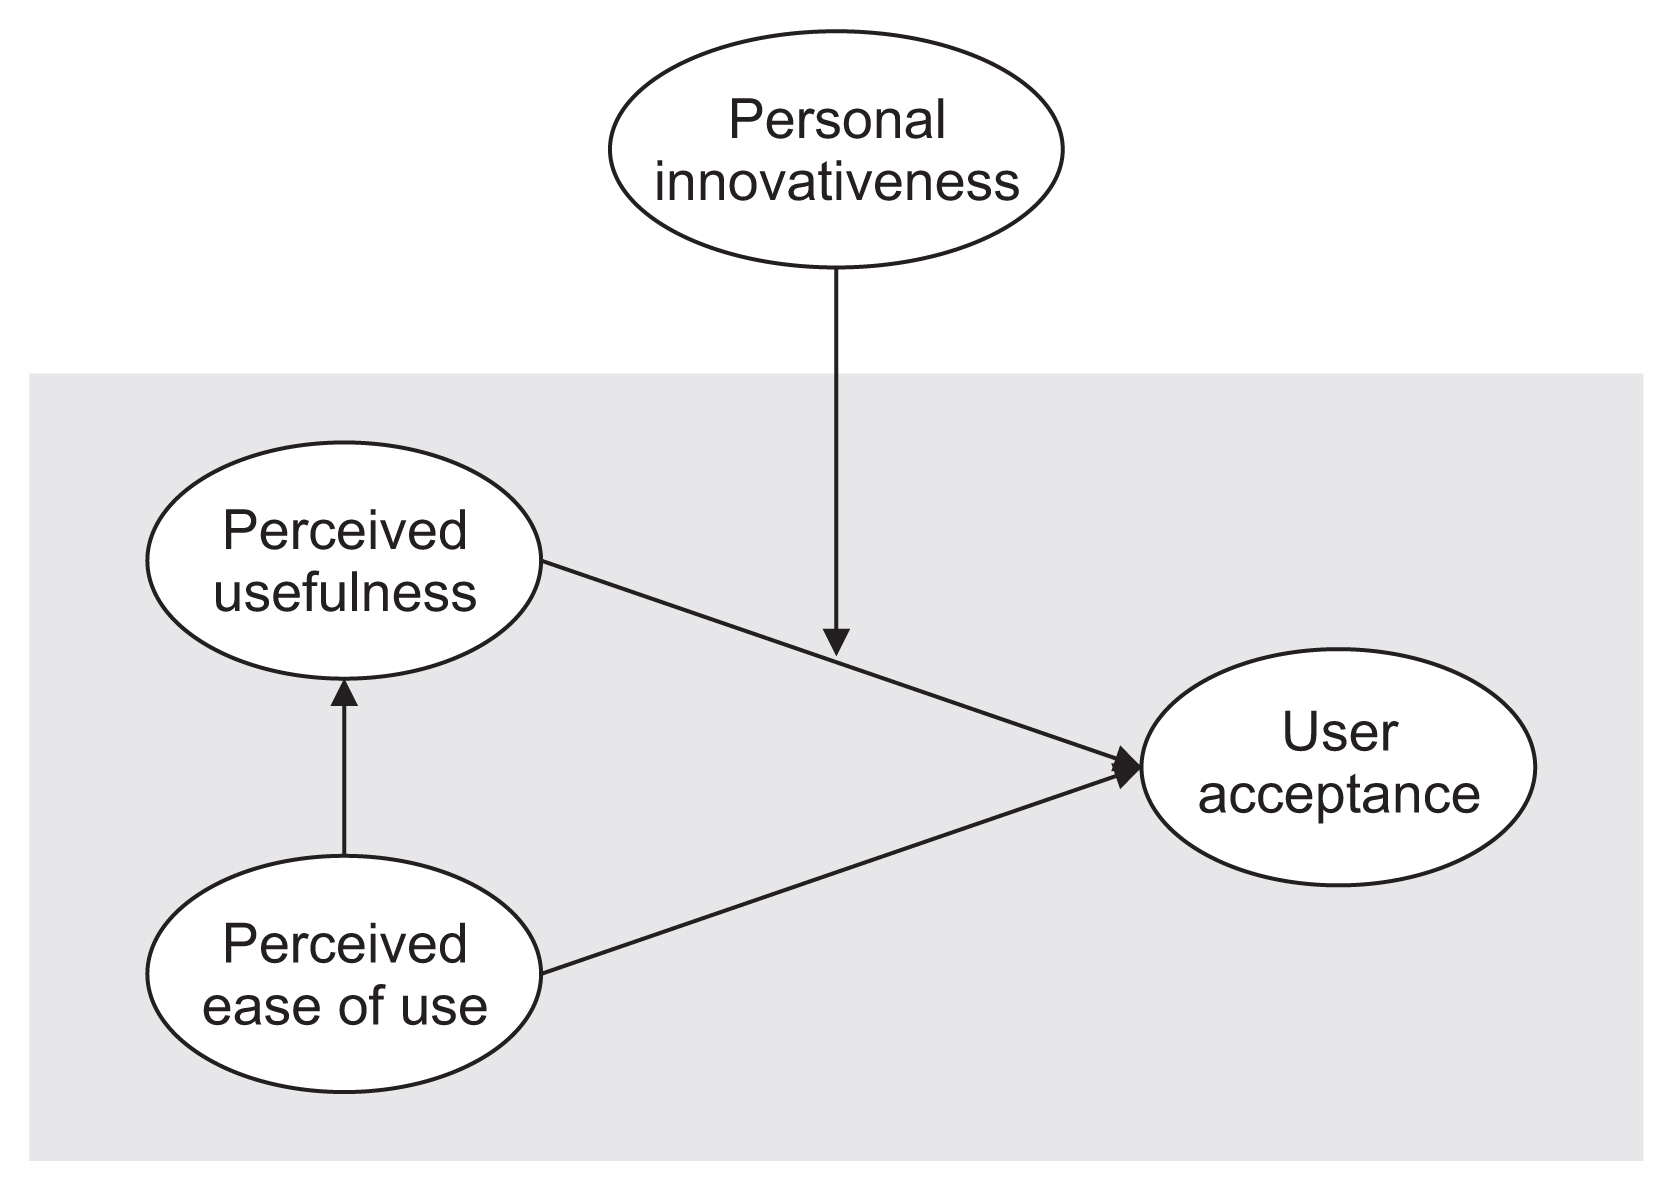
Figure 1 visualizes the current research framework. In addition to the gray area representing the classical framework of TAM, the current study considered the moderating effect of PI. This framework involves a moderated mediation analysis [
15,
16].
II. Methods
1. Data Collection
The subjects of the current study were MRs who did or did not receive laptop computers or tablet PCs as instruments for e-detailing at three major multinational or domestic pharmaceutical companies (Pfizer Korea, Hanmi Pharmaceutical, and Jeil Pharmaceutical) that operate in South Korea and cover large enough market segments to seriously consider introducing remote e-detailing. Pfizer Korea was selected as the multinational pharmaceutical company with the highest sales. Hanmi and Jeil were the largest and the fifth largest domestic pharmaceutical company in South Korea, respectively.
The survey questionnaire contained items about MRs’ attitudes towards as remote e-detailing as a new technology, their PI, and their demographic and workplace contexts. All subjects were contacted between November 5 and 24, 2015 through e-mails. In total, 300 questionnaires were distributed and 221 were returned, with a response rate of 73.7%. The final sample size was 207 after discarding 14 responses with missing values. Although this was the best sampling strategy available to us without a complete sampling frame, our snowball sampling strategy potentially over-represented a few larger pharmaceutical companies. Therefore, the findings of the current research should be interpreted as more exploratory than generalizable.
2. Survey Instruments
The survey contained multiple instruments corresponding to theoretical constructs based on the previous literature. More detailed information on the process of instrument development can be found in Kwak and Chang [
1]. First, 12 questions inquired about two dimensions—PU and PEOU— of individual MRs’ perceptions that might potentially lead to UA of remote e-detailing. The survey asked the same set of questions corresponding to different platforms for remote e-detailing (desktop PCs or mobile devices). The questions were devised based on the TAM literature [
5,
17,
18]. All of the survey items were answered on a Likert scale, with 1 for “strongly disagree” and 5 for “strongly agree.”
Consistent with the literature [
3], principal component analysis with promax rotation showed that five items and three items were classified into PU (eigenvalue = 3.71 and Cronbach’s α = 0.82 for PCs; eigenvalue = 3.70 and α = 0.84 for mobile devices) and PEOU (eigenvalue = 1.09; α = 0.64 for PCs; eigenvalue = 1.21; α = 0.64 for mobile devices), respectively. A few question items that had too low factor loadings or too high cross-loadings across factors were dropped from the analysis.
Table 1 presents the question items (translated from Korean by the authors) and the results of principal component analysis by platform type.
Individual MRs’ propensity to adopt new technology earlier than others in general—or PI—was measured with five survey items, modifying Agarwal and Prasad’s [
19] measurements. These questions inquired about individual MRs’ general attitudes toward new technologies, not specifically toward remote e-detailing.
Table 2 presents the question items (translated from Korean by the authors) and the results of principal component analysis (eigenvalues = 3.72; α = 0.91).
For UA of remote e-detailing, which was the response variable, a single question was used for each platform (PCs and mobile devices), based on a Likert scale. In addition, the survey asked about various characteristics of individual MRs, including gender, education level, position in the company, and working context.
3. Analytic Strategy
The first and second research questions involved an analysis of PU as a mediator, as extensively discussed in the TAM literature. The third hypothesis inquired whether PI was a statistically significant moderator in the relationship between PU and UA. To test for moderated mediation, this study regressed the mediator (PU) on the independent variables (PEOU, PI, and other controls) in the first stage of the analysis, and then regressed the outcome (UA) on the mediator (PU), PI, and a moderated mediator (PU×PI) in addition to independent variables in the second stage. To estimate the coefficients and standard errors simultaneously across stages, structural equation models were fitted to the data. Analyses were separately conducted by different platform types (PCs or mobile devices).
From research question 2, it was expected that the product of two coefficients representing the relationship between PEOU and PU and that between PU and UA would be statistically significant [
20]. The indirect effect is the product of the regression coefficient between the independent variable and the mediator and that between the mediator and the dependent variable [
21]. Sobel [
21] suggested the delta method for computing asymptotic confidence intervals of this product for the purpose of statistical significance testing (see also Baron and Kenny [
22]). Although this method has been widely used in the previous literature, it requires the assumption of multivariate normality of the product term, which is known to be rather easily violated [
23]. Following the suggestion by Shrout and Bolger [
23], this study relied on nonparametric resampled bootstrap estimates for computing bias-corrected confidence intervals. The bootstrapping process involved 1,000 resamples with replacement. All of the models included the basic characteristics of individual MRs as control variables. Stata 16 (StataCorp., College Station, TX, USA) was employed for all of the statistical analyses.
III. Results
1. Descriptive Statistics
Table 3 presents the descriptive statistics of all the variables included in the following analyses. As the current study generated several variables of interest—PU, PEOU, and PI— using principal component analyses to reduce dimensions of multiple survey items, the means and standard deviations of these variables were, therefore, 0 and 1 in common, respectively. The scores of UA of remote e-detailing on either PCs or a mobile platform ranged from 1 (strongly disagree) to 5 (strongly agree). The means of these two variables were, respectively, 2.74 and 2.71, which are very close to the median of the distributions. In short, the respondents are found to be somewhat positive toward remote e-detailing, as the scores were slightly higher than the neutral score of 2.5.
In the sample, 61% of the respondents were men, and 39% were women. Approximately 89% had graduated from college or university, while 11% held a postgraduate degree. There were no respondents who had not attended college or university. Respondents’ positions in the organization consisted of staff/chief (63%), assistant manager (25%), and manager/deputy general manager (12%). Working context was measured using two variables—the number of physicians for whom they were responsible and the number of medicines for which they were responsible. The mean values for these variables were 12.32 and 2.18, respectively. Approximately 63% of the respondents worked at Pfizer Korea, followed by Hanmi and Jeil, with 19% and 18% of the respondents, respectively.
2. Structural Model Estimates
Table 4 presents the structural model estimates of (1) PU regressed on PEOU and PI, and (2) UA regressed on PU, PEOU, PI, and an interaction term between PEOU and PI. Model 1 examined MRs’ attitudes toward remote e-detailing on PCs, whereas Model 2 dealt with remote e-detailing using mobile devices. Both equations contained the same set of control variables.
The first equations (Outcome: PU) examined the relationship between PEOU and PU. As expected, PEOU was found to be statistically significant and positively associated with PU, when other variables were controlled. Put differently, MRs who found remote e-detailing easy to use were more likely to think that it was useful. This pattern remained largely the same across the platform types (PCs or mobile devices). No difference was found in PU of remote e-detailing across MRs according to different degrees of PI attitude, consistent with prior studies. In terms of z-values, the strongest predictor of PU was PEOU even after other variables were controlled in the models, regardless of the platform. This provides support for the TAM model.
The second equations (Outcome: UA) examined how PEOU, PU, and PI were associated with UA. PU and PEOU were found to be statistically significant and positively associated with UA. Nonlinear combinations of two coefficients showed that the coefficient of PU was 3.7 times larger than that of PEOU for PCs (BPU/PEOU = 3.68; SE = 1.38; p < 0.001) and 3.2 times larger for mobile devices (BPU/PEOU = 3.19; SE = 1.07; p < 0.01). These findings imply that UA was overall more strongly affected by PU than by PEOU, as would be expected within the TAM framework. Consistent with the TAM model, the strongest predictor of UA was PU, even after other variables were controlled in the models.
The interaction term between PI and PU was statistically significant and positively associated with UA using PC. As PI increased, the relationship between PU and PA became stronger. Put differently, when MRs with higher PI attitudes believed remote e-detailing to be more useful, they had a greater propensity to accept this technology than those with lower PI attitudes. PI was not a significant predictor of UA using PC when the interaction term was not included (results not shown). However, this interaction effect was not statistically significant for mobile devices. Instead, PI per se was a significant predictor (B = 0.17; SE = 0.05; p < 0.001) of UA using mobile devices, without an interaction term (results not shown). In short, the results support the moderating effect of PI only for PCs, and not for mobile devices.
3. Direct, Indirect, and Total Effects of the Structural Models
Table 5 reports a summary of the direct, indirect, and total effects of path models, by platform type and by differently specified models. The top three estimates present the causal paths from PEOU, through PU, to UA for PCs, whereas the bottom three present the same causal paths but for mobile devices. Within each platform, the first models (“estimated without controls”) show the three effects estimated from the model with PEOU and PU only, and without any control variables or PI. The second models (“estimated with controls, without moderated mediator”) present the three effects estimated from the model with PEOU, PU, and control variables only, but without an interaction term between PI and PU. The third models (“estimated with controls and moderated mediator”) exhibit the three effects estimated from the model with all of the variables.
For PCs, approximately 62% to 65% of the total variation in UA (as the final stage of technology acceptance) was explained by the indirect effect of PEOU through PU. Meanwhile, for mobile devices, the indirect effect of PEOU through PU accounted for approximately 54% to 56% of the total variation in UA through PU. In other words, on average, the direct effect of PEOU explained up to 45% of the total variation in UA of remote e-detailing, suggesting the direct importance of PEOU or user-friendliness, which lowers the barriers of entry to remote e-detailing and prevents potential confusion both for MRs and doctors.
IV. Discussion
MRs may have various reasons to prefer traditional face-to-face detailing. Arguably, the traditional approach could be quite important for MRs to build personal relationships with and meet physicians in the hospital, beyond simply explaining information on medical products. However, the spread of COVID-19 has made this traditional approach extremely difficult both for MRs and physicians. The pandemic will make it necessary for MRs to move towards e-detailing eventually. Although this study employed a data set collected before the COVID-19 pandemic, it is the most recent, available data set given the current situation, in which it is not feasible for the authors to survey MRs’ perceptions and attitudes toward e-detailing. This study also reveals several important take-aways with respect to attitudes towards the adoption of innovative technology, such as e-detailing among MRs in general.
This study analyzed how individual MRs’ PEOU, PU, and PI were associated with UA of remote e-detailing technology in the pharmaceutical industry. The findings can be summarized as bullet points as follows:
PEOU showed a statistically significant and positive association with PU.
PEOU and PU showed statistically significant and positive associations with UA.
PEOU was a substantially strong predictor of UA, and exerted a strong direct effect on UA, especially with respect to mobile devices.
PI was not a statistically significant direct predictor of PU of remote e-detailing for either PCs or mobile devices.
PI was not a statistically significant direct predictor of UA of remote e-detailing using PCs. However, PI had a statistically significant and positive moderating effect between PU and UA for PCs.
PI was a statistically significant direct predictor of UA of remote e-detailing using mobile devices, but had no significant moderating effect in that platform context.
Consistent with the TAM framework, points (1) and (2) support the causal chain of PEOU→PU→UA. Given the relative difficulties in maneuvering mobile devices, point (3) implies that developing an appealing application interface is a pivotal factor for the successful adoption of remote e-detailing technology as an easy-to-learn and convenient-to-use instrument. With respect to PC, points (4) and (5) support the conclusion that MRs with pro-innovative attitudes will be more likely to play the role of early adopters of remote e-detailing if they find this technology more useful. With respect to mobile devices, on the contrary, points (4) and (6) suggest that MRs with high pro-innovation attitudes would be in favor of remote e-detailing technology using mobile devices, even though they may perceive the usefulness of remote e-detailing as low. Points (5) and (6) are also consistent with the previous literature [
13,
19]. Personal innovativeness as a general attitude towards new technology is a poor predictor of the adoption of new technologies in a specific context. Overall, the current study suggests that different approaches are necessary for users’ adoption of remote e-detailing depending on the platform type.
The current study has certain limitations. Researchers cannot strictly interpret PEOU and PU as causal factors of UA because this study adopted an observational study design, rather than conducting a randomized trial. The current study focused on large pharmaceutical companies in South Korea and the findings are not necessarily generalizable to small companies in South Korea or companies in other countries. Finally, this study did not take into consideration the possibility that diverse organizational cultures (or climates) may affect the social process of technology acceptance beyond individual perceptions or personal innovative attitudes.
Future research will benefit from further investigating how pro-innovative company climates facilitate the social process of technology acceptance to identify organizational policies that would expedite the technology acceptance process in various contexts. Experimental research from the perspective of human-computer interactions will also be highly helpful for designing user-friendly interfaces and creating positive user experiences. This study used a survey conducted in 2015, in which neither MRs nor clinicians felt pressure to adopt remote e-detailing. Another round of survey research will be useful to address how COVID-19 as an unexpected catastrophic event has changed their perceptions and attitudes on remote e-detailing.