


I. Introduction
Currently, computer vision is widely applied in various fields, including medicine, to diagnose and analyze diseases based on medical image. The disorders diagnosed using medical images include thyroid cancer [1] on ultrasound images, back pain [2] on computed tomography scans, breast cancer [3] on mammograms, dental and oral diseases [4] on radiographic images, abnormalities of spinal intervertebral discs [5,6] on magnetic resonance image, and retinal diseasesŌĆödiabetes mellitus [7,8] and glaucoma [9,10]ŌĆöon fundus images. Glaucoma is an eye disease that may be the second-largest cause of blindness in the world. It is an incurable disease; hence it needs to be detected early.
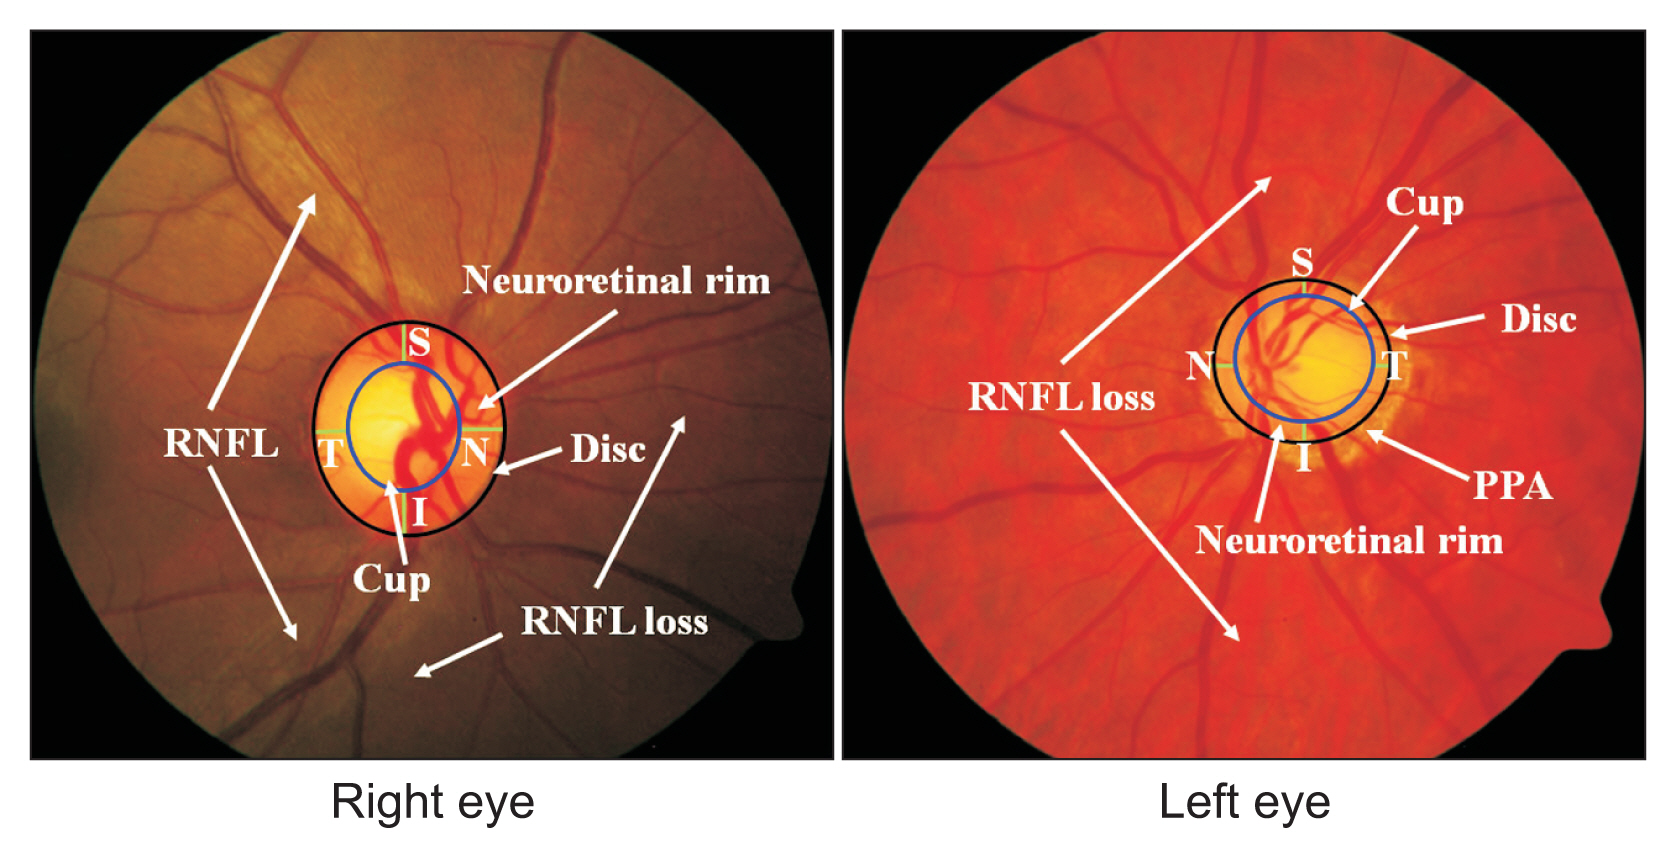
Ophthalmologists diagnose glaucoma manually by evaluating disease features based on retinal fundus images. However, these results may be subjective because they are influenced by differences in educational background, experiences, and psychological factors, especially when dealing with a large number of fundus images. The glaucoma features that need to be evaluated include the cup-to-disc ratio (CDR) [11,12], the neuroretinal rim (consisting of four sections: inferior, superior, nasal, and temporal), peripapillary atrophy (PPA) [13,14], and the retinal nerve fiber layer (RNFL) [15,16]. In previous studies, those features have been extracted and detected automatically. The disc and cup are light-colored round areas, where the cup is located within the disc, while the neuroretinal rim is the area between the disc and cup. Furthermore, PPA is an area outside the disc that presents a crescent-like shape; even in patients with severe glaucoma, PPA appears around the disc, shaped like a ring [14]. Meanwhile, RNFL is a bundle of white striations on the outside of the disc. In glaucoma patients, these striations tend to thinned and even to be lost [15]. The structure of fundus images of the right and left eyes is shown in Figure 1.
The evaluation of those features requires an optic disc segmentation process. Segmentation aims to distinguish the optic disc area from other objects considered as the background. The CDR is derived from the diameter of the optic disc. Meanwhile, PPA and RNFL feature extraction have to discard the optic disc area; therefore, optic disc segmentation is required. This process is still challenging due to differences in retinal structure among patients, as well as the presence of blood vessels that cover the margins of the optic disc. The main techniques that have been used for disc segmentation consist of clustering [11], superpixel classification [17], active contour [18], and thresholding [19]. Deep learning methods have recently been developed with various models [12,20ŌĆō23]. Prior to implementing the segmentation method, pre-processing is applied for several purposes, such as forming a sub-image that focuses on capturing the optic disc area [12,13,17,23,24] to reduce the computation time in subsequent processes and to remove the blood vessels [12,17ŌĆō20] in order to overcome the influence of their presence. Image enhancement has also been applied to clarify the edges of the disc using contrast-limited adaptive histogram equalization (CLAHE) [12,25], filtering [12,17,21,25], and color space adjustment [3,17,24].
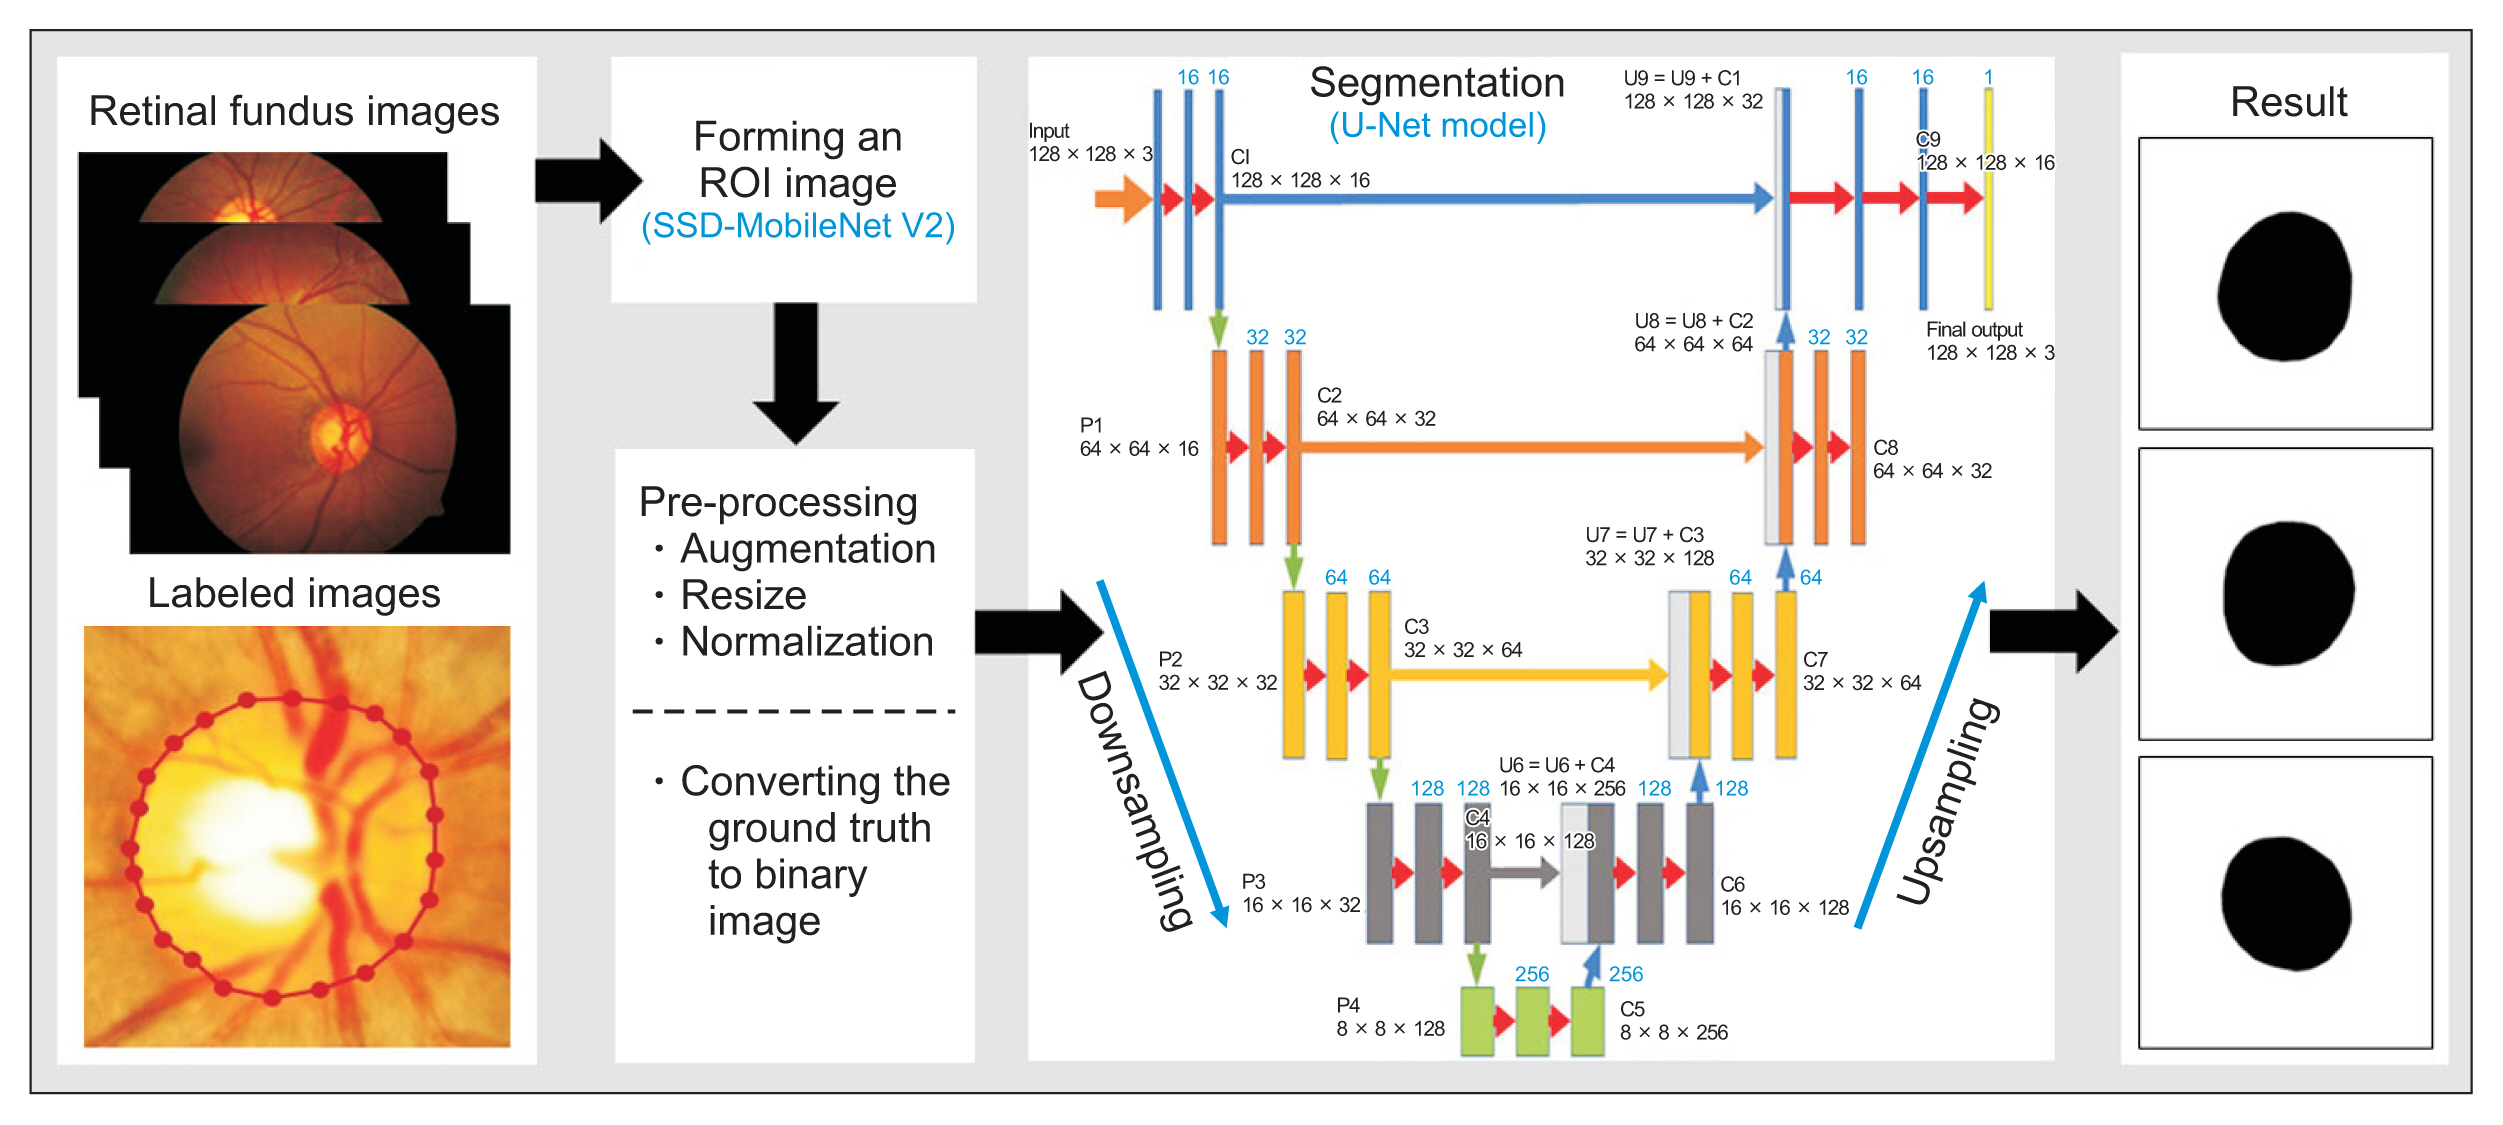
The optic disc is influential in evaluating features on retinal fundus images, especially those related to glaucoma. Research on optic disc segmentation is currently an exciting and developing field. Therefore, this study proposes an automatic method for optic disc segmentation on retinal fundus images required to evaluate glaucoma features. The method applies two convolutional neural network (CNN) architectures: single-shot multibox detector (SSD) MobileNetV2 for forming the region-of-interest (ROI) image and a U-Net model for segmenting the optic disc area, with image inputs of 256 ├Ś 256 and 128 ├Ś 128 in size, respectively. Between both processes, it is necessary to perform pre-processing, which involves augmentation, resizing, and normalization.
The rest of this paper is organized as follows. The proposed method of optic disc segmentation, including a description of the datasets used in this study, the formation of ROI images, pre-processing, and the implementation of the U-Net model, is discussed in Section II. The performance evaluation of the proposed method is reported in Section III. Finally, Section IV discusses the results and concludes this study.
II. Methods
1. Datasets
This study used two datasets to evaluate the proposed method: (1) a private dataset and (2) a public dataset, namely Retinal Fundus Glaucoma Challenge (REFUGE). The private dataset consists of 350 retinal fundus images collected from normal and glaucomatous eyes in Dr. YAP Eye Hospital, Yogyakarta, Indonesia. Approval for the private dataset was obtained from the Ethics Committee (No. IRB KE/FK/0552/EC/2018). Those images were captured at 4288 ├Ś 2848 pixels in JPEG format using a fundus camera with a 30┬░ field-of-view (Carl Zeiss AG, Oberkochen, Germany) and an N150 Nikon digital camera (Nikon, Tokyo, Japan). For all fundus images, the ground truths of the optic disc boundaries were provided by an ophthalmologist with 11 years of experience. Meanwhile, the 1,200 images in REFUGE were acquired using a Zeiss Visucam 500 and Canon CR-2 (Canon, Tokyo, Japan) [26]. The public dataset was used to test the robustness of the proposed method, as described elsewhere [25,27]. The images in each dataset were divided into three sets: training, validation, and testing data, corresponding to 70% (245 images from the private dataset and 840 images from REFUGE), 10% (35 images from the private dataset and 120 images from REFUGE), and 20% (70 images from the private dataset and 240 images from REFUGE), respectively. Both datasets were used separately to train the model with a deep learning structure and evaluate the proposed method.
2. Proposed Method
The proposed method aimed to segment the optic disc on retinal fundus images automatically. There were three main processes: forming an ROI image, pre-processing, and segmentation. Pre-processing involved augmentation, resizing, and normalization. Additionally, the labeled images provided by the ophthalmologist were converted into binary images to form the ground truth. The ground truth was needed in the segmentation to form the structure of the U-Net model. An illustration of the main processes of the proposed method is depicted in Figure 2.
1) Forming an ROI image
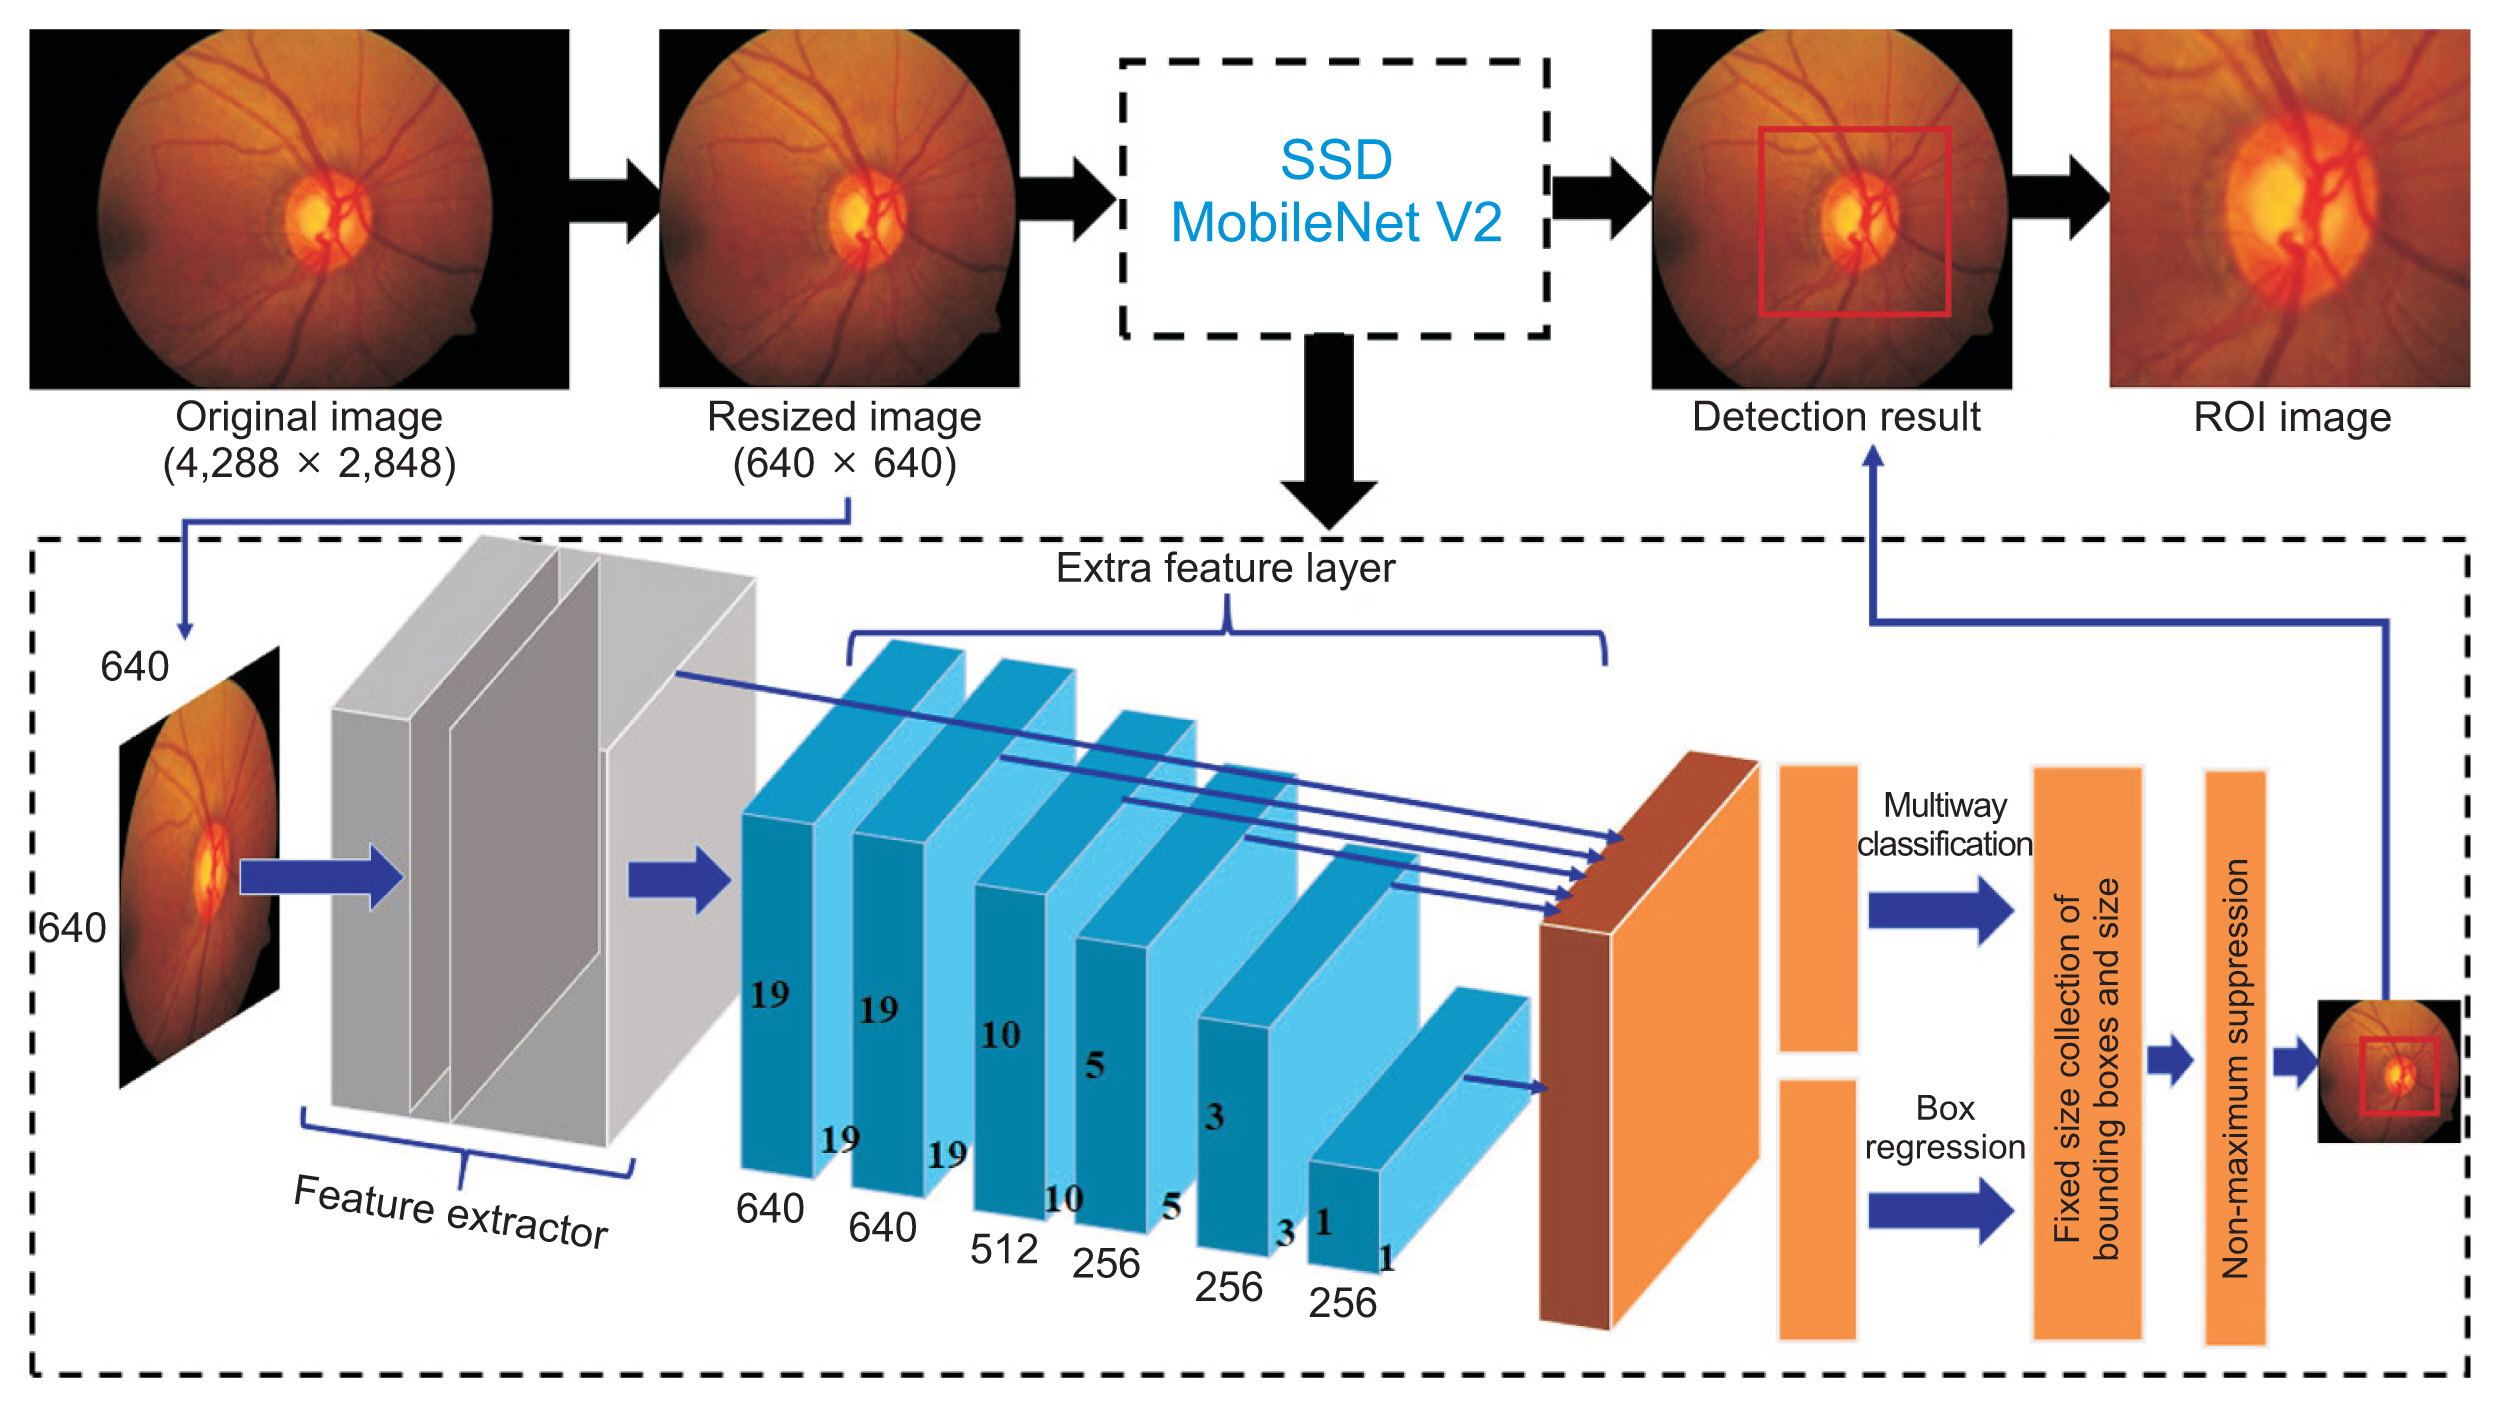
The aim of forming an ROI image is to obtain a sub-image with a smaller size (height ├Ś weight) than the original image by reducing the background area and focusing on the optic disc area, as shown in Figure 3. Consequently, the subsequent process becomes simpler and requires less computing time. This process was applied based on a CNN approach with an original retinal fundus image as the input data. Initially, the original image of 4288 ├Ś 2848 pixels was cropped on the edge (black area), then resized to 640 ├Ś 640 pixels. It was fed into the learning model that was applied to detect the optic disc using the SSD MobileNetV2. In addition, transfer learning was implemented using the COCO17 dataset to train the architecture of MobileNetV2 [28]. The edge of the ROI image did not intersect with the disc boundary to obtain more optimal segmentation results. An overview of the process of forming an ROI image and the SSD architecture is depicted in Figure 3.
2) Pre-processing
Pre-processing was applied to increase the specificity of the main object and enable a better interpretation. This process aimed to simplify the subsequent process and reduce the computation time. Several sub-processes were applied: augmentation, normalization, and resizing, as well as converting the labeled image by an ophthalmologist into a binary image as the ground truth. Initially, the datasets were augmented to increase the variety and the number of images. Hence, the robustness and generalization of the training model were improved. Augmentation was implemented by flipping based on the vertical and horizontal axes [22,23,29]. The following process aimed to resize images of 640 ├Ś 640 pixels to 128 ├Ś 128 pixels as in [3,12]. Furthermore, normalization was conducted by converting all the intensity values into a range from 0 to 1 [23].
3) Segmentation
The proposed method implemented a U-Net architecture to train the dataset, which has been successfully applied to segmenting several kinds of medical images [2,3,23]. This architecture included two paths: downsampling and upsampling. Both of them applied the rectified linear unit (ReLU) as the activation function. In downsampling, two convolution layers of 3 ├Ś 3 in size were repeated in each step of downsampling with the same number of feature channels. Subsequently, maxpooling of 2 ├Ś 2 with two strides was carried out. In each step in downsampling, the number of feature channels was increased gradually from 16 to 256. On the contrary, in the upsampling path, the number of feature channels was decreased from 256 to 16. Furthermore, the up-convolutional layer of 2 ├Ś 2 and two convolution layers of 3 ├Ś 3 were carried out sequentially. Images with a size of 128 ├Ś 128 pixels were fed into the training model. This model used the MobileNetV2 encoder and implemented several hyperparameters, with 100 epochs, a batch size of 16, and a learning rate of 0.00001 [25]. The model training was implemented on a personal computer with a graphics processing unit (GPU) (NVIDIA GeForce GTX 1070) with a memory size of 8 GB and a 3.40 GHz Intel Core i7-3770k CPU.
III. Results
The performance of the proposed optic disc segmentation method was evaluated using five evaluation parameters: precision, recall, the F-score, the dice score (DS), and intersection over union (IoU) [24,27]. Those parameters are calculated as follows:
where true positive (TP) is the number of pixels classified as disc area on a ground truth image and the proposed method, false positive (FP) is the number of pixels classified as non-optic disc area on a ground truth image but classified as disc area by the proposed method, and false negative (FN) is the number of pixels classified as optic disc area on a ground truth image but classified as non-optic disc area by the proposed method. The values of precision, recall, and the F-score lie in the range of 0 to 1. Values close to 1 indicate the accuracy of the proposed method.
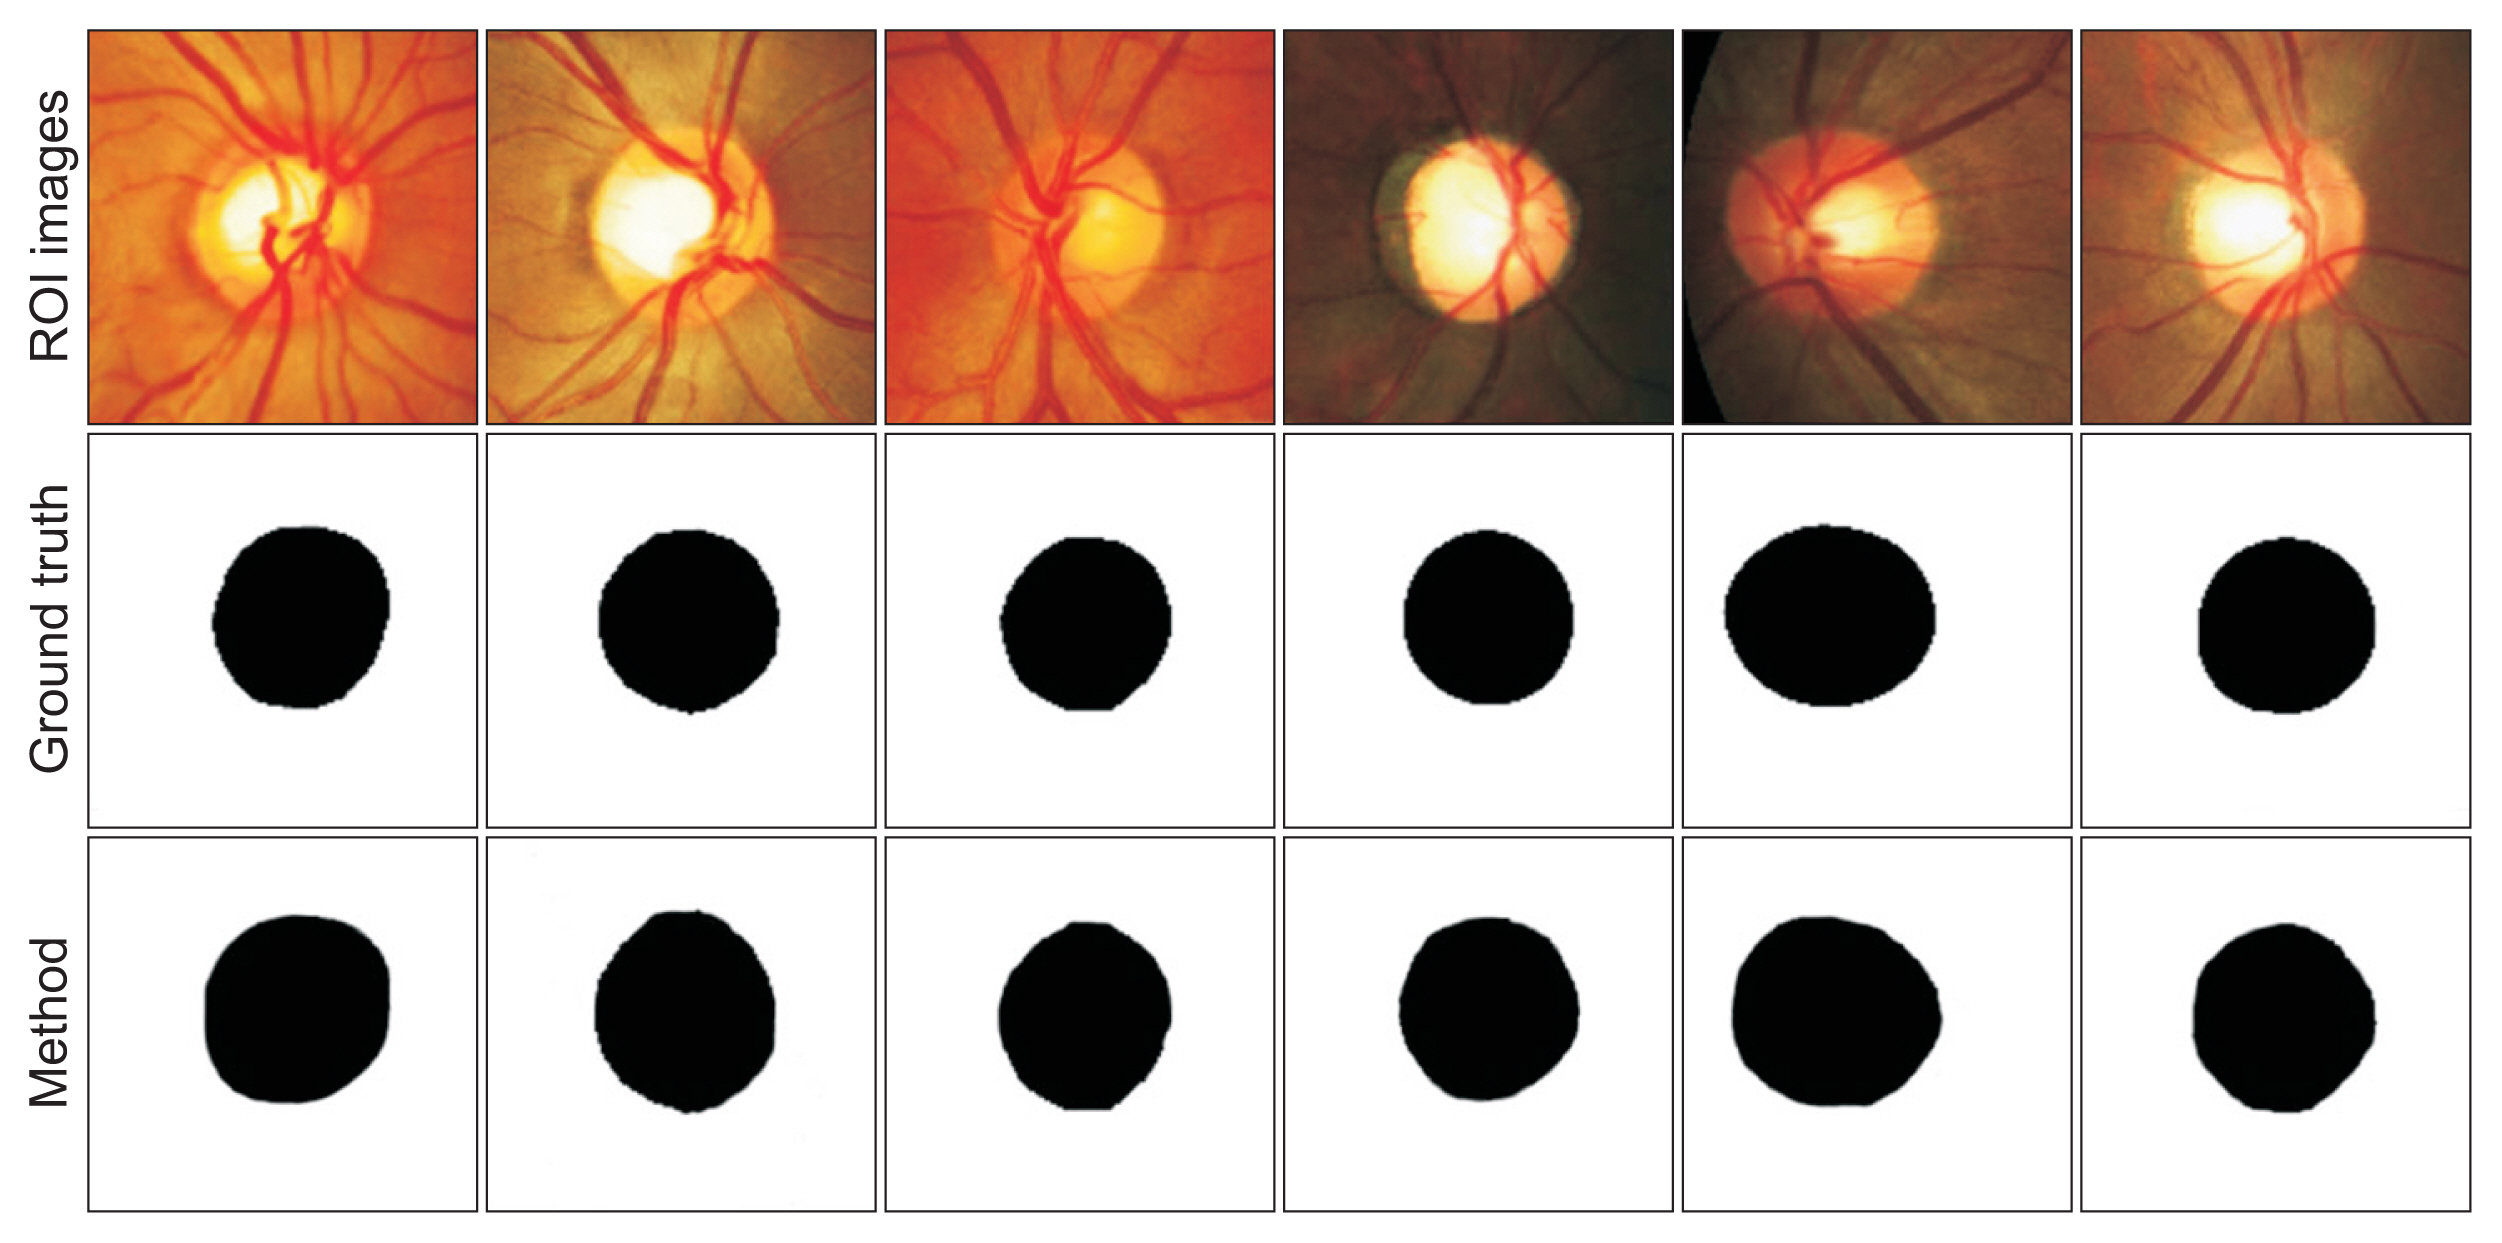
The proposed method was evaluated using retinal fundus images with various structures and image quality. This diversity may affect the results of optic disc segmentation, especially in images containing PPA and cup sizes that are close to the sizes of the discs. An example of a comparison of several disc segmentation results by the ophthalmologist (ground truth) and the proposed method is shown in Figure 4. The performance of the segmentation method of all data is summarized in Table 1.
Figure 4 shows examples of the disc segmentation images obtained from the two datasets: private in columns 1ŌĆō3 and REFUGE in columns 4ŌĆō6. The proposed method misclassified the optic disc area in retinal fundus images containing mild PPA, which caused over-segmentation. Another error generally occurred in patients with severe glaucoma with an optic cup size close to that of the optic disc. Meanwhile, Table 1 shows that the proposed method showed high performance with the two datasets, as demonstrated by F-score, DS, and IoU values of 0.9880, 0.9852, and 0.9763 in the private dataset (computation time: 17 minutes and 56 seconds) and 0.9854, 0.9838, and 0.9712 in the REFUGE dataset (computation time: 59 minutes and 16 seconds). Although the private dataset contained significantly fewer images than the REFUGE dataset, only slight performance discrepancies were observed.
IV. Discussion
An automatic optic disc segmentation method was developed using CNN and U-Net model training. A CNN model was used to form ROI images to reduce the computation time. Subsequently, augmentation and resizing of the ROI image were implemented, followed by normalization of the intensity values. Meanwhile, a U-Net model was applied to segment the optic disc. The proposed method was tested using two datasets (private and REFUGE). The performance of the proposed method was successful, with high values of the F-score, DS, and IoU (0.9880, 0.9852, and 0.9763, respectively, in the private dataset; 0.9854, 0.9838 and 0.9712, respectively, in the REFUGE dataset). These results show that the proposed method is suitable for application to the private dataset and the REFUGE dataset.
Table 2 compares the results of the proposed method with those other methods from previous studies that used the REFUGE dataset, using the F-score and DS [23,25,27,29]. The proposed method successfully achieved F-score and DS values of 0.9854 and 0.9838, respectively. These results show that the performance of the proposed method surpassed the other methods. The proposed method may support the ophthalmologist to automatically localise the optic disc based on fundus images to analyse the occurrence of glaucoma disease. In future work, various segmentation methods can be used to overcome the erroneous and improve accuracy.