


I. Introduction
Determination of the pancreatic volume (PV) has significant potential for solving clinical problems [1]. Changes in the PV are related to pathological conditions of the pancreatic endocrine or exocrine function [2]. Thus, the PV can be used as a clinical marker for disease progression [3]. Several studies have indicated that chronic pancreatitis and diabetes reduce the size of pancreas [4], and pancreatic cancer and acute pancreatitis make the pancreas become focal or show diffuse enlargement [1]. The PV can also be used as a predictor of long-term outcomes or the prevalence of organ-specific diseases after resection [5,6]. Therefore, it is necessary to know the normal anatomic range of the PV for defining pathological conditions.
Computed tomography (CT) has been widely used to non-invasively determine the PV and investigate the relationship between the size of the pancreas and its endocrine and exocrine functions. Previous studies have suggested the average PV using CT [7,8]. According to several studies, various clinical parameters affect the PV. The condition of fat deposition in the pancreas has been associated with PV, age, sex, obesity, and dyslipidemia [7,9]. Additionally, sarcopenia is defined as a reduction in the muscle mass and strength, and it is a progressive disease with aging [10], which leads to functional impairment and physical disability. It increases the risk of obesity and is related to fat deposition in the pancreas [9,11]. Since sarcopenia is common in patients with pancreatic cancer and is known to affect prognosis after surgical resection and chemotherapy [12], studies on the relationship between sarcopenia and PV are needed. However, studies on the PV have suggested different values [1,4,7ŌĆō9]. Because most study populations enrolled have been selected from other ethnicities, study of the average PV is needed for Korean populations. In a recent study, it was found that, compared with Caucasians, Koreans had a significantly lower PV and tended to have a higher fat content in the pancreas [13]. However, the small sample sizes in the study on the PV limited the interpretation of the results; a larger number of subjects is needed to clarify the association between the PV and pancreatic function.
In this study, we investigated the normal PV range using CT volumetry for large populations. Additionally, we analyzed the correlations between the PV and gender, age, obesity, and sarcopenia using CT images.
II. Methods
1. Subject Selection
A total of 1,003 routine health checkup subjects who visited Gachon University Gil Medical Center between January 2017 and February 2020 and underwent abdominal CT scans, were enrolled in this study. The exclusion criterion was the presence of either clinical or CT signs of pancreatic or peri-pancreatic pathology. Additionally, subjects with pathological conditions affecting the PV were excluded, e.g., peritonitis, or a history of chemoradiation due to malignancy in subjects below 19 years of age.
The Institutional Review Board of Gachon University Gil Medical Center approved this study (No. GDIRB2020-121), and no informed consent from the subjects was required. We adhered to the Declaration of Helsinki (1975).
2. Assessment of PV
The subjects underwent abdominal-protocol 3-mm-thick three-phase contrast-enhanced axial and coronal CT for the screening program. The pancreas was segmented manually to define the region of interest (ROI) using software that was developed in-house. The ROI was drawn on all axial planes where the pancreas was present, and all ROIs were joined to construct the volume. The PV was determined by multiplying the total number of pixels in all ROIs by the X-axis, Y-axis pixel spacing, and slice thickness within the pancreas boundary.
3. Assessment of Skeletal Muscle Using CT Images
The skeletal muscle area around the third lumbar vertebra (L3) region was measured and was selected as the standard landmark, as described in previous studies [14]. We used in-house software Gachon_DeepBody developed at Gachon University to automatically determine the skeletal muscle area within a range of ŌłÆ25 to 150 Hounsfield units. The Gachon_DeepBody segmented skeletal muscle using the trained deep-learning model and measured the volume. The deep-learning model was trained using the U-Net [14] in CT images of 2,504 cases. The accuracy for skeletal muscle segmentation was 94.87%. Sarcopenia was determined to be present when the L3 skeletal muscle index (SMI) was Ōēż55 cm2/m2 for men and Ōēż39 cm2/m2 for women, according to previously reported cutoff values for the Korean population [14]. L3 SMI was defined as the cross-sectional area of the muscle at the L3 level normalized with respect to the height, as is conventional for the BMI.
4. Statistical Analysis
Continuous variables are presented as the mean ┬▒ standard deviation (for normally distributed variables) or as the median and range (for non-normally distributed variables). The continuous variables were compared between the two groups using independent-sample t-tests and one-way analysis of variance (ANOVA), and categorical parameters were compared using the Žć2 test. The Duncan multiple comparison test was used to compare group means. The subjects were classified into the following groups: underweight (BMI < 18.5 kg/m2), normal weight (18.5 Ōēż BMI Ōēż 22.9 kg/m2), over-weight (23.0 Ōēż BMI Ōēż 24.9 kg/m2), and obese (BMI Ōēź 25 kg/ m2) [15]. All analyses were performed using SPSS Statistics software version 20.0 (IBM Corp., Armonk, NY, USA), and p < 0.05 was set as the limit for statistical significance.
III. Results
Table 1 shows the baseline characteristics of the subjects, PV, and clinical variables. The mean PV was significantly higher for males (68.818 ┬▒ 19.493 cm3) than for females (55.762 ┬▒ 16.064 cm3). The mean PV values for female and male subjects exhibited a statistically significant difference (p < 0.001).
2. The Relationship between BMI and PV
Table 3 presents the mean PV results for each group. A comparison of PVs according to BMI groups revealed significant differences between the normal weight group and the other groups.
3. The Relationship between Sarcopenia and PV
As seen in Table 4, the PV was significantly higher for subjects with sarcopenia than for those without sarcopenia (p = 0.002). The BMI of subjects with sarcopenia was 26.023 ┬▒ 3.496 kg/m2, and the BMI of subjects without sarcopenia was 23.130 ┬▒ 3.0143 kg/m2.
4. Association between Clinical Variables and PV
As seen in Table 5, the Pearson correlation analysis revealed a statistically significant correlation between the parameters used and the PV. For all three groups, the PV was positively correlated with weight and height. There was a negative correlation between the PV and age for both sexes (r = ŌłÆ0.274, p < 0.001), females (r = ŌłÆ0.259, p <0.001), and males (r = ŌłÆ0.357, p <0.001). We found a statistically significant correlation between the PV and BMI for both sexes, females, and males (r = 0.343, p < 0.001; r = 0.461, p <0.001; and r = 0.224, p < 0.001, respectively). There was also a statistically positive relationship between sarcopenia and the PV (p = 0.002).
IV. Discussion
In this study, we investigated the PV range for healthy subjects and the relationship between the PV and clinical variables, namely, sex, age, BMI, and sarcopenia.
We found that the mean PV for 1,003 individuals was 62.648 ┬▒ 19.094 cm3. Various studies have been performed on the PV [1,4,8,9,13,16ŌĆō18]. For example, Goda et al. [4] reported values in the range of 71.5 ┬▒ 18.7 cm3 for 22 individuals (mean age of 46 years), Geraghty et al. [8] reported values in the range of 64.4 ┬▒ 18.1 cm3 for 46 female individuals and 87.4 ┬▒ 21.3 cm3 for 57 male individuals (mean ages of 49 and 48 years, respectively). The discrepancies in the mean PV compared with those from previous studies may be due to differences in the number, average age, anthropometric characteristics, and genders of the individuals enrolled in the study and differences in the ethnicities between the study populations.
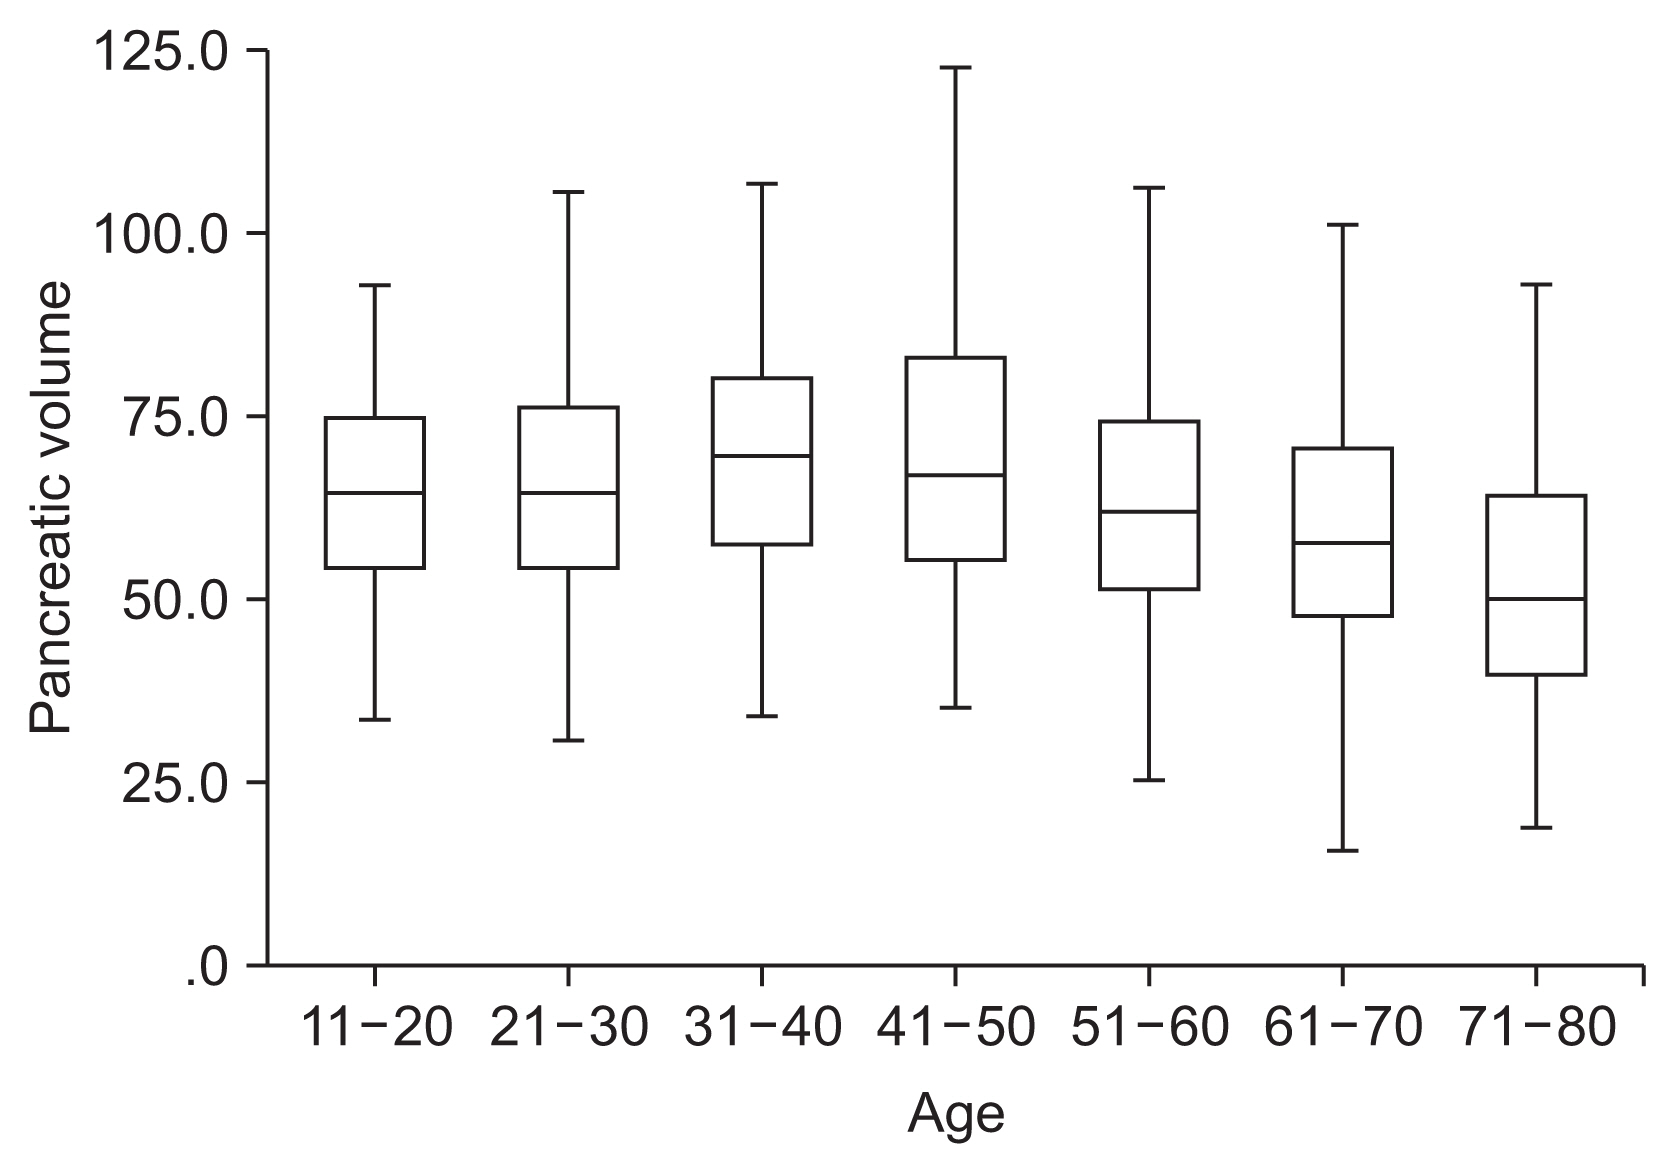
We found a statistically significant correlation between the PV and the age of the participants in the present study. For healthy people, the PV increased with age, and it started to decline after 50 years, which is consistent with the findings of previous studies [16,17].
We found that the mean PV based on CT was 55.76 cm3 for females and 68.82 cm3 for males. The mean PV was 19.0% larger for males than for females, which is consistent with the findings of previous anatomical and radiological studies [1,8,9,16,19]. However, the PV obtained in this study is smaller than those of other studies involving Korean individuals [13]. This could be attributed to differences in the BMI (26.1 kg/m2 in the study of Lim et al. [13] vs. 24 kg/m2 in our study), the number of subjects enrolled, and differences in the anthropometric characteristics.
There was a correlation between the PV and BMI (r = 0.343, p < 0.05), and these results were consistent with previous reports [9,17]. The correlation suggests that obesity affects the PV. The fact that the PV was greater in obese people may be due to an increase in the amount of pancreatic fat rather than in pancreatic parenchyma [9]. The incidence of fatty replacement, which is also known as lipomatosis, is associated with obesity and DM [11,17].
Additionally, there was a statistically significant correlation between the PV and sarcopenia. In this study, approximately 98% of the subjects had sarcopenia and were of normal weight or overweight/obese, and only 2% of the subjects had sarcopenia and were underweight. This indicates the limitation of body-composition evaluation based on BMI. BMI, which is based on the overall body mass, does not differentiate between fat mass and muscle mass [20].
In our study, sarcopenia was measured using CT, which allowed for the determination of changes in the skeletal muscle mass. Sarcopenia is defined as a reduction in the muscle mass and strength and is a progressive disease related to frailty in elderly subjects [21]. Sarcopenia is related to fat deposition in the pancreas as well as in muscle [22]. In the present study, the mean age of subjects with sarcopenia was 53 years, and sarcopenia was present in 41% of the subjects with a larger BMI. We also considered the concept of sarcopenic obesity [23], which occurs with aging and may lead to an increased risk of both sarcopenia and obesity. The subjects with sarcopenia in our study were obese, which is consistent with the findings of a previous study, indicating that the PV is correlated with a high BMI [24].
In contrast, some studies have indicated that the ╬▓-cell function in the pancreas is suppressed with aging [25], reducing the PV. For example, in a study on patients with type I diabetes, the PV was lower for insulin-dependent diabetic patients than for normal subjects [26], suggesting that reduced PV is associated with ╬▓-cell dysfunction. Additionally, a study on the association between sarcopenia and the clinical parameters of ╬▓-cell function and insulin resistance revealed that reduced ╬▓-cell function is associated with reduced skeletal muscle mass in subjects without diabetes [27]. We used CT images to measure the PV; thus, pathological changes, such as reduced ╬▓-cell function in the pancreas, could not be directly evaluated. However, CT allows accurate noninvasive measurement of the PV in vivo, as well as parameters that affect the PV. A recent study on patients undergoing pancreatoduodenectomy indicated that PV measurement via CT was useful for evaluating the pancreatic endocrine function [28].
Our study had several limitations. First, we measured the PV using CT images. Thus, confounding factors (e.g., patients with conditions such as prediabetes, diabetes, and hypertension; contrast medium factors; and CT scanning factors) may have influenced the PV analysis. Second, because the study was conducted at a single tertiary care hospital, the results cannot be extrapolated to the entire population of Korea. Third, we did not measure endocrine cell function in the pancreas. Additionally, because this was a cross-sectional study, we cannot explain the sequential relationship between the PV and the individual-matched variables used in this study. Additionally, sarcopenia is known to be related to aging. In our study, we found that subjects in their teens were diagnosed with sarcopenia using CT images. Therefore, it might be difficult to understand all the comorbidities for the subjects.
The present study had several strengths. First, the results may be more reliable than those of previous studies because a large number of subjects were examined, which may have improved the significance and clinical value of the findings. Second, there were previously no studies in which the PV was correlated with sarcopenia.
In summary, we found a positive correlation between BMI and the PV in a large number of Koreans, which is consistent with the findings of previous studies. Additionally, we found a relationship between sarcopenia and the PV. This study may be useful for the early diagnosis of sarcopenia using CT scans and the prevalence of new-onset diabetes after surgery for pancreatic diseases.