


I. Introduction
Dexketoprofen is a powerful pain reliever that dissolves well in water and has relatively few side effects. It is used for the symptomatic treatment of postoperative pain, musculoskeletal system pain, menstrual pain, and toothache in adults [1]. Dexketoprofen is a cyclooxygenase-1 (COX-1) and COX-2 inhibitor and has been proven to be an effective pain reliever in human clinical studies and animal studies. Clinical studies have demonstrated that the effectiveness of this pain reliever begins within 30 minutes and lasts for up to 6ŌĆō8 hours. However, the active ingredient, which acts quickly and has high activity, has a very bitter taste [2].
Drug formulations, which are developed through research and development studies, are analyzed to obtain market approval for drugs. The data obtained after the analysis must be within the limits requested by the authorities. Pharmaceutical companies are therefore required to conduct numerous trials to reach the desired limits. However, the limited availability of raw materials before sale limits the number of trials. The expectation in pharmaceutical companies is to achieve results in a short time with relatively few trials and to reduce costs. Artificial intelligence approaches have been able to make positive contributions towards these goals [3].
Previous studies have investigated this issue. For instance, Dere and Ayvaz [4] evaluated the effectiveness of traditional approaches used to model drug-drug interactions (DDIs). The aim of their study was to provide a cost-effective and scalable solution to evaluate the effectiveness of similarity-based in-silico computational DDI estimation approaches and to estimate potential DDIs. Commonly known similarity-based computational DDI estimation methods were used to discover new potential DDIs. The drug interaction profile was found to be a better predictor of DDIs than drug side effects and protein similarities between DDI pairs [4].
Machine learning (ML) models are also used in many other areas in the health sector. For instance, an ML algorithm model was developed that could correctly diagnose corona-virus disease 2019 (COVID-19). Tree-based algorithms were used extensively in that study. The extreme gradient boosting (XGBoost) algorithm was found to predict the spread of COVID-19 with high accuracy; therefore, XGBoost can assist in the early detection of COVID-19 [5].
Another study used ML algorithms to evaluate creatinine, which plays a significant role in the detection of end-stage renal disease. Regression methods were used in the dataset. When the results were evaluated, the most important variable was determined to be blood urea nitrogen. Mixed-effects least-squares support vector regression was determined to be the best method to predict serum creatinine levels [6].
In this study, dexketoprofen data were first evaluated with statistical approaches during pre-processing. The t-test was applied using the SPSS program to analyze all output results. Subsequently, mostly tree-based ML algorithms are applied using the Python programming language to predict the dexketoprofen outputs. Seven ML methods were compared to find the best method for estimating the optimal dexketoprofen pharmaceutical dosage formulation. The predicted system output was tested by specialists in the laboratory and the results were evaluated.
This study has potential to save considerable time and monetary resources by making the process of manual formulation iterations obsolete.
II. Methods
1. Dataset Preparation
Each formulation (input) of the dexketoprofen dataset was prepared as a tablet. Granulation was done with two different Eudragit coating levels: low coating (group 1), 15.16%; high coating (group 2), 17.34%. The dexketoprofen inputs had Prosolv ODT (orally disintegrating tablet) (mg) as a filling material, Emdex (mg) as a flavoring, and MagnaSweet (%) to hide the bitter taste, and a tablet compression force (psi) was applied to finalize the tablets. The dataset contained 27 low-coating formulations and 27 high-coating formulations, resulting in a total of 54 formulations. The dataset had 10 different outputs: friability (%), hardness (N), weight variation (mg), and the dissolution rate (%). Details on the input variables in the tablet formulation preparation steps are shown in Table 1.
2. Statistical Analysis and ML Models used in the Dexketoprofen Dataset
Dexketoprofen pharmaceutical dosage formulation data were analyzed to establish the normality of the data distribution for the relationship between Eudragit coating values and each output. This analysis is important for the correct evaluation of the data. The appropriate test was then performed according to whether the distribution was normal or non-normal. The Student t-test was used when the data had two independent groups with normal distributions [7,8]. Otherwise, the Mann-Whitney U test was used [9]. Moreover, if two Eudragit (15.16% and 17.34%) coating amounts are established to have differences from each other, that finding will provide support to make the right decisions in the next steps.
After the statistical analysis, seven different ML models were applied to the dataset: k-nearest neighbors (k-NN) [10], support vector regression (SVR) [11], classification and regression tree (CART) [12], bootstrap aggregating (bagging) [13], random forest (RF) [14], gradient boosting machine (GBM) [15], and XGBoost [16]. These models have some characteristic hyperparameters [17] to improve their prediction values. Each model was compared step by step for every output and the best model for each output was defined to predict the best formulation inputs.
1) Pre-processing for the dexketoprofen dataset
First, the Eudragit coating amounts were statistically compared in terms of hardness, friability, and disintegration time in SPSS. The normality assumption was checked for each output in group 1 and group 2 using histograms, the Q-Q plot, and the Shapiro-Wilk test (n < 50) in order to determine whether the group had a normal or non-normal data distribution [18].
Based on the normality tests, the Student t-test and Levene test [19] were implemented for hardness values. The Mann-Whitney U test was implemented for friability and disintegration time values.
The coating proportions are important for stomach absorption and for hiding the bitter taste in the mouth. Knowing whether there is a difference between the coatings will support subsequent production steps.
2) ML models for the dexketoprofen dataset
The dataset was imported into the Python program after splitting it into training (85%) and testing (15%) sets. The dataset contained 54 different formulations, 45 of which were used for training and nine of which were used for testing.
Every model had different characteristic parameters to improve its own performance measures. The parameters were defined for seven ML algorithms, as shown in Table 2.
All models were applied individually, using the appropriate hyperparameters. The ML models were trained with data from a limited number of trials and the best ones were chosen. In order to find the optimal values or best formulation values, intermediate input values must be known. Therefore, intermediate values between the values of each input were produced. For example, Prosolv ODT (mg) was produced with values between 150 and 250. Thus, a total of 2,500,000 intermediate input values were produced. Estimates were made across the intermediate values produced by the models with the best output.
3) Evaluation criteria
The performance of models was evaluated by using R
2 (coefficient of determination) and root mean square error (RMSE). The model with the best R
2 and RMSE for each output was selected and saved for final predictions. The obtained results were filtered according to the criteria determined by the Food and Drug Administration (FDA) [20] and the International Council for Harmonisation (ICH) Q6 series [21]. These criteria were friability <1%, disintegration <30 seconds, and a dissolution rate of 100%. The inputs determined after the filtering process were transferred to experts for testing.
III. Results
1. Statistical Analysis of the Dexketoprofen Dataset
1) Hardness values between groups
The tablet coating amount of Eudragit (low vs. high levels) was found to be normally distributed for the hardness output; therefore, the t-test was implemented with the Levene test, which yielded a p-value of 0.435. Since this value was greater than 0.05, the variance was equal between groups. The p-value obtained using the t-test (0.504) was substantially greater than 0.05. Therefore, hardness showed no statistically significant difference between the tablet coating groups at a 5% significance level.
2) Friability values between groups
The amount of Eudragit tablet coating (low vs. high levels) was not found to be normally distributed for friability; therefore, the Mann-Whitney U test was implemented, yielding a p-value (0.640) that substantially exceeded the threshold of 0.05. Thus, friability had no statistically significant difference between tablet coating groups at a 5% significance level.
3) Disintegration time values between groups
The Eudragit coating (low vs. high levels) did not show a normal distribution for disintegration time; therefore, the Mann-Whitney U test was implemented, resulting in a p-value (0.993) that was significantly higher than 0.05. Therefore, disintegration time showed no statistically significant difference between the tablet coating groups at a 5% significance level.
2. Machine Learning Models Based on the Dexketoprofen Dataset
Regarding the results in Table 2, the output variable of hardness had an explanatory power (R
2) of 99% and an RMSE of 2.88. For friability, the modelŌĆÖs explanatory power was 92% (R
2) and the RMSE was 0.02. For disintegration time, the modelŌĆÖs explanatory power (R
2) was 97% and the RMSE was 10.09. The explanatory power for dissolution varied based on the time range; as shown in Table 2, the RMSE values were distributed between 1.89 and 5.92 and the R
2 values ranged from 0.65 to 0.94. All ML model results of the outputs are shown in Table 3 in detail.
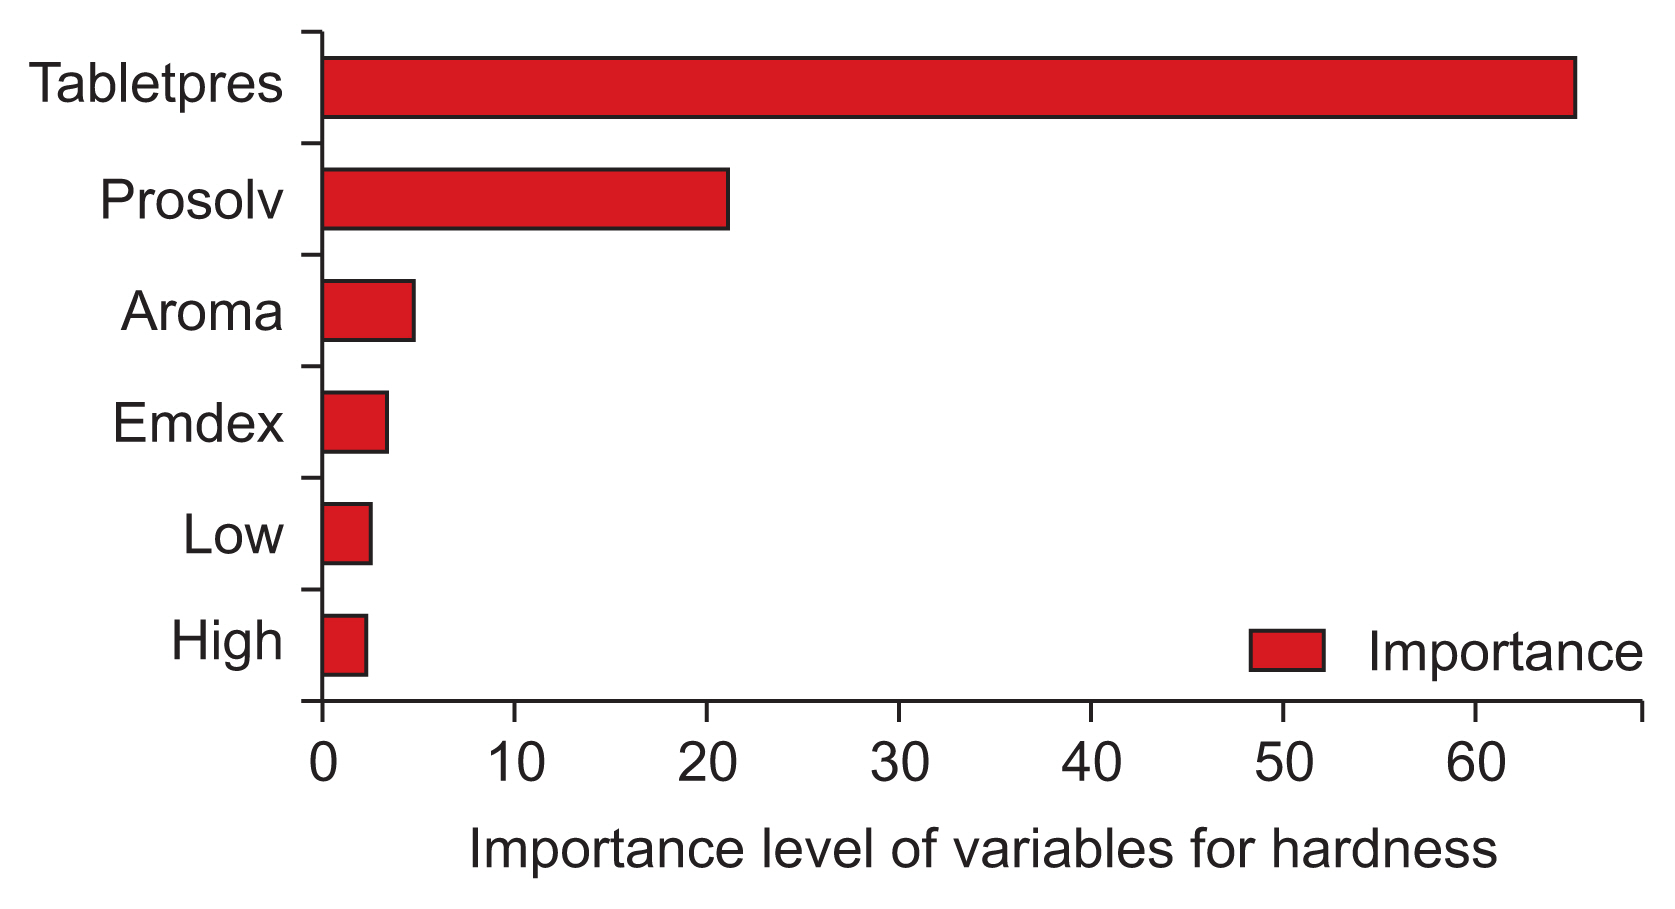
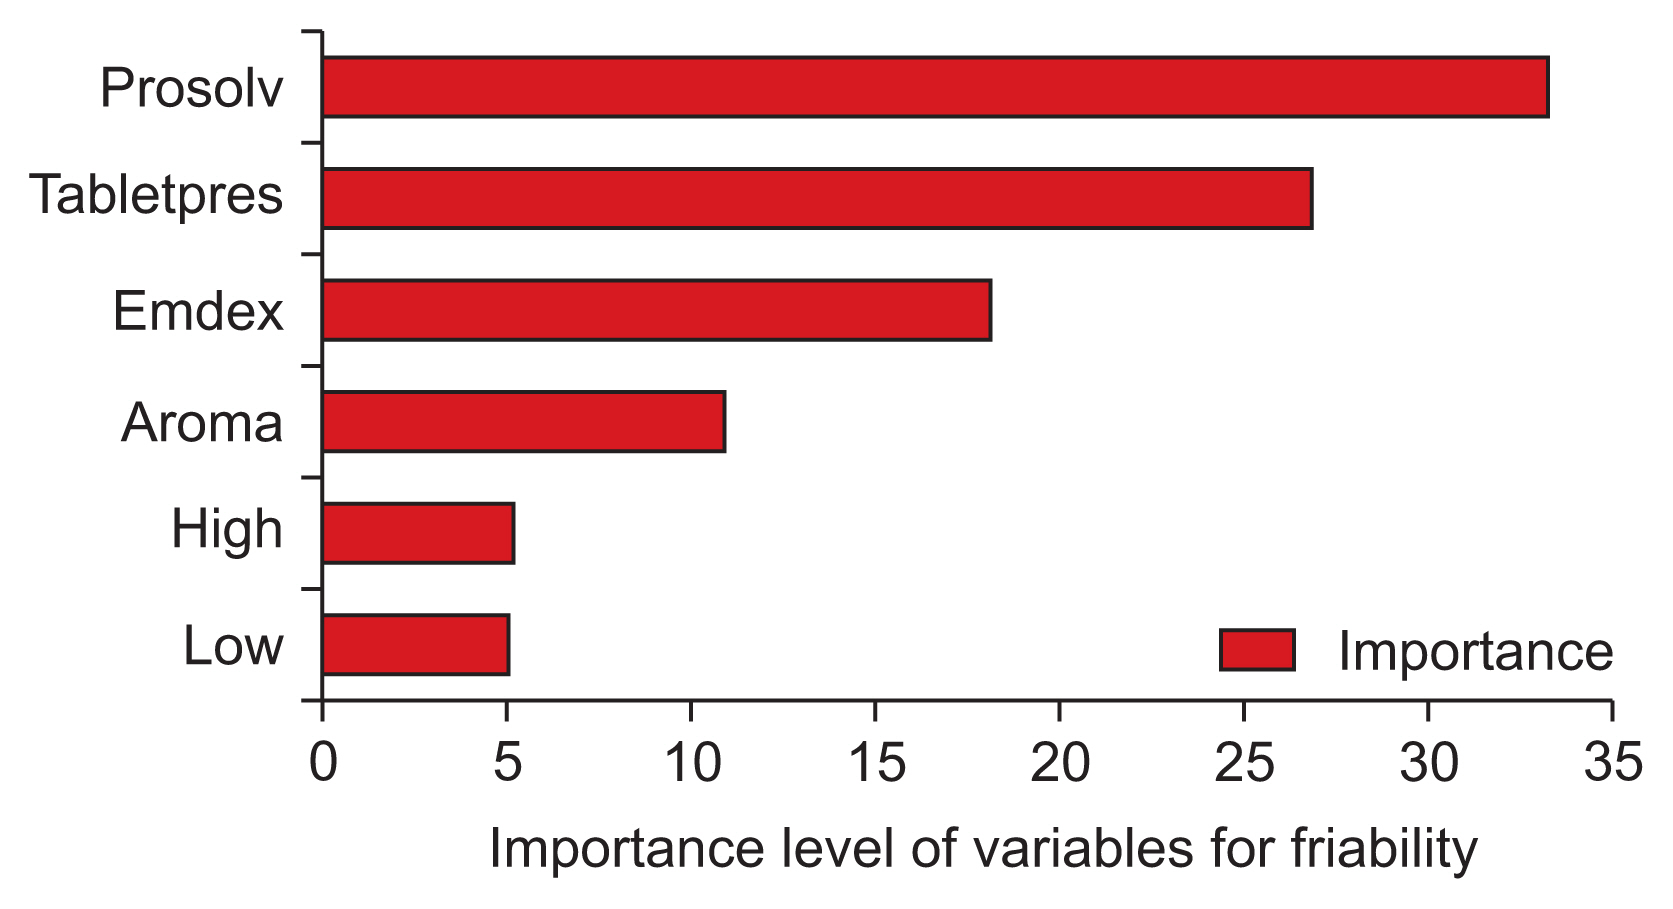
In most cases, the results also had logical interpretations in addition to the numerical values. Although the ultimate target is to determine output predictions, the overall model evaluation is also important. Therefore, the importance of each feature for label prediction is also part of the total analysis. The feature importance of inputs for the dependent variables was calculated using the ŌĆ£feature_importanceŌĆØ property of the sci-learn library by choosing the model with the best predictive success for the dependent variable. The important point here is to find the model with the lowest RMSE and then determine input importance using the related properties. Graphical interpretations in terms of feature importance for hardness, friability, and disintegration time outputs are given in Figures 1ŌĆō3.
The dexketoprofen dataset has limited observation capabilities and time constraints, resulting in reduced iteration opportunities. Given this context, optimal formulation prediction is a challenge. In order to cope with this challenge, global optimal values are targeted. However, a limitation of this study is that it is very difficult to find targeted global optimal values with limited data. The best model was selected and new iterations were repeatedly executed to identify new formulations according to each output. The features given in Table 1 are predicted with the best algorithms for each output using intermediate values to create actual values. For instance, an attempt was made to predict Prosolv ODT values between 150 and 250 mg using trained models that are generated via default ones. This analysis provided a total instance number of 2,500,000 for the best prediction results. The algorithm outputs for friability, hardness, disintegration time, and dissolution rate within the fixed constraints were generated for new active pharmaceutical ingredient formulations [22].
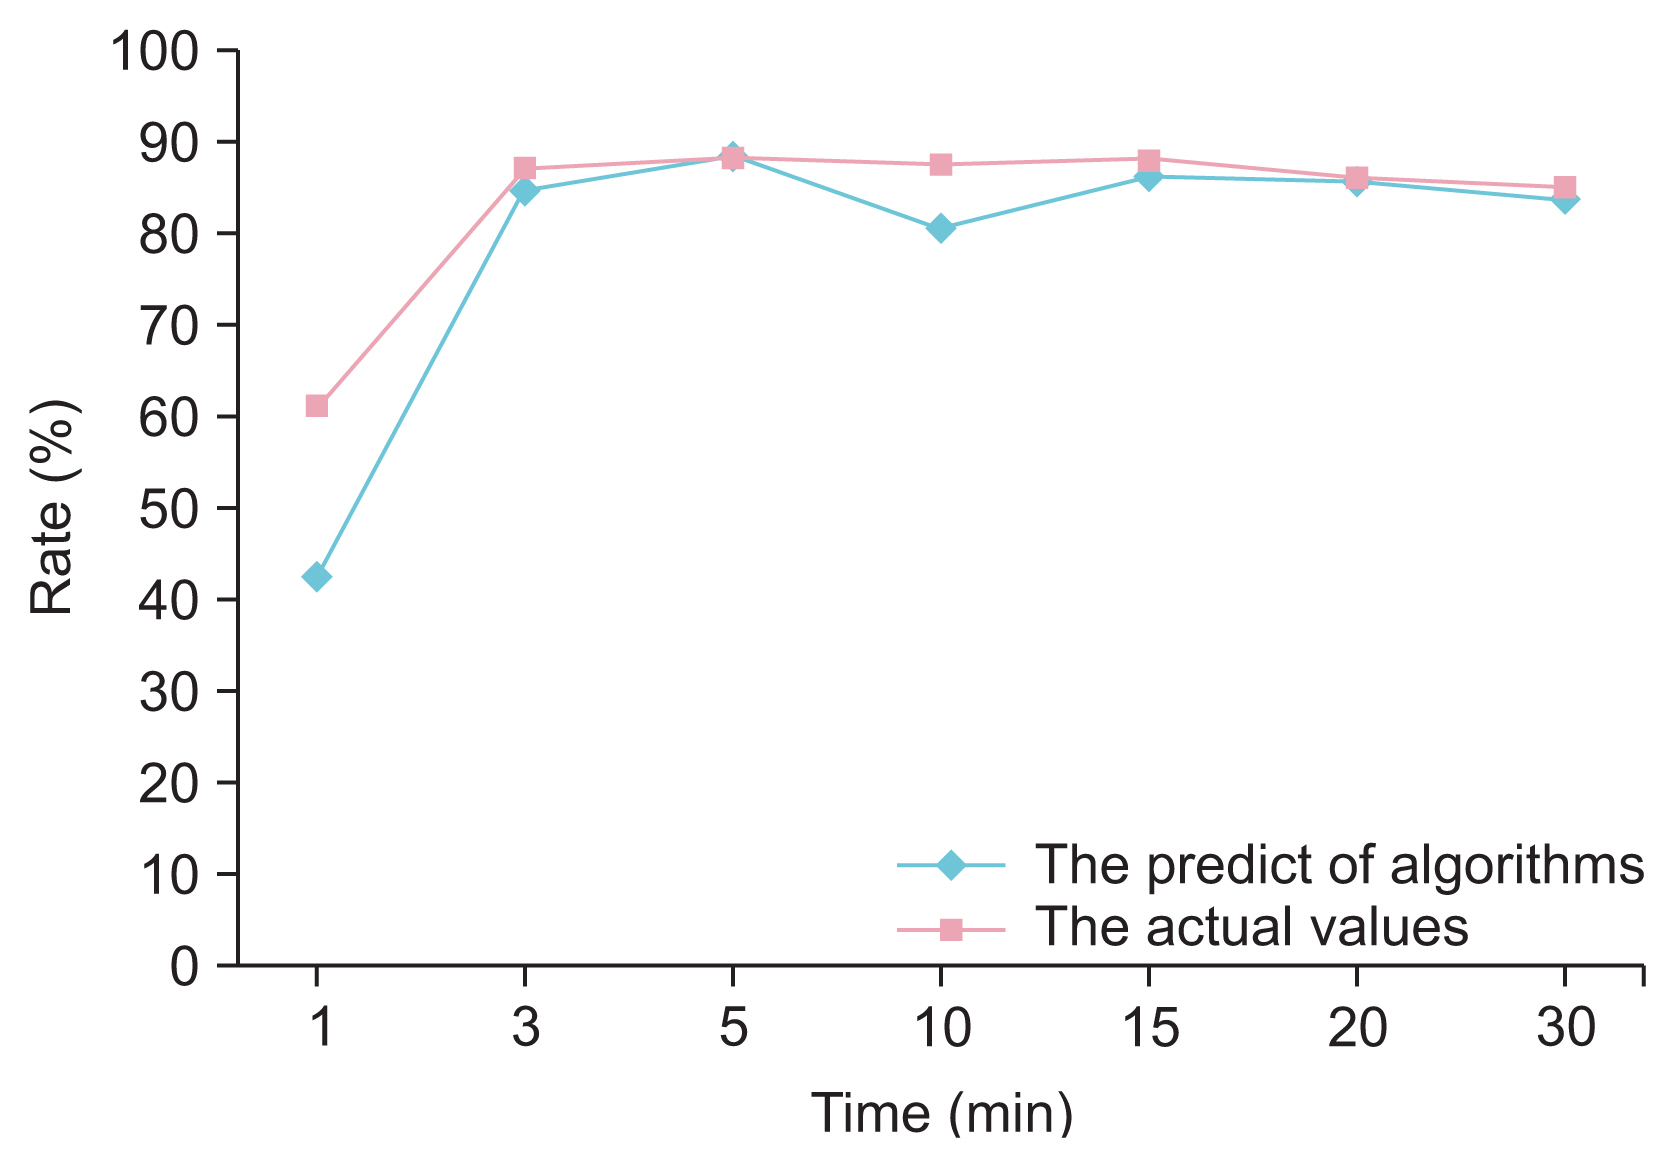
The predicted formulation according to the best algorithms is given in Table 4, as well as friability, hardness, and disintegration values in Table 5. The similarities in dissolution time are given in Table 6 and values are visualized in Figure 4. The actual values and predicted values for dissolution time were compared using the t-test to determine whether there were statistically significant differences between them. The t-test p-value was 0.548, which exceeded 0.05, meaning that there was no significant difference between the actual values and predicted values.
IV. Discussion
ML algorithms have been successfully used to determine optimal values for new medicine formulations in the medical industry, indicating that it is also possible to use algorithms in this sector in parallel to other working fields. Tree-based models have better predictive results in comparison to other models. GBM and XGBoost yielded better predictive results than other tree-based models. Moreover, statistical normalization and the t-test were successfully implemented before-hand in the pre-evaluation period. The proposed approach in this study has eliminated the necessity for many trials, and prevented the use of a limited amount of active ingredients, which would have significant impacts in terms of cost and time. However, a limitation of the study is the difficulty of finding targeted global optimal values with limited data. The other principal difficulty of the study is that the new dataset produced for forecasting was too large. The creation of a new method in this area can provide faster results. This research program can be improved via the development of new models and statistical analysis to use new medicine formulations as per specific requirements for the relevant analysis.