

I. Introduction
Mobile phones are the most ubiquitous type of equipment in the world, 3.3 billion people-half of the earth's inhabitants-have at least one mobile phone. Mobile healthcare applications are becoming a growing trend as more people now own cell phones, smartphones or table PCs [1]. In particular, smartphone applications (apps), available on the Apple or Android app stores, have been developed for patients and physicians [2].
The prevalence of dementia in modern society is showing a steady growing trend. In South Korea, the prevalence of dementia among the elderly population will reach 1.14 million by 2030. Among degenerative brain diseases that cause dementia, Alzheimer disease (AD) is the most common, and the occurrence rate doubles every 5 years [3,4]. As life expectancy increases, the number of AD patients increases. Therefore, early detection of AD patients is becoming more important.
For an accurate classification, it is essential to choose eligible features which clearly represent group differences. Recently, there was a report that a structural change can be observed in human brains a few years before any symptomatic awareness [5]. Therefore, this structural change is important for the detection of AD. Several classification methods based on cortical thickness data have been reported [6,7]. Subcortical structures, such as hippocampi and certain regions of gray matter, are substantially more vulnerable in AD. Some studies have utilized hippocampal volumes or hippocampal shapes for AD classification [8,9]. Therefore, we adopt cortical thickness data and hippocampus shape deformity for AD classification.
Incremental learning-based versions of statistical techniques, such as principal component analysis (PCA) and linear discriminant analysis (LDA), have been reported. Hall et al. [10] proposed an incremental PCA method which updates the PCA transformation matrix sequentially with each of the additional training data. Pang et al. [11] proposed an incremental LDA scheme which can handle large amounts of training data. Cho et al. [12] proposed the incremental learning based on PCA and LDA. They showed that classification accuracy increases incrementally with additional data.
The purpose of this study was to identify AD patients using magnetic resonance imaging in the mobile environment. We performed online classification for AD diagnosis and AD prediction by using the smartphone. Our classification method is based on incremental learning for AD diagnosis and AD prediction using the cortical thickness data and hippocampus shape. We constructed a classifier based on PCA and LDA [13]. Specifically, whenever a new data set is obtained, our classification method will train the classifier incrementally with the newly obtained data set. There are two main stages in our method, the initial learning part and the online learning part. We first performed initial learning. This process trains a group classifier with labeled MR volumes. We performed the mobile classification step in which unlabeled subjects are classified.
II. Methods
1. Data Acquisition and Image Processing
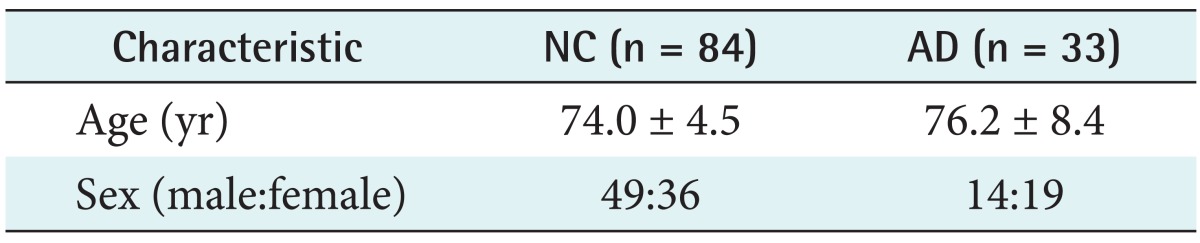
To analyze cortical thickness and hippocampal shape in degenerative human brain diseases, we chose a group of 117 subjects, including 84 healthy controls and 33 AD patients. The subjects underwent high-resolution T1-weighted volume magnetic resonance imaging at the Seoul National University Bundang Hospital, Seongnam, Korea. Table 1 presents the demographic characteristics of the participants.
The T1 images of each subject were processed to extract the cortical surface using the FreeSurfer pipeline [14,15]. This surface modeling pipeline includes several steps: removal of non-brain tissue [16], Talairach alignment, tissue segmentation, intensity normalization [17], tessellation of boundaries between the gray and white matter, automated topology correction [18,19], and surface deformation based on intensity gradients [14]. Once the cortical meshes were reconstructed, they were automatically parcellated into anatomical regions based on lobar and cortical folding structure. In addition to the cortical surface extraction, we constructed the hippocampal surface by employing the in-house software package.
2. Overview
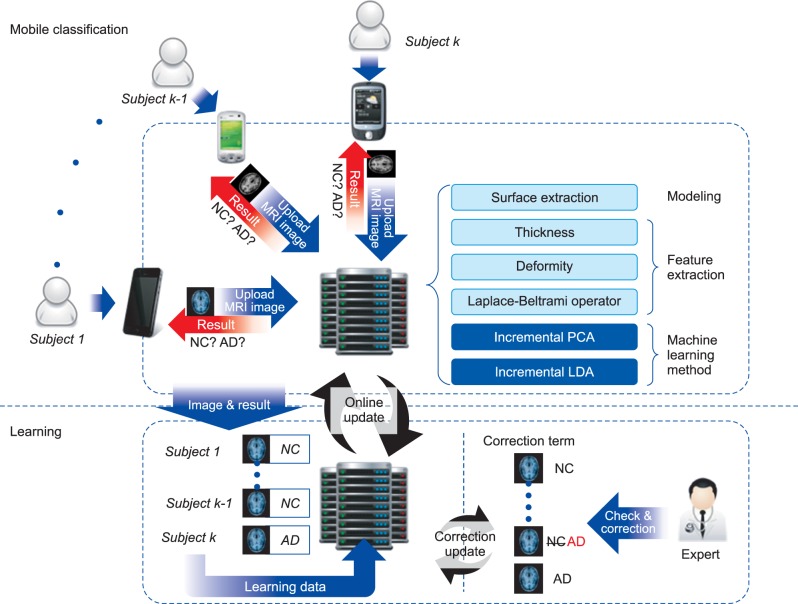
Here, we present an incremental classification method for AD diagnosis and AD prediction using cortical thickness and hippocampal shape analysis data. Figure 1 shows the overall structure of the proposed method. It comprises two parts: initial learning and mobile subject classification. In the first step, the classifier is trained with labeled MR volumes. We extract cortical thickness data and hippocampus from the MR volumes. Then, to remove noise, we filter out high frequency components from the cortical thickness data and hippocampus at vertices, and train the classifier with the resulting data. In the latter part, we classify unlabeled subjects based on the training. We construct its feature vector representing the noise-filtered cortical thickness data and hippocampal shape by using our initial classifier training.
3. Initial Learning
First, we construct a feature vector from an MR volume. To achieve a high classification performance, a feature vector should reflect group differences. It should also be compact to achieve computational efficiency. To construct the feature vector, we extract the cortical thickness data and hippocampal shape deformity, after which, we perform noise removal.
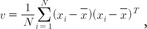
Next, we perform initial learning. We train the classifier with the feature vectors obtained from a set of labeled subjects. Our classification is based on PCA and LDA [20-22]. Given feature vectors, xi, 1 ≤ i ≤ N belong to one V of two groups, normal control and AD, our group classifier is trained by performing PCA and LDA. We derived the following covariance matrix of the training data set X = {xi, ..., xn}: where  is the mean of all feature vectors.
 is the mean of all feature vectors.
Given the PCA transformation matrix, Wp, a feature vector x in the feature space is converted to a vector y in a PCA space spanned by the column vectors of Wp as follows:

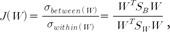
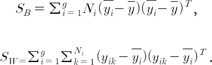
Then, we conduct LDA with the training data set Y. LDA finds the coordinate axes which maximally separate the groups of the data set. LDA maximizes the between-classes variance of Y across the groups and minimizes the within-class variance for each group. LDA finds an axis w that maximizes the following energy function [23]: where σbetween(w) denotes between-classes variance, and σbetween(w) denotes within-class variance. They are projected onto the axis w. The between-classes scatter matrix SB and the within-class scatter matrix SW are defined as

4. Mobile Classification
Once the classifier is trained with the labeled MR volumes in the server, we classify each subject's MR volume by employing the mobile classification method. Note that the mobile classification method is implemented on the smartphone device (see Section II-6 for details).


5. Online Learning
After an unlabeled subject is classified, its result is validated by a clinician. It is time-consuming to train the classifier with the entire training data whenever new training data are added. Therefore, the initial learning method is modified to train a mobile classifier. In other words, the mobile classifier is trained incrementally without using the previously used training data; thus, the time efficiency is dependent only on the size of the new data.
To update Wp, we modify (mean vector) and the covariance matrix V. Then, we acquired the new PCA matrix [24]. The new mean is computed from the old mean as,
(mean vector) and the covariance matrix V. Then, we acquired the new PCA matrix [24]. The new mean is computed from the old mean as,


We refer the other reports for enhanced the computational efficiency for incremental PCA [10,24,25].
To compute the LDA transformation matrix WL, we employ an incremental LDA method [11]. This method incrementally computes the between- and within-class scatter matrices in the feature space and then maps the results onto the PCA subspace to finally compute WL.


6. Mobile Implementation
A platform comprises three main components, namely, a health avatar, broker, and agent. A health avatar is a user client system. The avatar system was implemented on a iPhone 5 (iOS 7.04) with the dual-core 1.3 GHz Swift CPU with 1 GB memory. A broker is a monitoring system which monitors a patient's personal information and communication history. Our mobile classifier processes the patient's data in our server. The classification result is sent to an agent. Finally, the agent processes the patient's acquired ID, gender, age, and brain data from the broker.
III. Results
We first used the cortical thickness data as a feature vector. Then, we used the combination of the cortical thickness data and hippocampal shape deformity as a feature vector. After training the classifiers, we assessed the sensitivity of each classification with the test as follows:

Table 2 shows the results using two different feature vectors. Feature 1 is cortical thickness data and feature 2 is the combination of the cortical thickness data and hippocampal shape. The sensitivity and the specificity were 94.49% and 64.33% for feature 1, and 96.79% and 63.24% for feature 2. The accuracy was 87.33% for feature 1 and 87.52% for feature 2.
We further demonstrated the effectiveness of our incremental classification method. Figure 2 shows the accuracy, sensitivity, and specificity of the classifier using feature 2 (combination of the cortical thickness data and hippocampal shape deformity) as a feature vector. Since the values of feature 1 and feature 2 are very similar, we only show the feature 2 value. As seen in the figure, accuracy, sensitivity, and specificity tended to converge with those of the respective classifier trained with the entire training data as the number of used training patients approached those of the training patients.
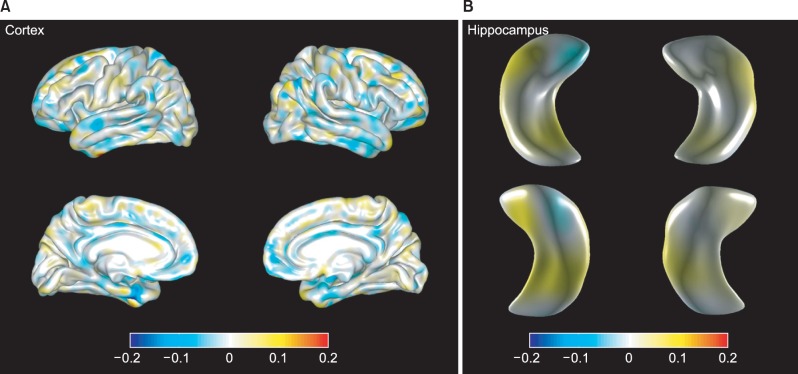
Also, we extracted the cortex and hippocampus regions for our classifiers. Figure 3 depicts the discriminative regions on the atlas surface meshes for our classification.
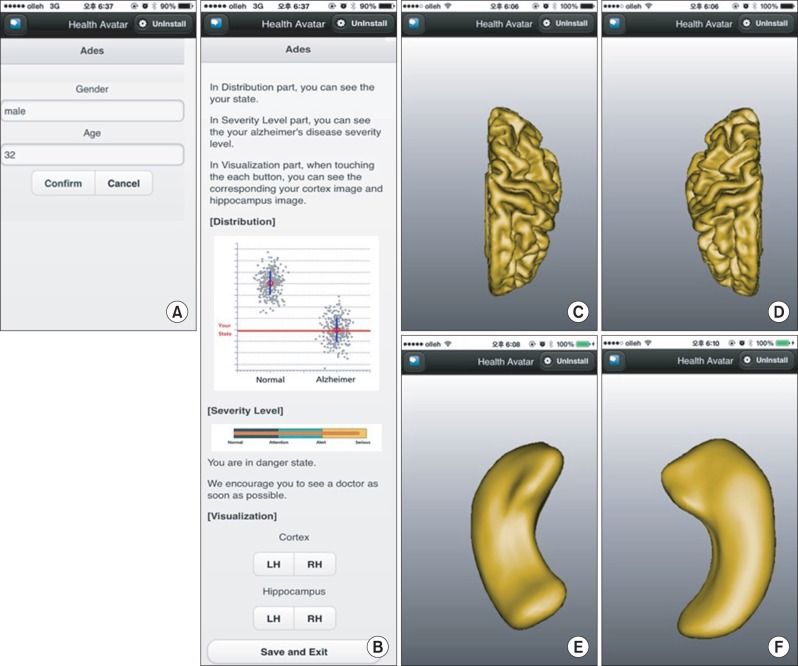
Figure 4 is a snapshot of our agent. Our agent's name is 'Ades', which is composed of 'AD' and 'Descriptor'. When touching the 'START' button on the first screen, the patient's gender and age are shown (Figure 4A). Then, the user touches the 'Confirm' button and waits for 24 hours. When the alarm 'Ades process is over!' appears on the smartphone screen, one can access the feature data (the cortical thickness and hippocampal shape deformity data in our experiments). After mobile classification, the agent system shows online learning classification result, such as patient's distribution, severity chart and visualization (Figure 4B). The visualization part is composed of left and right cortex buttons as well as left and right hippocampus buttons. When each button is touched, one can see the patient's corresponding feature. Figure 4C and D show the left and right cortex feature; Figure 4E and F show the left and right hippocampus feature.
IV. Discussion
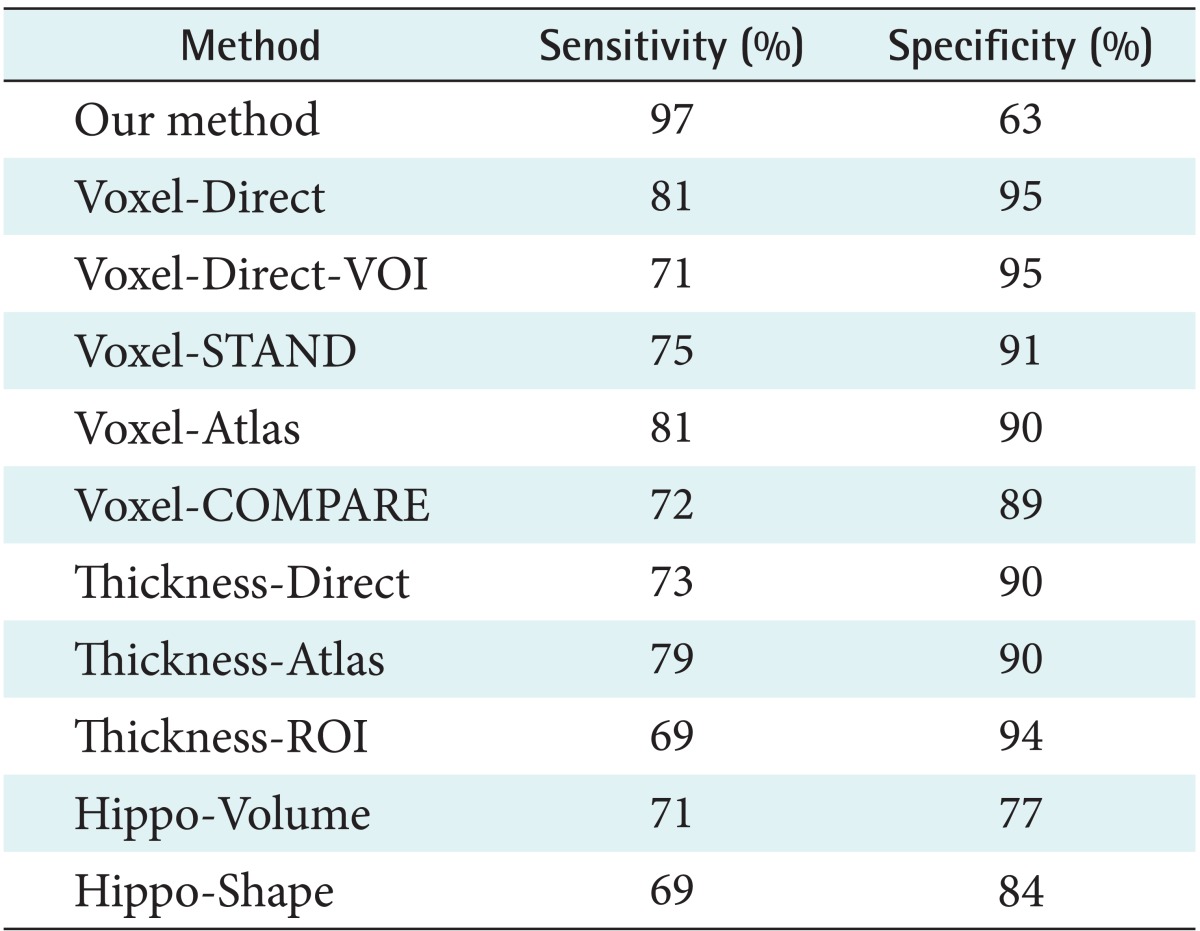
Cuingnet et al. [26] compared ten classification methods: Voxel-Direct, Voxel-Direct_VOI, Voxel-Atlas, Voxel-STAND, Voxel-COMPARE, Thickness-Direct, Thickness-Atlas, Thickness-ROI, Hippo-Volume, and Hippo-Shape. The first five methods employed voxel-based segmented tissue probability maps. The next three methods employed cortical thickness data. Then, the last two methods used hippocampal features [26]. Table 3 summarizes the classification performance results of the ten classification methods together with those of ours. Our method achieved good sensitivity measure in classification. It was ranked in the first position; however, the specificity of our method was lower than other classification methods.