Validation of an Automatic Tagging System for Identifying Respiratory and Hemodynamic Deterioration Events in the Intensive Care Unit
Article information

Abstract
Objectives
Predictive models for critical events in the intensive care unit (ICU) might help providers anticipate patient deterioration. At the heart of predictive model development lies the ability to accurately label significant events, thereby facilitating the use of machine learning and similar strategies. We conducted this study to establish the validity of an automated system for tagging respiratory and hemodynamic deterioration by comparing automatic tags to tagging by expert reviewers.
Methods
This retrospective cohort study included 72,650 unique patient stays collected from Electronic Medical Records of the University of Massachusetts’ eICU. An enriched subgroup of stays was manually tagged by expert reviewers. The tags generated by the reviewers were compared to those generated by an automated system.
Results
The automated system was able to rapidly and efficiently tag the complete database utilizing available clinical data. The overall agreement rate between the automated system and the clinicians for respiratory and hemodynamic deterioration tags was 89.4% and 87.1%, respectively. The automatic system did not add substantial variability beyond that seen among the reviewers.
Conclusions
We demonstrated that a simple rule-based tagging system could provide a rapid and accurate tool for mass tagging of a compound database. These types of tagging systems may replace human reviewers and save considerable resources when trying to create a validated, labeled database used to train artificial intelligence algorithms. The ability to harness the power of artificial intelligence depends on efficient clinical validation of targeted conditions; hence, these systems and the methodology used to validate them are crucial.
I. Introduction
Hospitalized patients, particularly those in high-acuity environments, are at significant risk for clinical deterioration. Acute clinical events occur in a significant proportion of intensive care unit (ICU) patients and are associated with increased morbidity and mortality [1,2].
Outcome prediction scores, such as the Acute Physiology and Chronic Health Evaluation (APACHE), the Simplified Acute Physiology Score (SAPS) and the Mortality Probability Model (MPM), are widely used in ICUs. These static scores are based on “snapshot” values gathered immediately following admission and fail to adapt to the patient’s progression. Hence, they offer little guidance for the identification of clinical deterioration [3,4].
Observational studies suggest that patients often show early signs of deterioration up to 24 hours prior to an episode of significant deterioration that requires emergent management [5]. These physiological changes preceding clinical deterioration are often subtle and hard to detect [6,7].
Rapid advances in predictive modeling coupled with the abundance of data obtained from high-density patient monitoring devices provide exceptional opportunities for the development of innovative predictive models [8–10]. The detection of clinical deterioration by models that draw clinicians’ attention to patients before they deteriorate would enable early interventions and result in improved outcomes compared to emergent rescue procedures taken after the patient has already deteriorated [11,12].
At the base of predictive-model development lies the ability to tag significant events. These tags are crucial for the training of predictive models and for validating their performance. However, the datasets needed for such studies are generally very large and include thousands of data items. Therefore, assigning human experts to manually tag events requires substantial effort. Hence, manual tagging processes may become time-consuming, expensive, and inefficient. One appealing solution is the use of automatic tagging systems to identify events of interest. Naturally, such automatic systems should be validated and compared to a reference standard before being used as the benchmark for model development.
Worsening of a patient’s condition in the ICU and the need for treatment escalation may have significant consequences on the patient’s chances of recovery. As previously reported, significant respiratory deterioration leading to the initiation of mechanical ventilation and hemodynamic deterioration leading to the use of vasopressor or inotropic support are two of the most common and significant life-threatening events in the ICU that may lead to a grim outcome [1,7]. The development of prediction models that foresee these events and allow an early intervention would have significant clinical benefits.
The primary objective of this study was to establish the validity of an automated system for tagging respiratory and hemodynamic deterioration events in a large ICU database by comparing its performance to tagging by expert human reviewers.
II. Methods
This retrospective cohort study utilized data from the Electronic Health Records (EHR) of the University of Massachusetts’ (UMass) eICU, between July 2006 and September 2017.
The UMass eICU provides tele-medical intensivist coverage for seven adult ICUs across two hospitals, including three medical units, two surgical units, a cardiovascular unit, and a neurological unit.
All patients older than 18 years of age with stays longer than 6 hours were included. Patient data underwent deidentification, including time stamp shifting, removal of identifiers, truncation of extreme, and transformation of rare and location values. The data were protected according to ISO, IEC, HIPAA, and FDA standards. The study was approved by the University of Massachusetts Medical School’s Institutional Review Board (No. H00019625).
Overall, the dataset included 72,650 unique stays with an average ICU length of stay (LOS) of 90 hours. The median age was 64 years (interquartile range, 52–76 years), 43% of the patients were female, and the mortality rate was 11.9% (Table 1).

Characteristics of the study population
For the purpose of validating the automated tagging system, 500 stays were randomly sampled. To improve the quality of the tagging-validation cohort and counter class-imbalance, a stratified over-sampling of deterioration events strategy was implemented (Figure 1). This method increases the prevalence of events of interest and improves statistical efficiency, while preserving random selection. The dataset was divided into three sets: patients with presumptive respiratory events, patients with presumptive hemodynamic events and patients with no events. Each set was then randomly sampled to yield 167 stays, stratified by the following characteristics: patient age, sex, specific ICU, and ICU LOS. The three samples were then combined and randomly shuffled. This technique allowed a larger proportion of patients with significant events to be included in the study set. As can be expected, since the validation set was enriched with more severe cases, the LOS and mortality distributions of the validation set differed from that of the full set (Table 1).
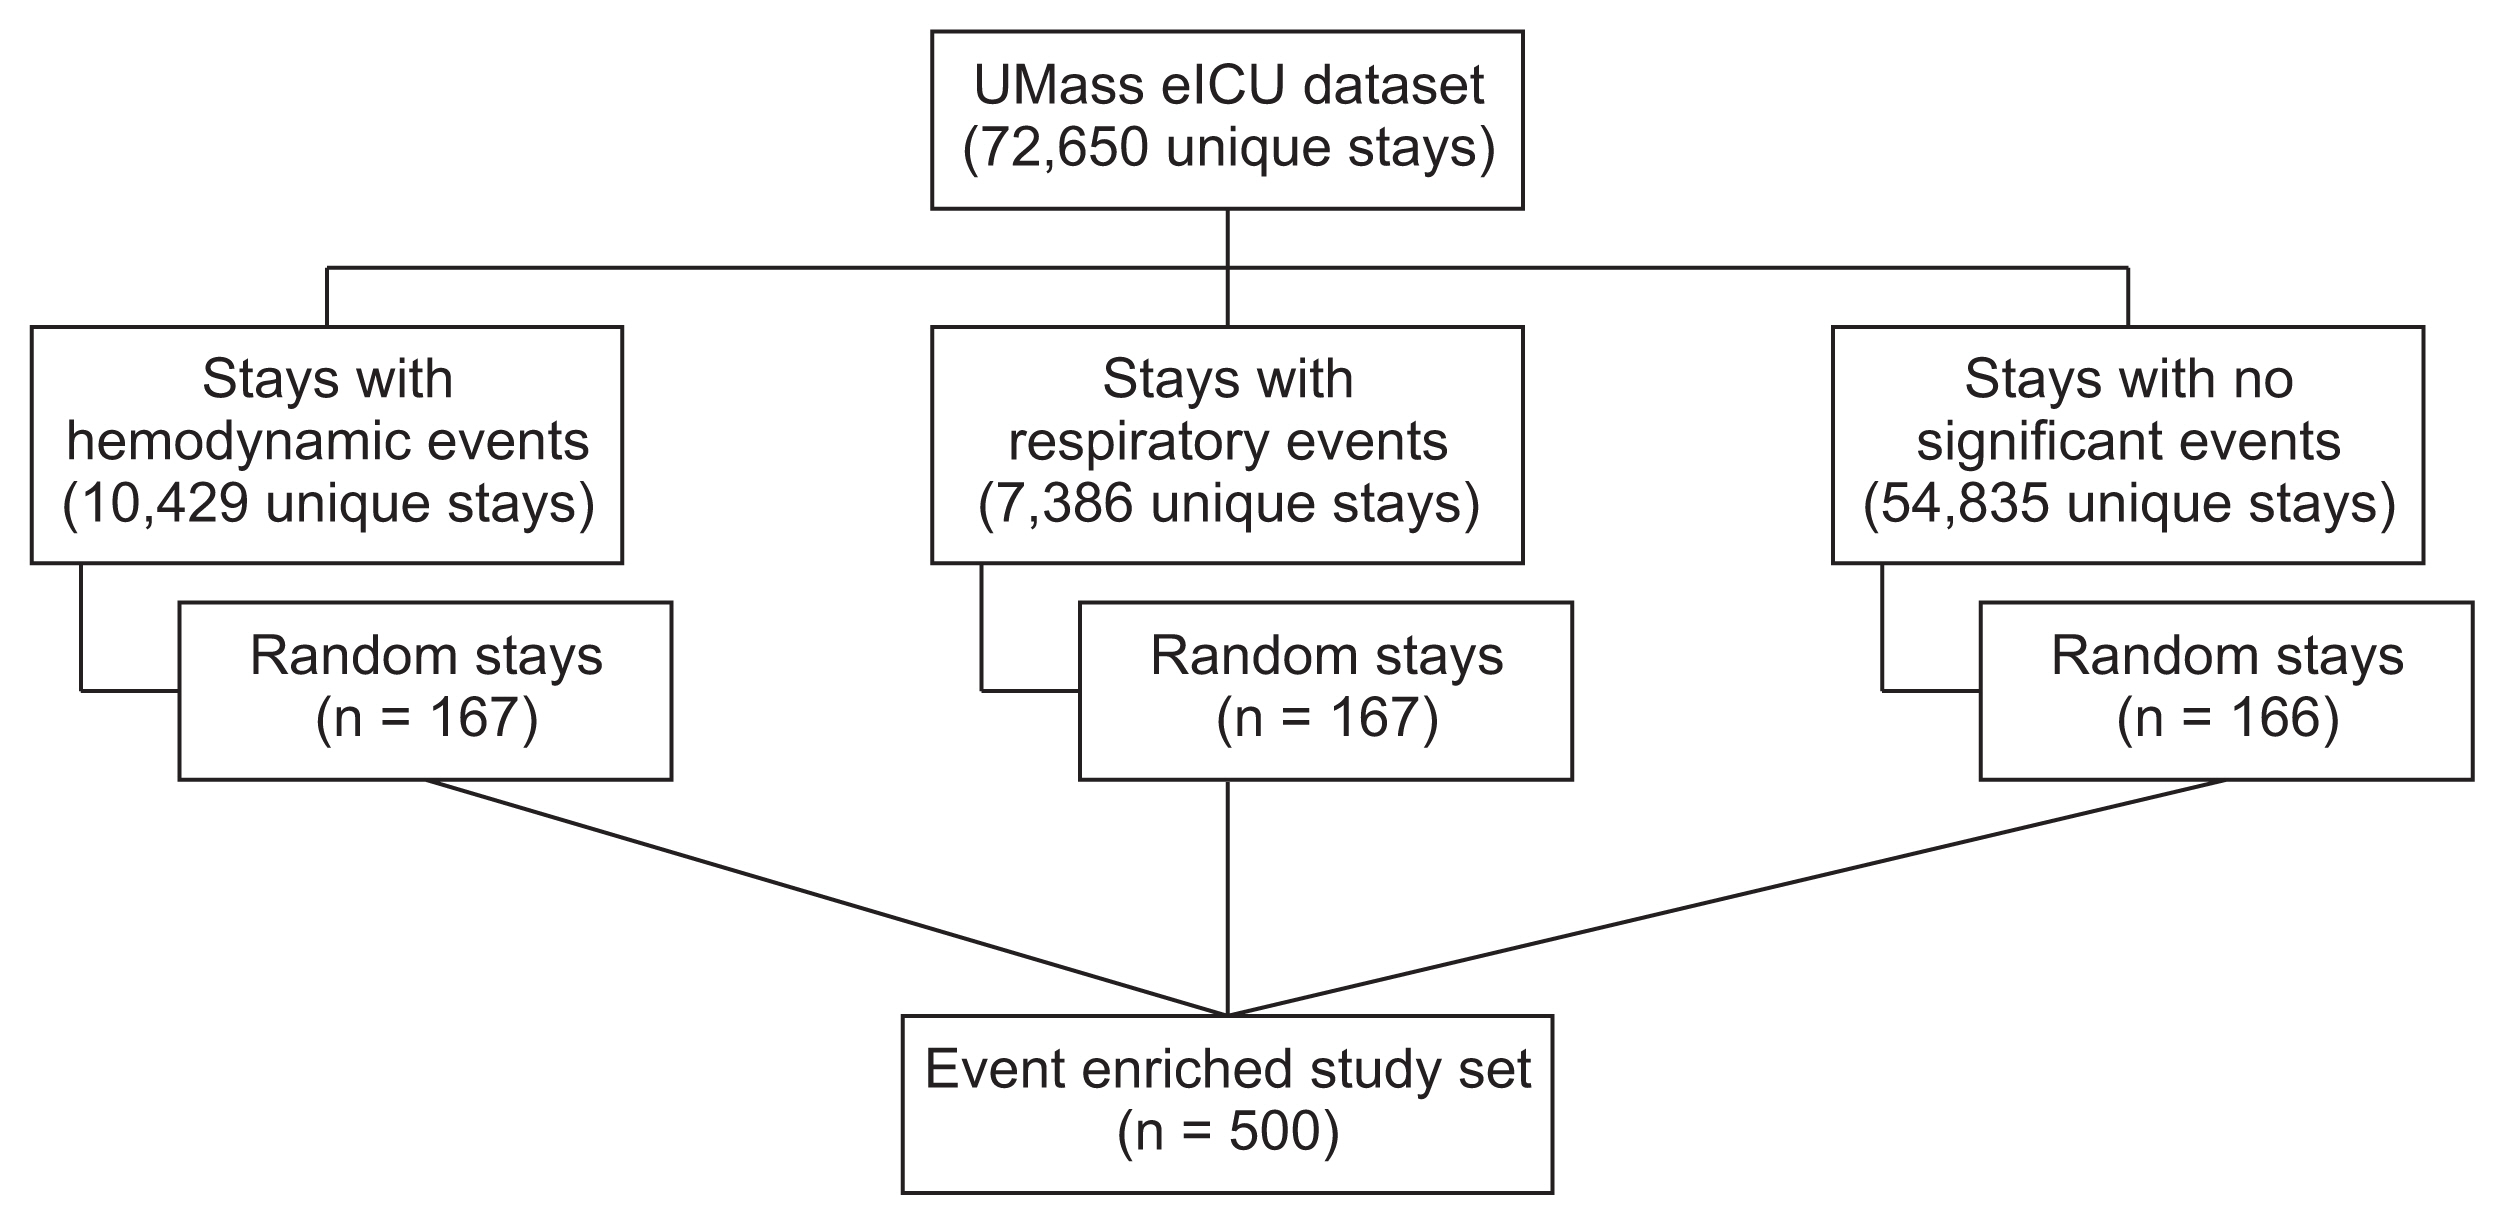
Process of patient selection and stratified over-sampling of critical events. To increase the prevalence of events of interest and improve statistical efficiency, stratified over-sampling of deterioration events was implemented. The dataset was divided into three subsets: patients with presumptive respiratory events, patients with presumptive hemodynamic events, and patients with neither of those events. To avoid duplications, each stay could only belong to one category; hence, stays with both a respiratory and a hemodynamic event were grouped according to the event that occurred earlier during the stay. Each set was then randomly sampled to yield 166–167 stays, stratified for basic demographic and clinical characteristics. In this manner, the 500-stay validation cohort included a higher proportion of patients with significant events than the general patient population, but with similar baseline demographics.
1. Tagging System
The tagging system is a rule-based procedure that uses various parameters to detect two independent clinical events: non-elective intubation as a marker for respiratory deterioration leading to the need for mechanical ventilation, and the initiation of vasopressors or inotropes as markers for hemodynamic deterioration. These events are considered to be among the most significant deterioration events seen in hospitalized critically ill patients [1,7]. The tagging system’s ultimate purpose is to help develop and validate models that predict these life-threatening events. The rule-based feature determined that an intubation event had occurred when there was a direct indication of an intubation event in the EHR, when a combination of ventilation and bedside monitor parameters existed, or when certain combinations of patient care parameters were identified simultaneously (Supplementary Table S1). Hemodynamic deterioration was identified by detecting the initiation of vasopressors or inotropes. A detailed description of the tagging criteria is presented in Supplementary Table S2.
For the purpose of this study, a 6-hour period of sufficiently dense data (including at least 2 measurements per hour of heart rate, oxygen saturation, and respiratory rate) was required to determine whether an event had occurred. The first 6 hours of the ICU stay, therefore, were not included, nor were events that occurred when patients were outside of the ICU.
To avoid mis-tagging, only the first intubation during a stay or an intubation that occurred more than 12 hours following a previous extubation was included. Similarly, a vasopressor initiation event was included if it was the first vasopressor initiation during a stay, or if it was initiated at least 6 hours after discontinuation of the previous vasopressor.
2. Study Procedure
The reference standard for the occurrence events was an independent clinician case-by-case review. A clinical definition for each event was validated by several ICU experts. Five physicians independently reviewed randomly selected stays and tagged specific events based on the above definitions. The reviewers had access to all the original EHR data, including provider notes, monitor data, clinical parameters, and laboratory and imaging study results. The clinicians were blinded to the automated tagging results, as well as to the concurrent opinions of the other reviewers. The reviewers were also asked to record explicitly when no events of interest occurred.
The automatic tagging system was used to generate tags for the study population and assessed separately for its validity. Tags generated by the automatic system that occurred within 60 minutes of the tags assigned by the expert reviewers were considered true positives. All other tags generated by the automatic system were considered false positives. Tags assigned by the expert reviewers that did not have a matching automatic tag within 60 minutes were considered false negatives. Stays with no tags from either the automatic tagging system or the expert reviewers were considered true negatives.
The 60-minute window was chosen to account for the fact that some data elements indicating an event are entered into the EHR after the event has occurred, and hence the timing captured may not always be exact. All calculations were performed at the granularity of a single stay.
3. Statistical Approach and Analysis
Accuracy analysis included overall agreement, sensitivity, and specificity, with 95% confidence intervals (CIs). Overall agreement was the primary outcome of interest.
Inter-rater and intra-rater correlations between observations were evaluated using the kappa coefficient. The specific type of correlation coefficient used in this study was the Cohen kappa, which measures the agreement between two raters who each classify items into mutually exclusive categories. For the inter-rater correlation, the kappa coefficient was calculated between two reviewers’ observations for the same stay. For the intra-rater correlation, the kappa coefficient was calculated between two different observations made by the same reviewer on the same stay.
Inter-rater correlation coefficients were interpreted using customary categories, where 0.41–0.60 was considered moderate agreement, 0.61–0.80 was considered substantial agreement, and 0.81–1.00 was considered near perfect agreement.
The sample size calculated for this study was 500 unique stays, based on a target agreement rate of 90% and assuming that 5% of the stays would be invalid (e.g., insufficient data for review). An additional 10% error margin was added due to uncertainty regarding the accuracy of our automatic tagging procedures that selected cases before false positives could be excluded. In total, 500 stays were assessed by the various reviewers (100 stays per reviewer). To assess inter-rater and intra-rater variability a total of 400 randomly selected stays were cross-validated by multiple reviewers (inter-rater variability). Furthermore, 100 stays were re-assessed by the same reviewer to assess intra-rater variability. Our target point estimate for the kappa agreement coefficient was 0.8.
Data analysis was performed using SAS version 9.4 (SAS Institute, Cary, NC, USA).
III. Results
As detailed above, 500 stays out of the full cohort were used in this study. No significant differences in event types, timing, and number were seen when comparing the automated system to the expert reviewers. In total, 146 and 142 respiratory deterioration events as well as 219 and 183 hemodynamic deterioration events were tagged by the automated tagging system and by the expert reviewers, respectively. Furthermore, 84 (16.8%) and 79 (15.8%) stays included both types of events, while 266 (53.2%) and 234 (46.8%) stays had no events tagged by the experts and the automated system, respectively (Figure 2).
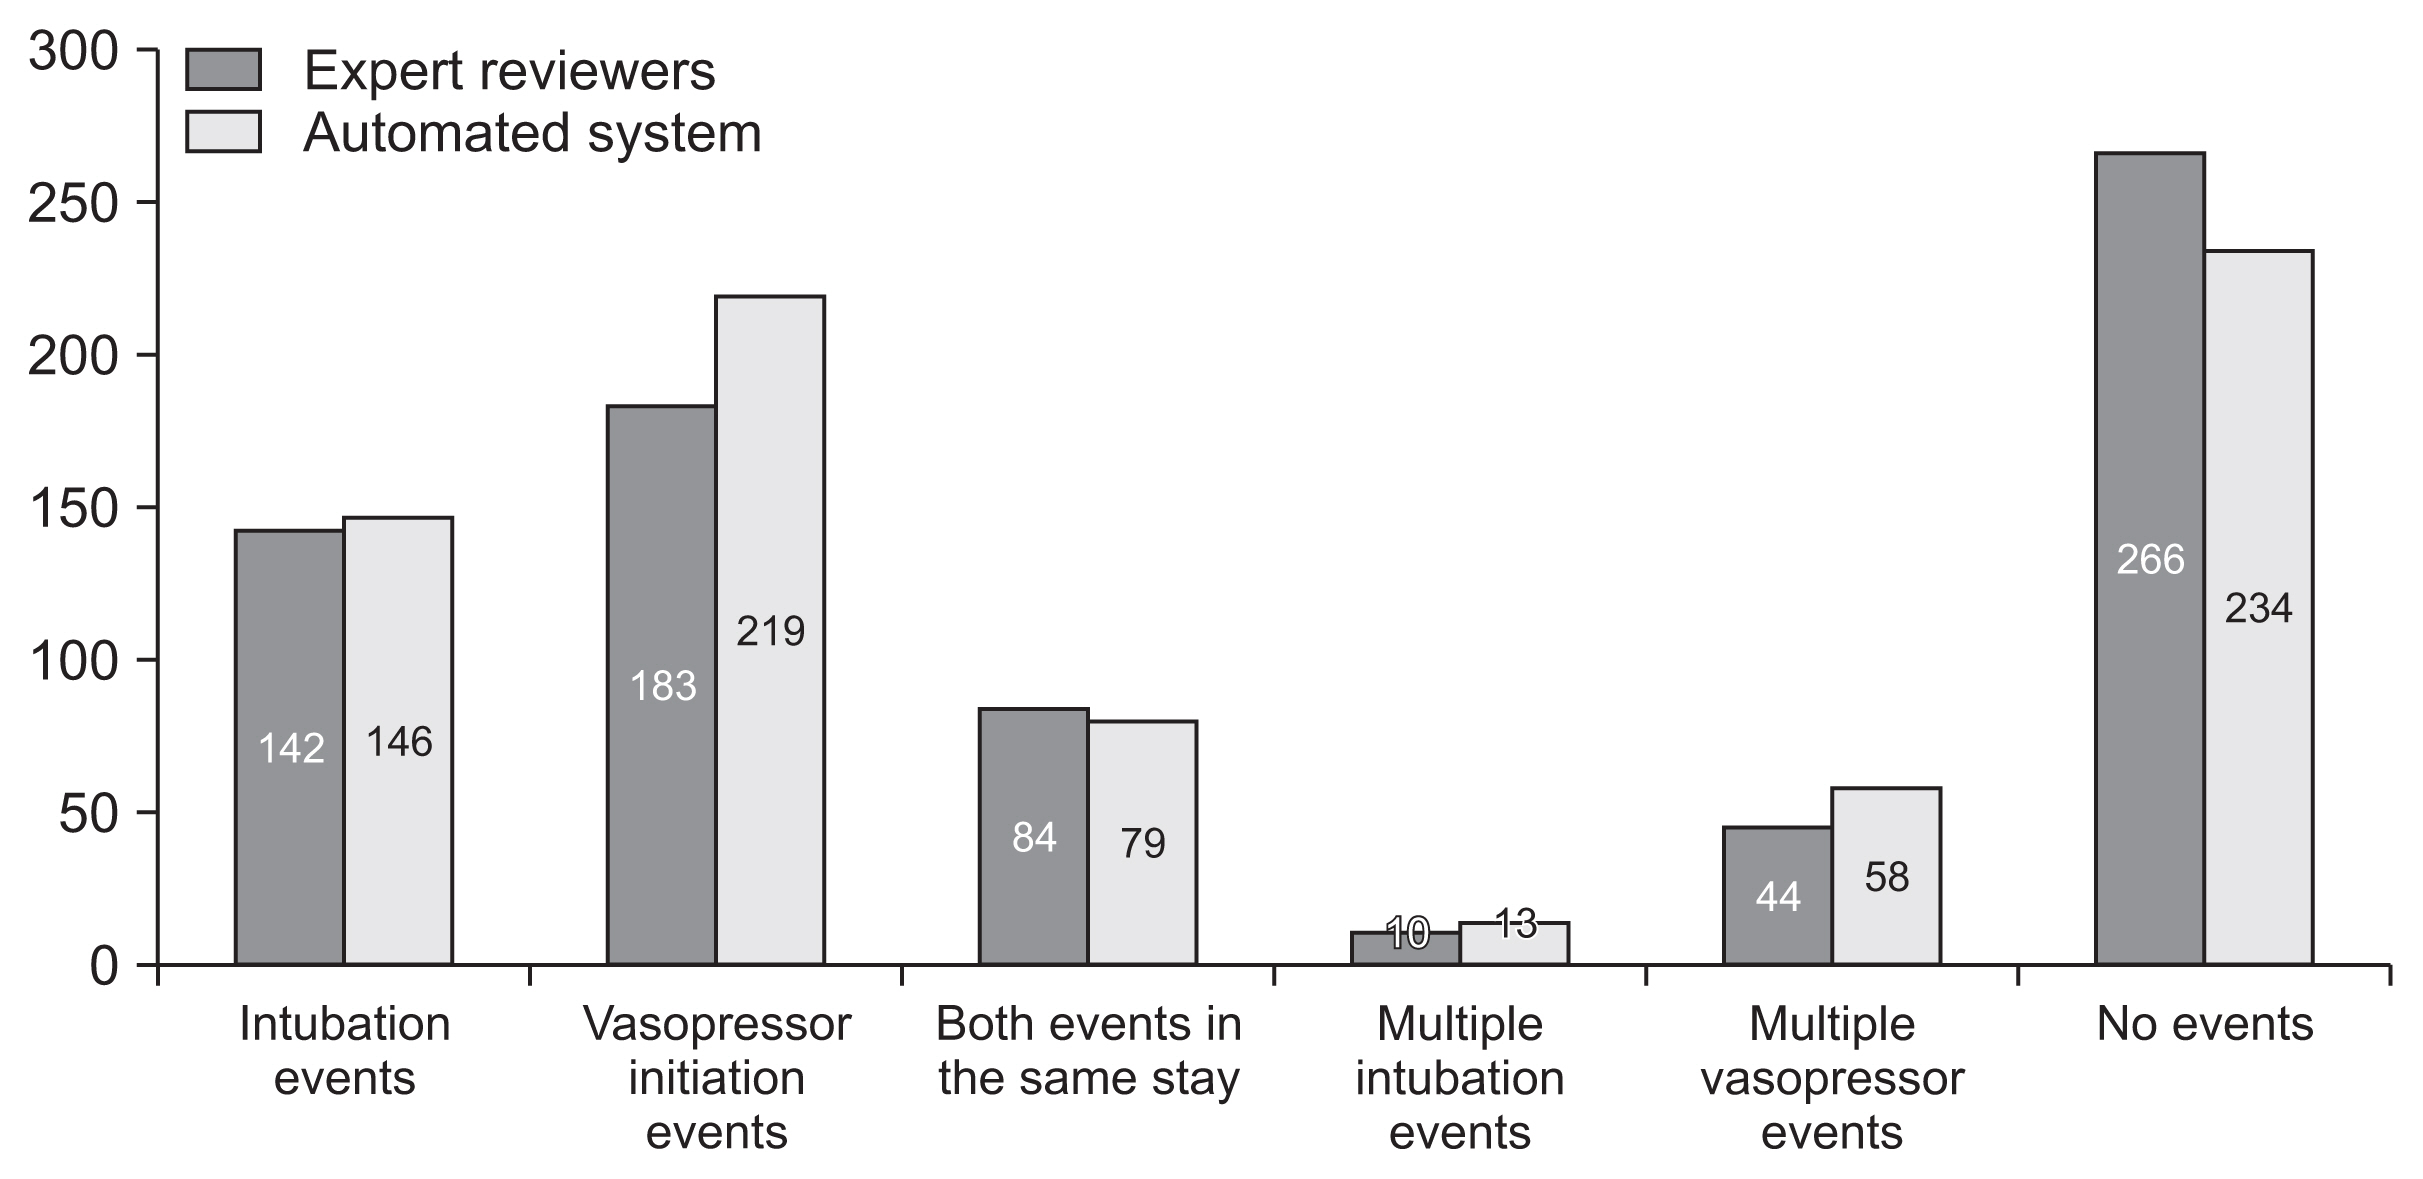
Distribution of events between stays. The distribution of events between stays as tagged by the expert reviewers or by the automatic tagging system. More than one intubation event was defined as occurring if an intubation event occurred at least 12 hours after a previous extubation event during that intensive care unit (ICU) stay. Similarly, a vasopressor initiation event was included if it was the first vasopressor initiation during a particular ICU stay, or if it was initiated at least 6 hours after ending previous vasopressor administration.
The automated respiratory deterioration tag had a sensitivity of 82.4%, a specificity of 92.1%, and an overall agreement rate of 89.4% as compared to the expert reviewers. The automated hemodynamic tag had a sensitivity of 91.3%, a specificity of 84.9%, and an overall agreement rate of 87.1%. Both had high negative predictive values. The analysis results of the automated tags as compared to the expert reviewers are presented in Tables 2–5.

Confusion matrix for the respiratory deterioration tag

Accuracy analysis for the respiratory deterioration tag

Confusion matrix for the hemodynamic deterioration tag

Accuracy analysis for the hemodynamic deterioration tag
Next, the automatic tagging system’s overall agreement was compared with the inter-rater agreement among the expert reviewers to assess whether the tagging system added significant uncertainty.
The inter-rater assessment for respiratory deterioration yielded kappa values ranging between 0.64 and 0.93, while the intra-rater assessment for this tag yielded kappa values of 0.80 and 0.89. For the hemodynamic tag, the inter-rater agreement yielded a kappa value ranging between 0.55 and 0.84, while the intra-rater assessment yielded kappa values of 0.80 and 0.91. These results demonstrate that the five reviewers generally agreed regarding the tagging of specific events and are concurrent with previous studies showing that whenever human reviewers retrospectively review patient records, some variability should be expected [13,14].
The automatic tagging system showed an overall agreement of 89.4% for the respiratory deterioration tag. This value is within the 95% CI of the inter-rater overall agreement, suggesting that the accuracy of the automated tags was not significantly different from that of the reviewers.
For the hemodynamic deterioration tag, the automatic tagging system had an overall agreement of 87.1%, a value that was within the 95% CI of three out of six of the inter-rater overall agreement results, suggesting that the automatic tagging system may add some additional variability beyond that seen among the reviewers. This minimal additional variability is unlikely to have a clinically meaningful impact, and is likely the result of misinterpretation of data gaps.
To further understand these findings, we conducted a post hoc analysis of the stays for which the automatic tags did not agree with the experts. Several reviewer discrepancies were identified. These included two events tagged as respiratory deterioration that were actually the reinstitution of mechanical ventilation in chronically intermittently-ventilated patients; one event that occurred within the first 6 hours of the stay; and one event that was a spontaneous breathing trial.
Hemodynamic tagging errors by the experts often resulted from merging of events and data gaps. Specifically, most of the 52 false positives were due to merging of two separate vasopressor administrations into one continuous administration, often after a gap in EHR data. For instance, a vasopressor was given to a patient, with medication administration data arriving hourly. After a gap of several hours (as long as 12 hours), the data resumed. The accompanying notes did not clearly indicate whether the vasopressor was held during this time. While it is certainly possible that the vasopressor had been continued through this gap, that possibility could not be ascertained, and our tagging system (as well as the experts) were expected to tag the events as a new medication initiation. In some of these cases, the reviewers did not tag these events and hence they were classified as false negatives.
IV. Discussion
Retrospective studies based on experts reviewing large databases play an important role in medical research. These expert reviewers are recognized as the legitimate reference standard. However, human review has many limitations, including the intensive effort and time required, as well as inter-rater and intra-rater variability. An automated system may overcome these limitations and allow massive databases to be screened and tagged rapidly and accurately. Furthermore, as clinical databases become larger and analytic strategies enable massive data exploration, the ability to automatically tag a dataset becomes critical for efficiently developing artificial intelligence-based models. In this study, we describe the process of establishing and validating an automatic tagging system for identifying both respiratory and hemodynamic deterioration.
The clinical literature describes the difficulty in identifying events in large datasets, even by expert reviewers [15]. The goal of an automatic system is not necessarily to perfectly identify the events of interest, but rather to achieve results comparable with those of expert reviewers. These tags are not meant for clinical use, but for model development; hence, their specificity and sensitivity can be adjusted depending on the model that is being developed.
However, in recent years, many studies utilizing machine learning and analytic strategies to assist clinicians and improve the quality of care have been published. In many of these studies the predicted outcome was a defined event that could be easily detected, such as mortality, cardiac arrest, or ICU transfer. In other cases, the predicted end-point was a more complex condition, such as renal failure or sepsis, that required a rule-based algorithm for event tagging [16–21]. In most studies, although the rules for event tagging were specified, no details as to the reliability of the tagging, manual or automatic, were provided.
Our automatic tags did not add substantial variability beyond that seen among the expert reviewers. In our post-hoc analysis, we found that some of the discrepancies between the reviewers and the automatic system were related to human error, or mistakes made by the expert reviewers. Others were related to unique patient groups such as chronically ventilated patients, who are put on and off ventilation and thus pose a challenge to both experts and automatic systems. After accounting for these discrepancies, the agreement would likely be even higher.
An important lesson to be drawn is anticipating data-related issues that may result in unnecessary discrepancies. Examples of this were the need for merging vasopressor administration periods or compensating for gaps in the data due to patients temporarily leaving the ICU. Understandably, when guiding the reviewers, a clear line must be kept between providing directions that help them and giving explicit instructions regarding how and when to tag events of interest. While the latter may improve results, it may also lead to biased tagging and is clearly undesirable. The goal is to align the automatic tagging with the way reviewers understand the data, and not to align the expert reviewers with the automatic system.
Given the above, we believe that our automatic system can be reliably used for tagging events of interest for the purposes of model development. By using this system, thousands of additional stays can be tagged without the formidable investment associated with expert tagging.
This study has some limitations. Our criterion standard—a human review—relies on the quality of data available, data interpretation by the reviewers, and hindsight analysis. Prospective real-time tagging of events might resolve some of these limitations. Furthermore, the slight disagreements between the reviewers also contribute to the imprecision of this method. Ideally, the EHR would contain accurate data to help better identify events of interest. This requires buy-in from all EHR users, as well as appropriate policies that align with future research needs, among the many other goals of EHR. Another limitation relates to the time inaccuracies of data entered into the EHR. Some items are recorded automatically by elements such as monitors and ventilators that continuously feed data in real-time. In contrast, human users document clinical activities sporadically, often retrospectively and with significant delays (e.g., end-of-shift reporting, summary letters, etc.). Therefore, there is a distinct advantage to the automated system, since the reviewer may rely on data that is not always time-specific. We design our rule-based system to use only parameters that are time-specific and available in most settings. Lastly, although this study included stays from seven different ICUs in two different hospitals, our tagging system has not yet been validated on a different population from a separate hospital system.
In conclusion, we demonstrated that a simple rule-based system for tagging critical events could provide an efficient and accurate tool for automated tagging of large, high-density, and complex databases. This type of system may replace human review and save considerable time and resources when trying to create validated, labeled databases that can be used to train machine learning and artificial intelligence algorithms. It is important to underscore the fact that this system in itself is not designed for clinical use. Rather, it is useful for training analytic models. These models, in turn, will still need to be clinically validated. Harnessing the power of artificial intelligence to care for high-acuity patients may lead to better algorithms, earlier detection, improved decision-making, and eventually to better patient outcomes.
Supplementary Materials
Supplementary materials can be found via https://doi.org/10.4258/hir.2021.27.3.241.
Notes
Conflict of interest
No potential conflict of interest relevant to this article was reported.