Development and Comparison of Three Data Models for Predicting Diabetes Mellitus Using Risk Factors in a Nigerian Population
Article information

Abstract
Objectives
This study developed and compared the performance of three widely used predictive models—logistic regression (LR), artificial neural network (ANN), and decision tree (DT)—to predict diabetes mellitus using the socio-demographic, lifestyle, and physical attributes of a population of Nigerians.
Methods
We developed three predictive models using 10 input variables. Data preprocessing steps included the removal of missing values and outliers, min-max normalization, and feature extraction using principal component analysis. Data training and validation were accomplished using 10-fold cross-validation. Accuracy, sensitivity, specificity, positive predictive value (PPV), negative predictive value (NPV), and area under the receiver operating characteristic curve (AUROC) were used as performance evaluation metrics. Analysis and model development were performed in R version 3.6.1.
Results
The mean age of the participants was 50.52 ± 16.14 years. The classification accuracy, sensitivity, specificity, PPV, and NPV for LR were, respectively, 81.31%, 84.32%, 77.24%, 72.75%, and 82.49%. Those for ANN were 98.64%, 98.37%, 99.00%, 98.61%, and 98.83%, and those for DT were 99.05%, 99.76%, 98.08%, 98.77%, and 99.82%, respectively. The best-performing and poorest-performing classifiers were DT and LR, with 99.05% and 81.31% accuracy, respectively. Similarly, the DT algorithm achieved the best AUC value (0.992) compared to ANN (0.976) and LR (0.892).
Conclusions
Our study demonstrated that DT, LR, and ANN models can be used effectively for the prediction of diabetes mellitus in the Nigerian population based on certain risk factors. An overall comparative analysis of the models showed that the DT model performed better than LR and ANN.
I. Introduction
Globally, diabetes mellitus (DM) is one of the most significant contributors to the burden of non-communicable diseases [1]. The number of people with DM has more than tripled over the past three decades, rising from 108 million in 1980 to 463 million in 2019 [2]. Diabetes mellitus is a major cause of morbidities such as blindness, kidney failure, heart attacks, stroke, and lower limb amputation [1,2]. The incidence, prevalence and mortality due to DM is increasing in sub-Saharan Africa. However, the majority of research and control efforts have arisen from outside the region. In Nigeria, the exact prevalence of DM is unknown, although several studies have suggested that the burden of DM is high and rising. The overall pooled prevalence of DM in Nigeria is reported to be 5.7% (95% confidence interval [CI], 4.3%–7.1%) [3]. This amounts to more than 11 million Nigerians living with diabetes, two-thirds of whom are unaware and undiagnosed [3].
Early identification and diagnosis of persons with prediabetes or those at significant risk of developing DM will play a considerable role in reducing the burden of DM, especially in sub-Saharan African countries like Nigeria that are still grappling with infectious diseases [2–4]. With early diagnosis and adequate glycemic control, persons with DM or those at risk can have a marked reduction in DM-related complications and improved quality of life [3]. Thus, the World Health Organization (WHO) recommends the development of simple strategies to identify those at risk of diabetes based on local evidence [5]. The development of easy to use, non-invasive tools to predict DM based on easily identifiable socio-demographic, lifestyle, and physical attributes can heighten awareness among Nigerians, helping to avoid painful and often costly invasive procedures and encourage task shifting (at the primary health care level) for the prevention of DM in resource-limited countries like Nigeria [6].
Statistical models can provide important information for the development of simple, low-cost, point-of-care, community-based, non-invasive technologies to identify patients at risk of DM, particularly in resource-poor settings [7]. Contemporary biomedical predictive modeling techniques utilize machine learning and regression analysis methodologies to predict disease outcomes [7,8]. Multiple predictive methods can be used to model the prediction of a disease condition. Thus, predictive models have the potential to improve the early identification, diagnosis and treatment of persons with DM. The majority of the current predictive models for DM were developed and implemented for non-African populations [7–9]. It is unclear whether previously developed models can play a meaningful role in preventing DM for a Nigerian populace since the accuracy and effectiveness of a predictive model is peculiar to its population of origin. The purpose of this study was to compare three widely used models—logistic regression (LR), artificial neural network (ANN), and decision tree models (DT)—to predict the presence of existing DM based on common easily identifiable and noninvasive risk factors among a sample of Nigerians.
II. Methods
This comparative cross-sectional study was conducted among 733 participants aged 18 and older. This included 307 volunteers confirmed by endocrinologists to have type 2 DM who visited an endocrinology clinic; and 426 non-DM participants who were screened at recruitment and had normal fasting plasma glucose (FPG, <100 mg/dL). Participants who were on gluconeogenic drugs, had chronic kidney disease, or were pregnant were excluded. Participants were recruited from the endocrinology and general outpatient clinics of a large tertiary hospital in Lagos State, Nigeria between September 1, 2019 and December 31, 2019. A minimum sample size of 560 was calculated using the sample size formula for a diagnostic test [10], assuming a sensitivity of 80%, power of 80%, a margin of error of 5%, and an attrition rate of 10%. To avoid overfitting of the models, we performed 10-fold cross-validation.
1. Data Collection
A modified pre-tested version of the WHO STEPS survey tool [11] was administered by trained research assistants to capture the common risk factors for DM. Demographic characteristics that were elicited included age, sex, and ethnicity. A family history of DM was defined as any family member previously diagnosed as having DM or prediabetes by a physician. Anthropometric measurements were obtained with participants standing up, wearing light clothes and no shoes. Weight was measured to the nearest 0.1 kg using a weighing scale. Waist circumference was measured in centimeters using a non-stretch tape. Body mass index (BMI) was then calculated from the weight and height of the participants. Blood pressure was measured using a digital blood pressure machine (Omron, Kyoto, Japan). FPG (mg/ dL) was measured using Accu-Chek glucometers (Roche, Basel, Switzerland). Participants’ subjective impressions were used to assess self-rated oral health on a 5-point Likert scale. Physical activity (participation in vigorous activity for 15 minutes or more per day) was evaluated by self-reporting, and fish consumption was measured by asking participants how often they consumed fish in a typical week.
2. Statistical Analyses and Model Development
All analyses and model development were performed in R statistical software version 3.6.1 (https://cran.r-project.org/bin/windows/base/old/3.6.1/). Descriptive statistical analyses were performed for all variables. Categorical variables were presented as frequency and percentages, while continuous variables were presented as mean ± standard deviation or median and interquartile range. Continuous variables were further categorised into clinically relevant groups. Multicollinearity was assessed using Faraway package in R software. All variables selected had a correlation coefficient <0.70. The Pearson chi-square test was used to determine whether there were statistically significant differences between categorical variables in both groups of participants at α = 0.05. Thereafter, three data classification models were developed, using LR, ANNs, and DT, respectively, for the classification and discrimination of participants into DM and non-DM groups.
3. Preprocessing
Several steps were used in data preprocessing. Missing data and outliers were removed. The data were normalized using min-max normalization, which is computed as:
Feature extraction was performed using principal component analysis (PCA) in order to reduce the dimensions of the initial dataset [12].
4. Binary Logistic Regression Modeling
Binomial logistic regression is a statistical model that is used to model a binary dependent variable from a set of predictors. The chance, p of classifying a participant as having DM (p = 1) or not (p = 0) based on individual characteristics is modeled by Equation (2):
where p specifies the probability of DM, and βi are the regression coefficients associated with the reference group, and xi are the explanatory variables. The univariable binary logistic regression modelling was conducted between each explanatory variable and the outcome status (DM/non-DM). Some variables with a p-value <0.2 were included in the multivariable model while other variables such as ethnicity and sex were selected a priori based on the literature and the experience of the research team. Coefficients and adjusted odds ratios (with 95% CIs) were calculated for each explanatory variable.
5. Artificial Neural Network
The ANN model with principal component step (pcaNNET) was implemented in R based on supervised learning, a technique that ensures that input data (xi……. xn) are trained with target data in order to give an output (yi) [13,14].
Trainable weights wij were continuously assigned to the corresponding input features and the gradient of the loss function with respect to each weight,
After 10 trials, we used a 10-10-1 architecture comprising 10 neurons in the input layer, 10 neurons in the hidden layer, and a single neuron in the output node, with their corresponding weights and bias values as shown in Figure 1.
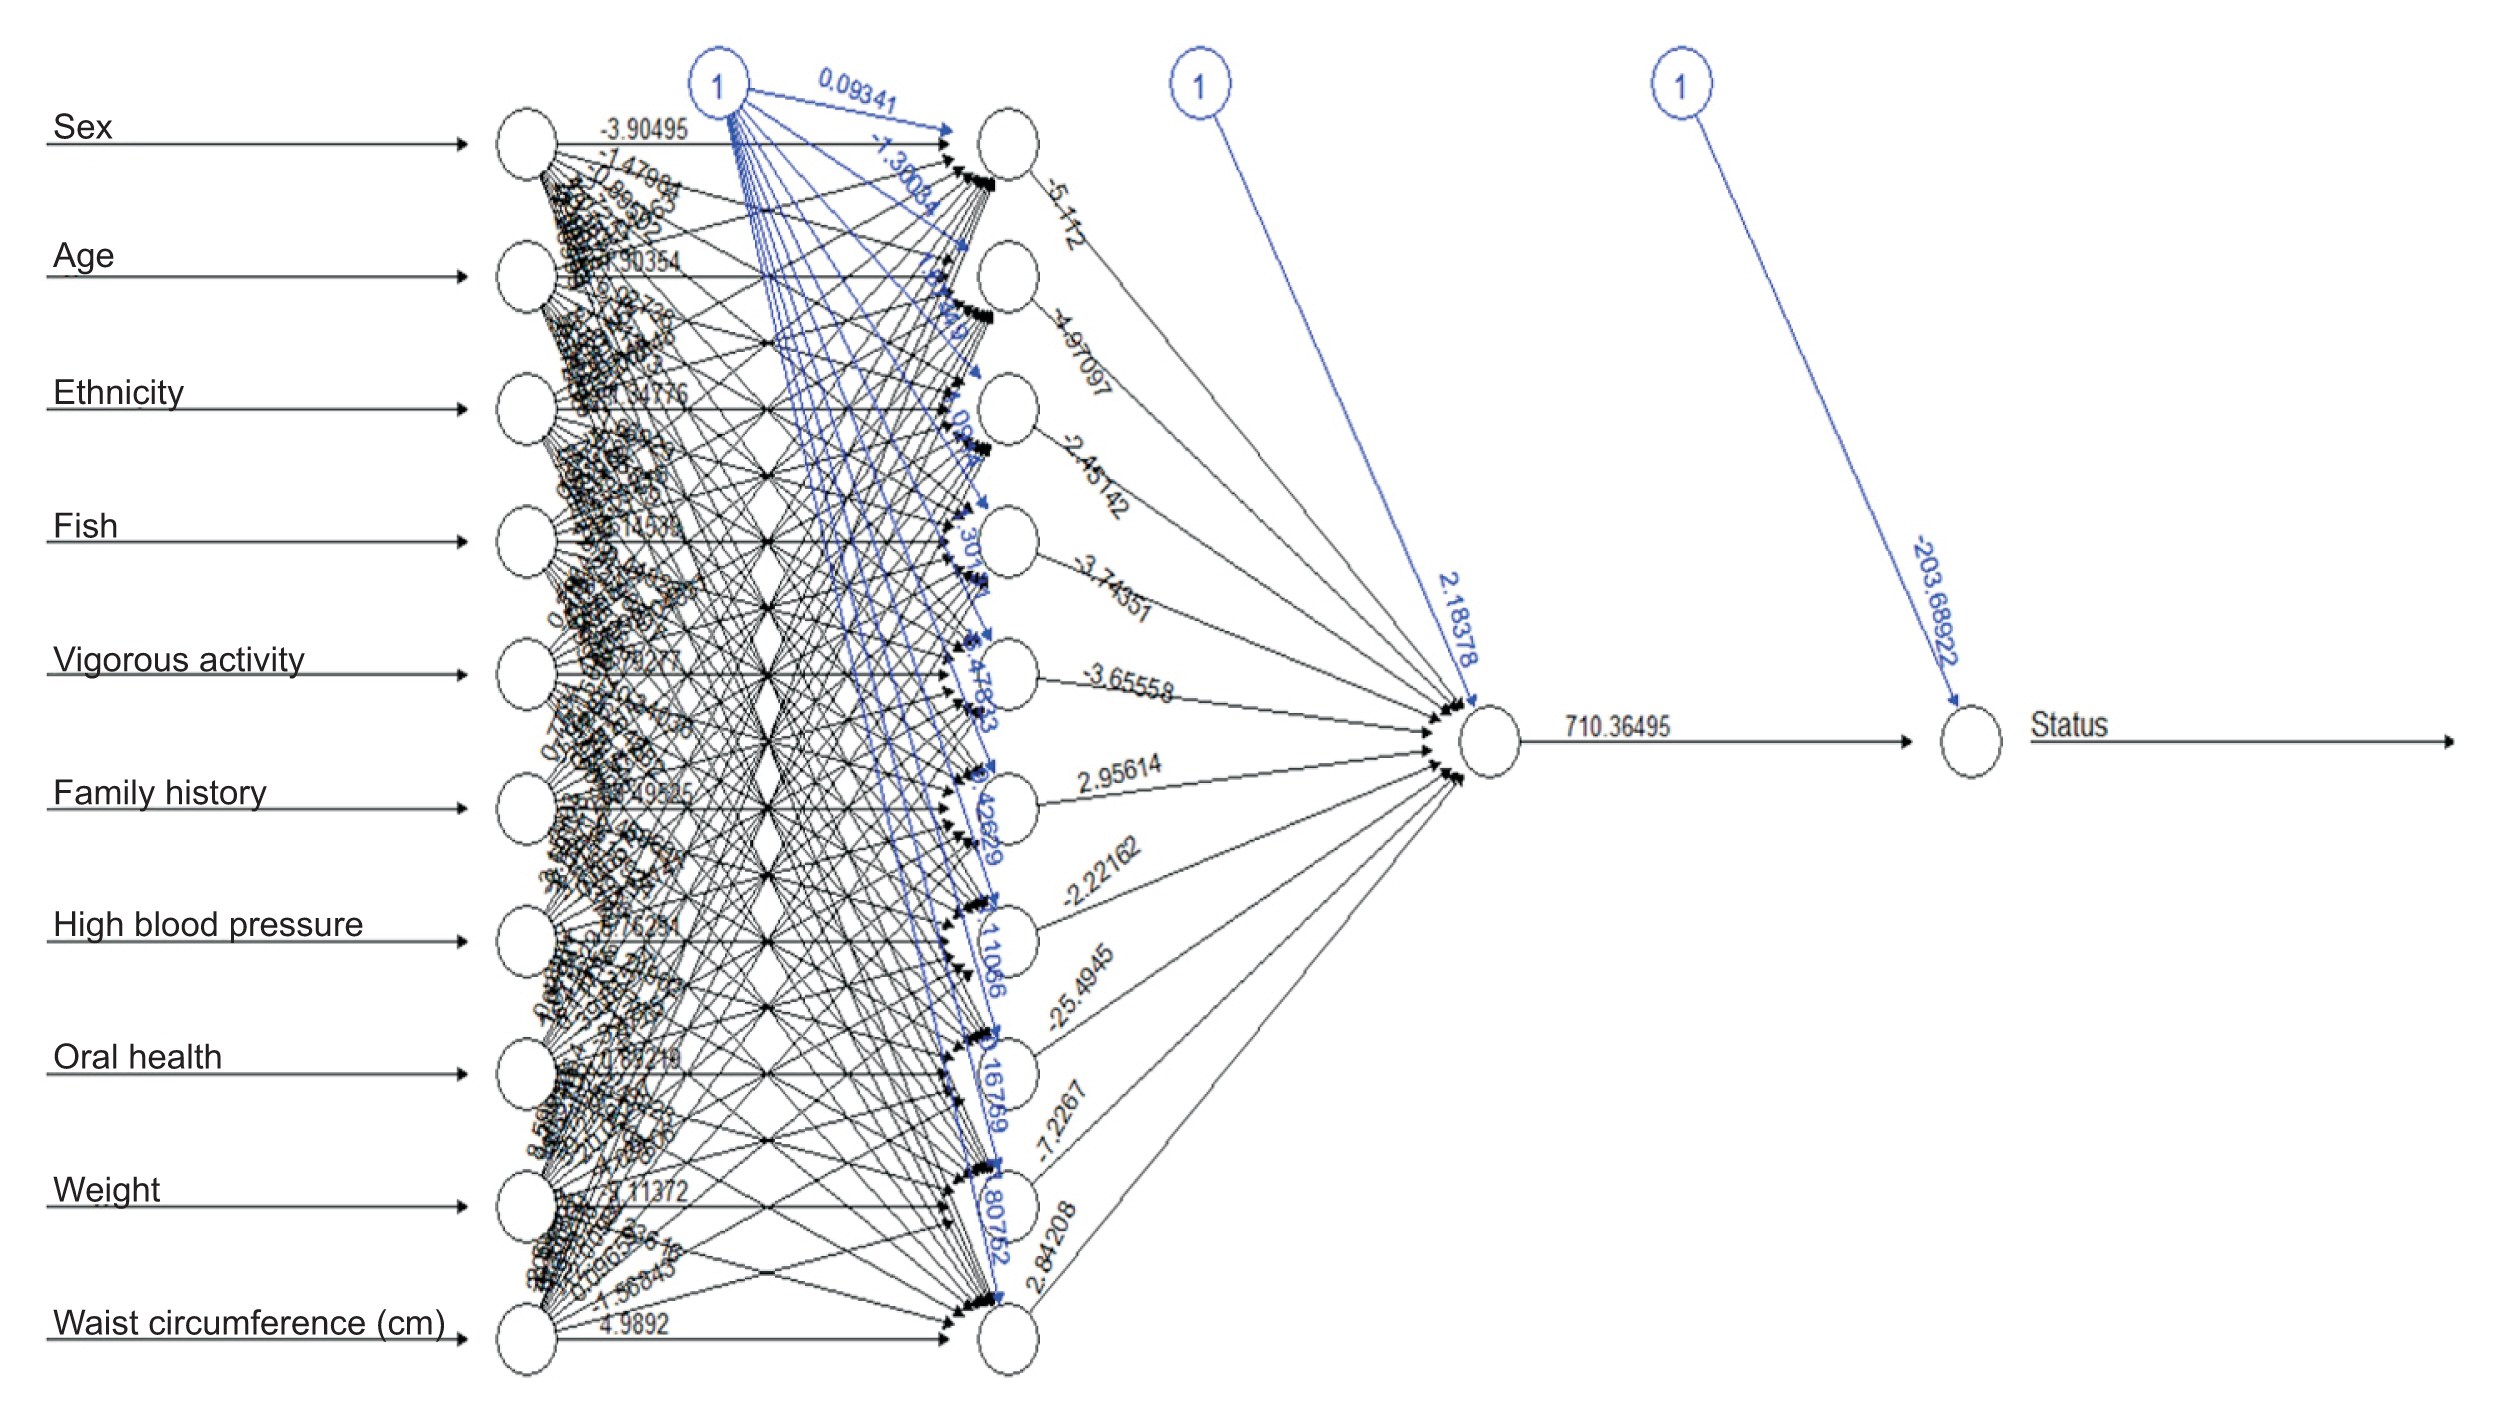
Artificial neural network architecture.
The model was implemented with a logistic sigmoid activation function given by:
where x represents the inputs and f(x) is the activation function.
6. Decision Tree Classification Algorithm
A DT model is a supervised learning data classification algorithm that uses a tree structure to predict the target class by a decision rule [16]. Classification by DTs is usually implemented through a set of hierarchical decisions on the features [17].
7. Algorithm Steps for the Implementation of Models
The general algorithm steps for the implementation of the three models are summarized as follows:
Step 1: Load appropriate libraries
Step 2: Import the dataset
Step 3: Do random sampling
Step 4: Normalize the data using min-max normalization
Step 5: Fit the models
Step 6: Perform 10-fold cross-validation
Step 7: Predict outcomes using the models
Step 8: Evaluate the models’ performance
The three models were implemented using a general approach. All the variables were coded. The datasets were saved as a comma-separated values (CSV) file and imported into R. Data preprocessing was then performed using the min-max normalization method. Thereafter, data training and validation were accomplished using 10-fold cross-validation. The dataset was randomly partitioned into 10 folds. One-fold was taken as the testing dataset, while the remaining 9 folds were used as the training set. The process was repeated until each fold was used as testing dataset. The area under the receiver operating characteristic curve (AUROC), accuracy, sensitivity, and specificity, and negative and positive predictive values of each model were obtained. The AUROCs of the models were compared using the DeLong test.
The classification algorithm was computed as the fraction of DM cases correctly classified, with specific metrics defined as follows [18]:
Sensitivity refers to the ability of a model to correctly identify positive DM cases:
Specificity refers to the ability of a model to correctly identify negative DM cases:
The prevalence is calculated as:
The probability that a participant with a positive value truly has DM is referred to as the positive predictive value (PPV):
Conversely, the negative predictive value (NPV) refers to the probability that a participant with a negative value truly does not have DM:
III. Results
Of the 733 participants, 426 (58.11%) were confirmed not to have DM, while 307 (41.88%) had DM. Therefore, the prevalence value was computed from Equation (9) as 0.4188. The mean age was 50.52 ± 16.14 years. Table 1 shows statistically significant differences in the input variables between the DM and non-DM participants. The relative importance of variables for each model is shown in Table 2. The most significant predictor of DM in all three models was age. The PCA results are shown in Supplementary Table S1, revealing the various principal components (PCs) and their corresponding standard deviation, proportion of variance, and cumulative proportion, with the first PC giving the highest values. In the LR model, the most significant predictor of DM was age. For every yearly increase in age, the odds of DM increased by 9% (adjusted odds ratio [AOR] = 1.09; 95% CI, 1.06–1.12; p < 0.001). Furthermore, participants with a family history of diabetes had 3.6-fold higher odds of DM than participants with no family history of DM (AOR = 3.56; 95% CI, 1.91–6.79; p < 0.001). Participants with high blood pressure and poor oral health also had higher chances of having DM. Sex, ethnicity, fish consumption, and vigorous activity were not statistically significant predictors of DM (p > 0.05) (Table 3). The equation for the LR model is shown in Supplementary Table S2.

Comparison of characteristics among the participants with and without diabetes mellitus (DM)
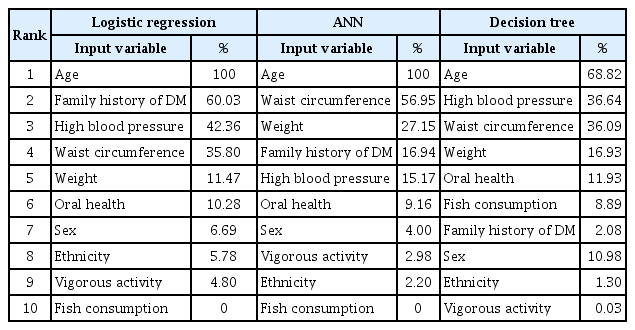
Importance of input variables in the predictive models of diabetes mellitus (DM)

Logistic regression model
Table 4 shows the comparative results of the classification models. The DT model performed best, with an accuracy of 99.05%, sensitivity of 99.76% specificity of 98.08%, PPV of 98.77%, and NPV of 99.82%. In contrast, LR had the poorest performance, with an accuracy of 81.31%, sensitivity of 84.32%, specificity of 77.24%, PPV of 72.75%, and NPV of 82.49%.

Comparison of the performance of the predictive models of diabetes mellitus
Table 4 also shows the cross-validation results of all three models. The optimal model was chosen as the DT model with the least root mean square error (RMSE) value (Figures 2, 3). The final values used for the model were size = 5 and weight decay = 0.1, with an RMSE value of 0.101. The ANN model was trained with a learning rate of 0.01 and the logistic sigmoid activation function. Hyperparameter tuning of the ANN implemented by varying the size and decay achieved the best accuracy of 98.64%, at size = 50 and decay = 0.01, as shown in Supplementary Table S3.
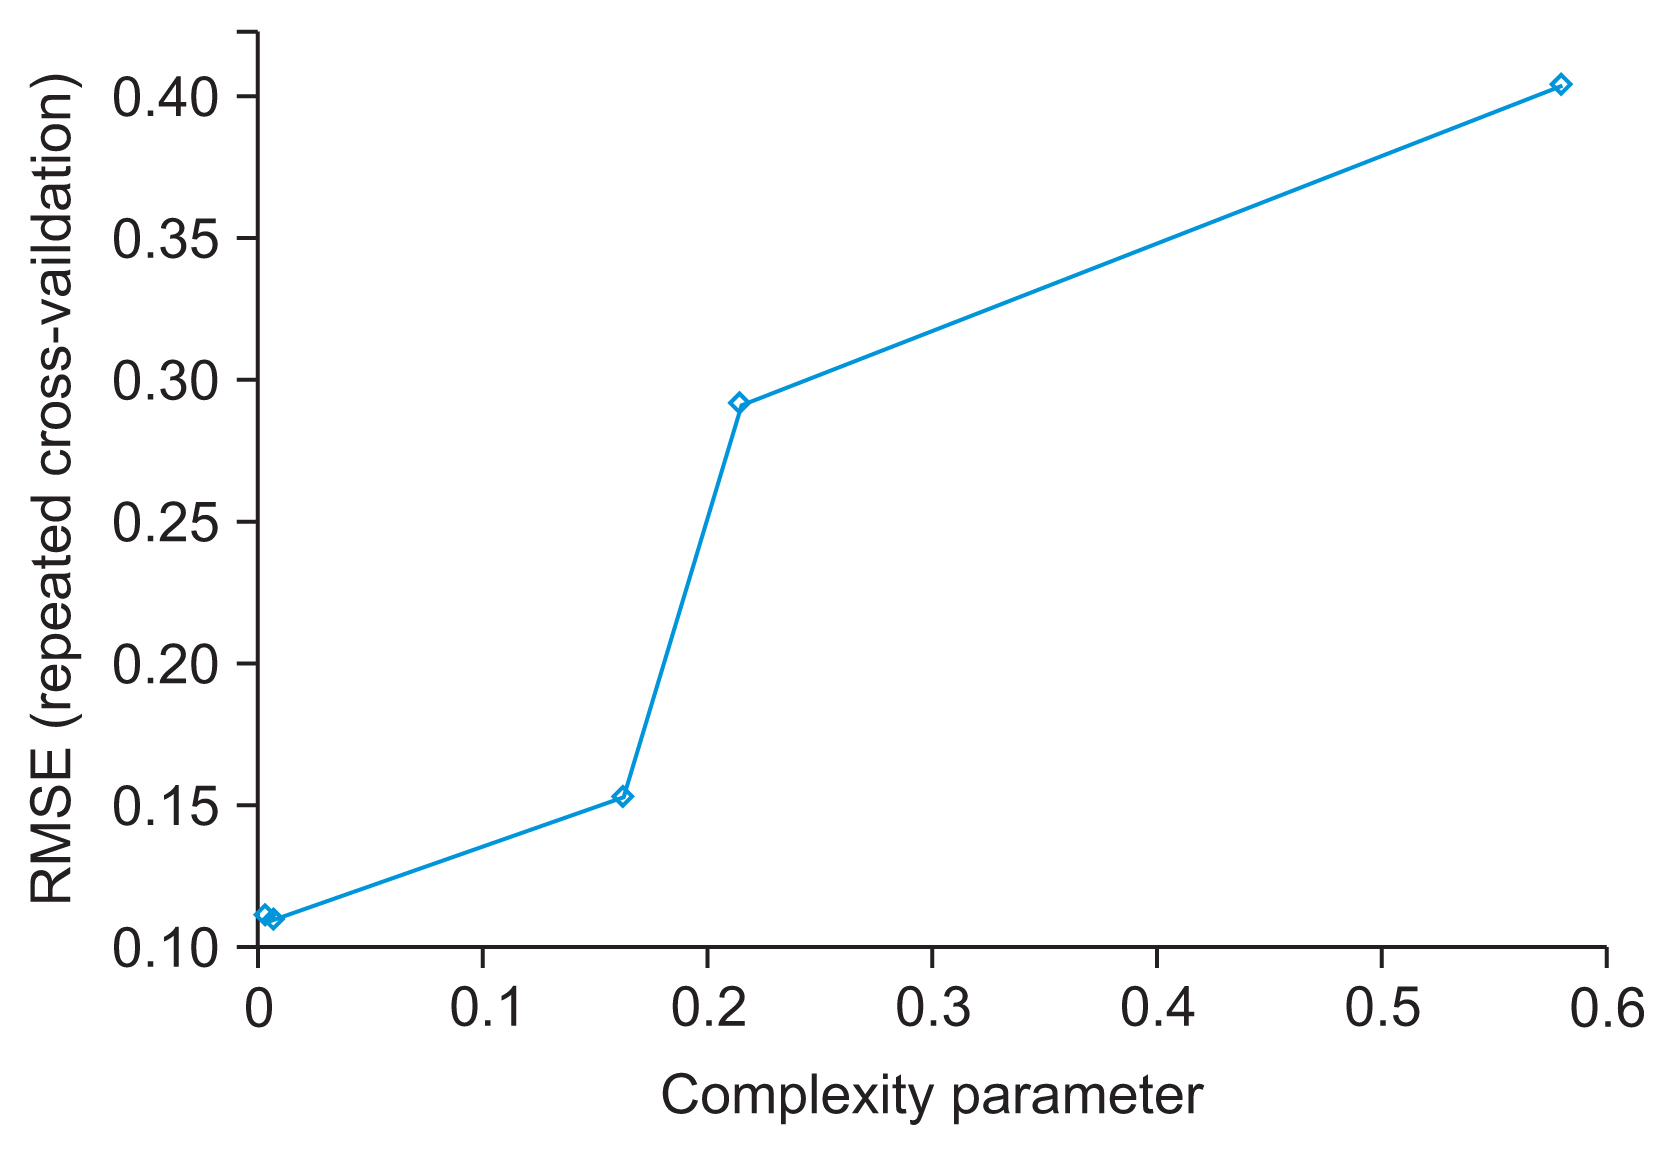
Performance of the artificial neural network model. RMSE: root mean square error.
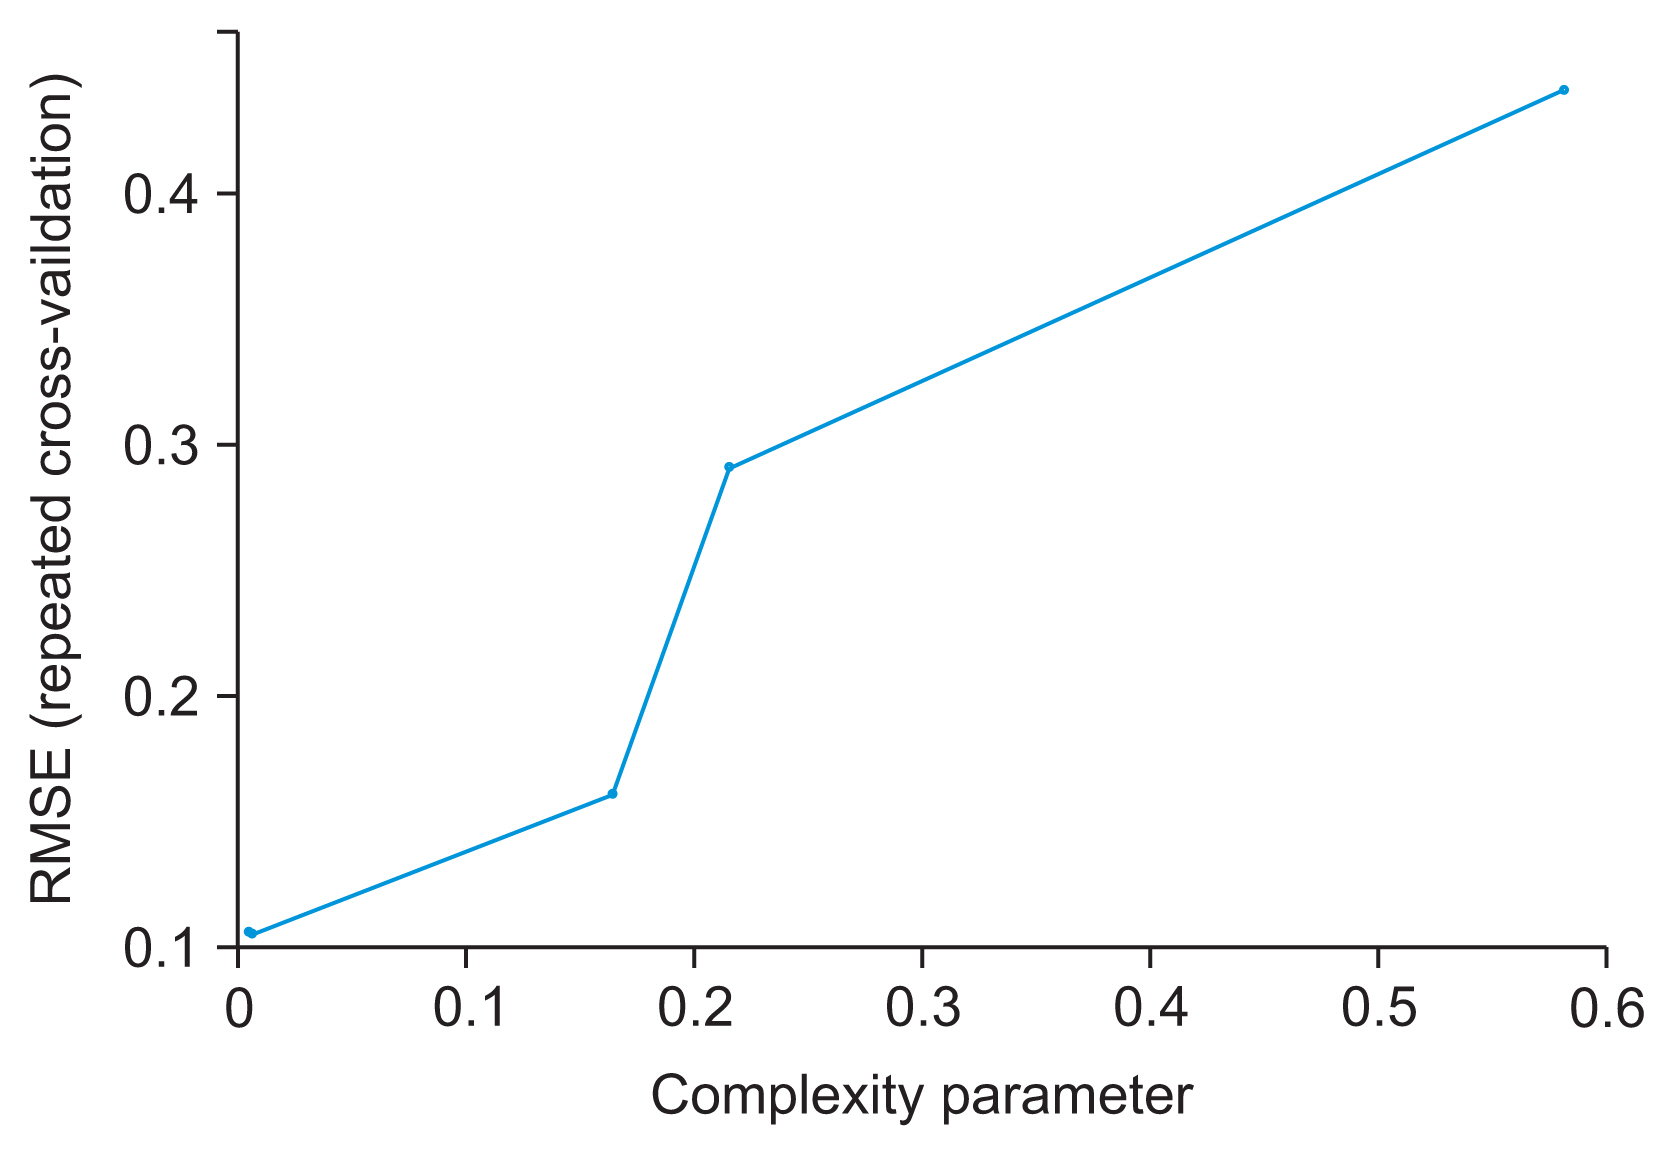
Performance of the decision tree algorithm. RMSE: root mean square error.
The DT algorithm identified age as the strongest predictor of the splitting node (Figure 4). The tree revealed that the 48% of participants who were <50 years of age had a 13% probability of DM prevalence, whereas the 52% of participants who were >50 years of age had a 69% probability of DM prevalence. Other DT findings are shown in Figure 4.
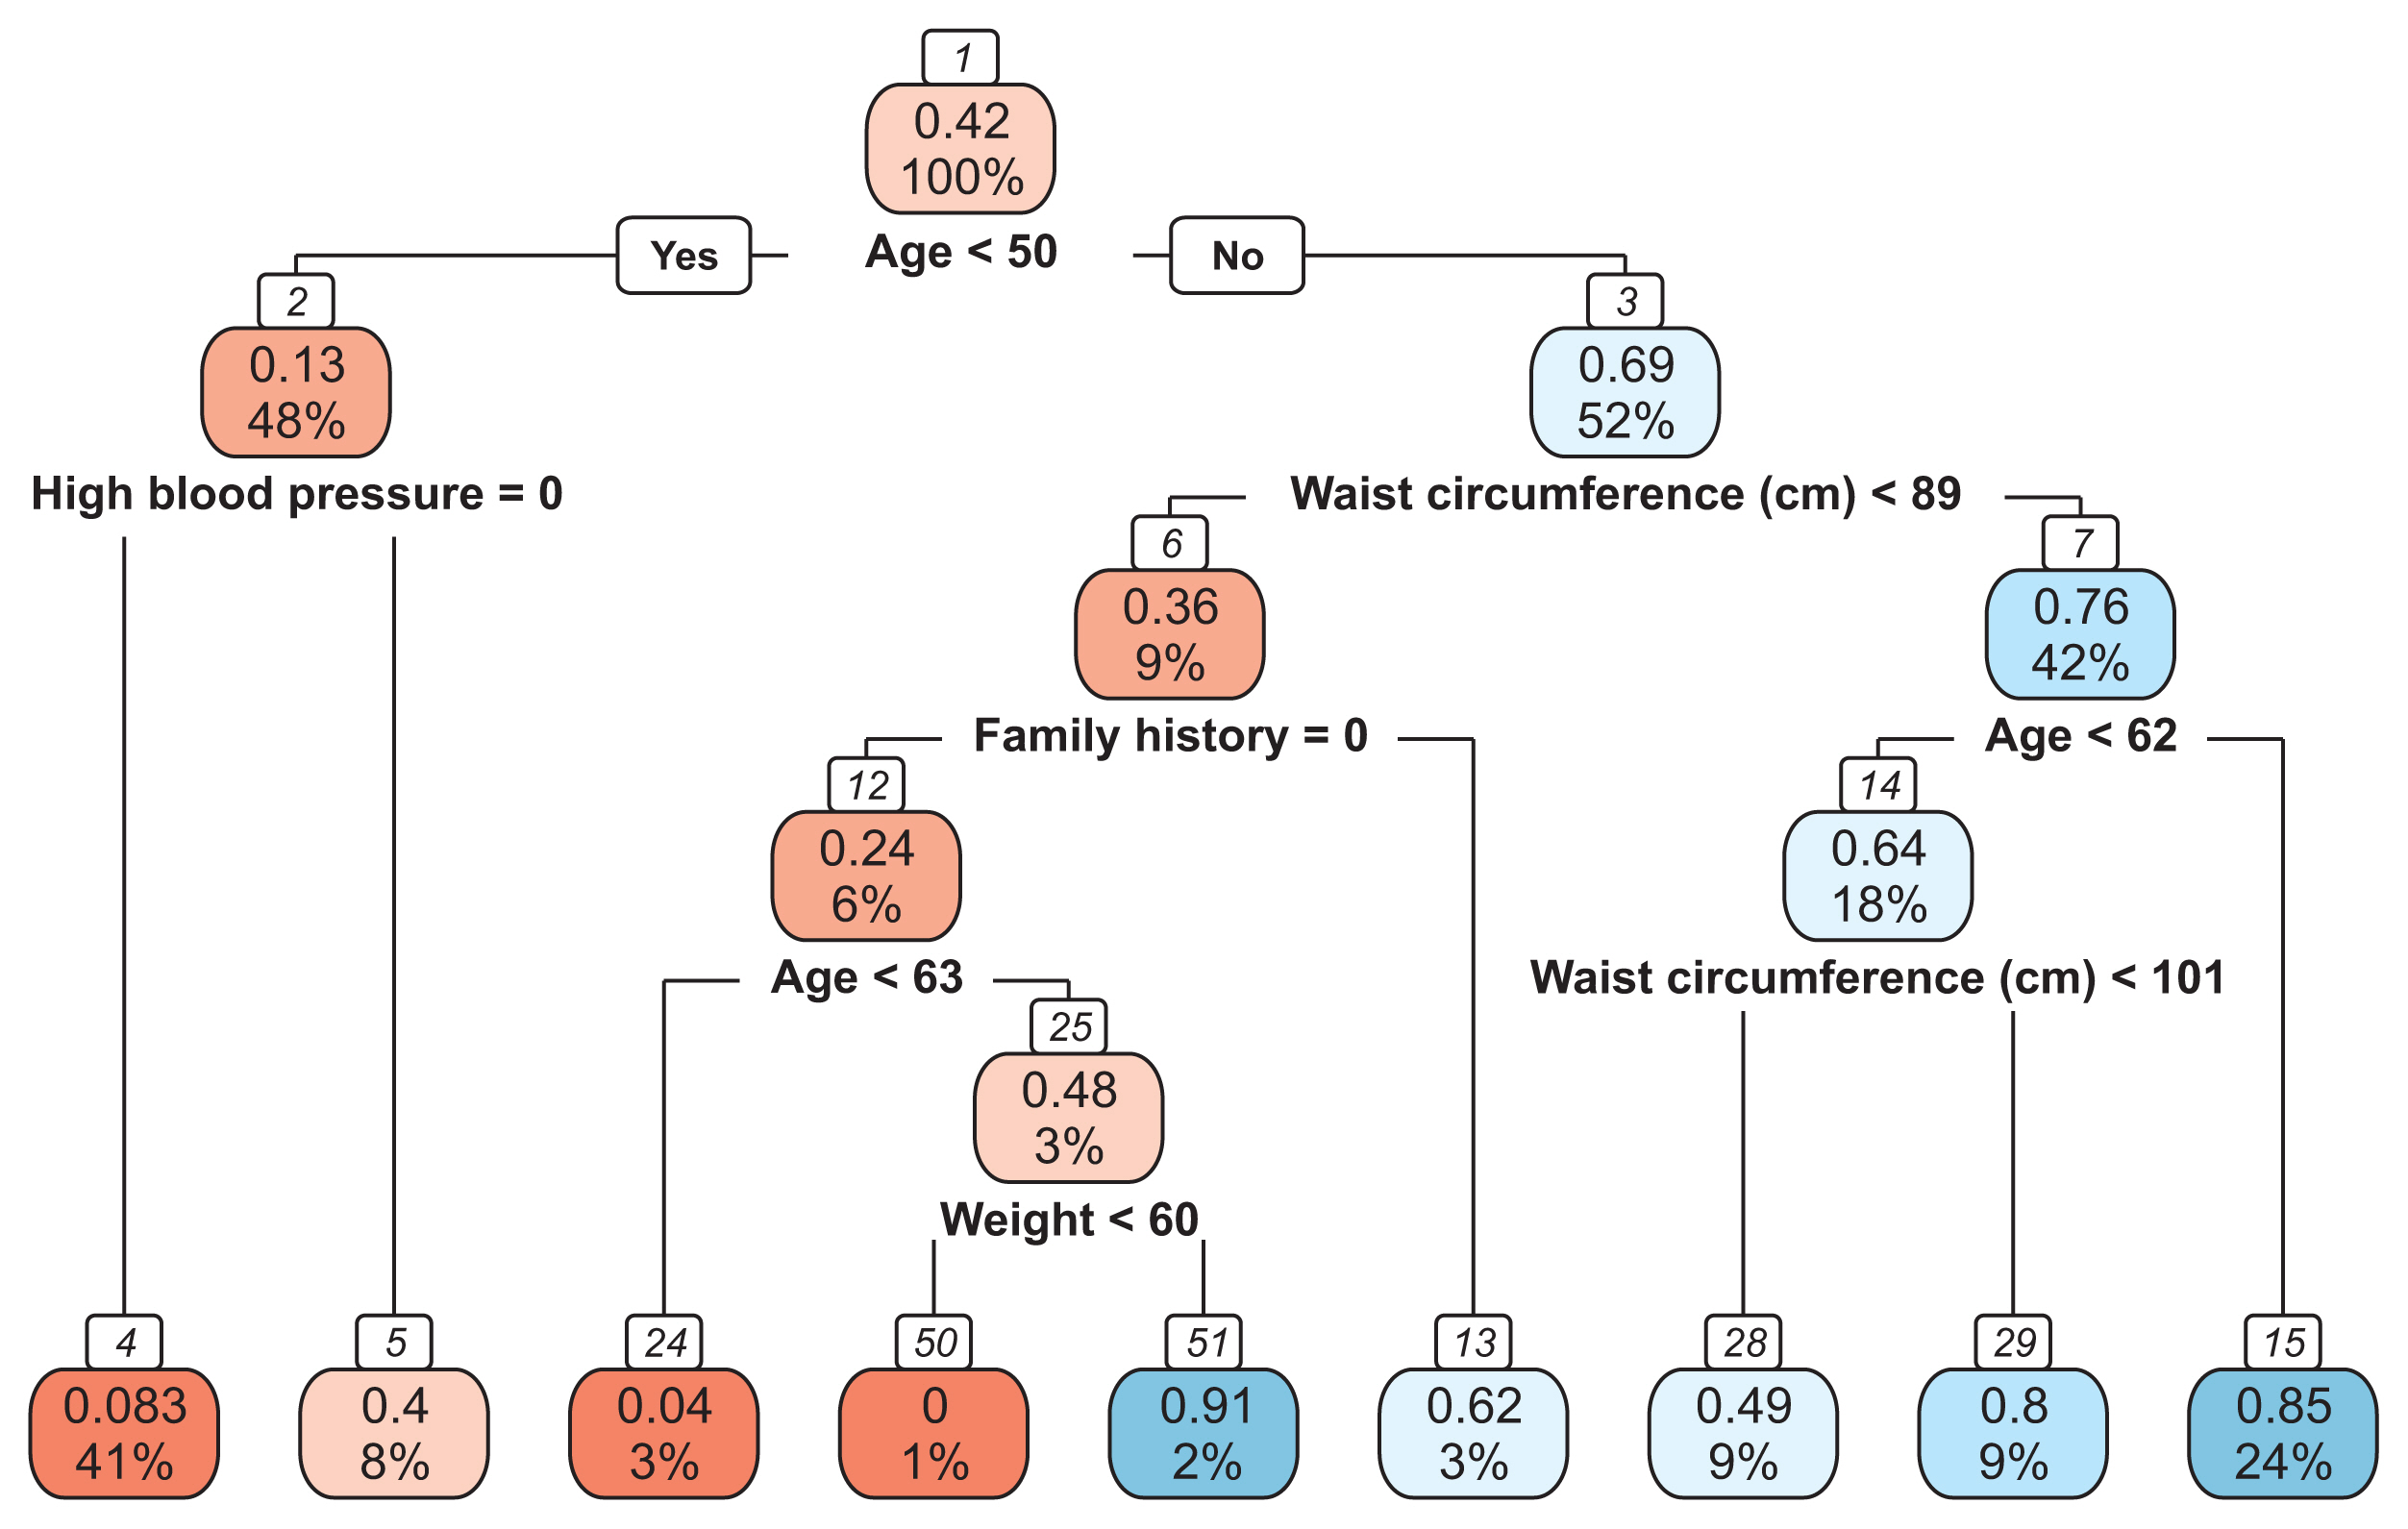
Decision tree algorithm for predicting diabetes mellitus.
The AUROC analyses for all three models showed that each model had excellent discriminant ability for DM among our sample of participants, as all the models correctly assigned a higher absolute risk score to a randomly selected participant with diabetes >95% of the time (AUROC: LR = 0.892, ANN = 0.976, DT = 0.992) (Supplementary Figures S1–S3). Pairwise comparison of the AUROC values of the predictive models was implemented using the DeLong test. Statistically significant differences were observed between LR and DT (p < 0.001), and between LR and ANN (p < 0.001). No statistically significant differences were observed between DT and ANN (p = 0.217) (Supplementary Table S4).
IV. Discussion
To our knowledge, this is the first study to implement a combination of LR, ANN, and DT models to predict DM in a sample of prospectively recruited participants in Nigeria. We observed that older age, positive family history of DM, high blood pressure, truncal obesity, and poor oral health were statistically significant predictors of DM. These findings were not unexpected, as the aging process is closely related to metabolic disorders such as type 2 DM, and the risk of type 2 DM increases with a positive family history of DM [19,20]. Similarly, the link among truncal obesity, high blood pressure, and diabetes is also well documented [18,21], and poor oral health has also been shown to be an independent risk factor for DM [22]. Consistent findings were observed in similar studies in Guangzhou, China [8] and in Canada [23]. In this study, we did not observe any significant associations between diabetes and sex, fish consumption, or physical activity, contrary to the findings of the study in Guangzhou, China [8]. This may be due partly to racial or cultural differences or food choices, which may vary from country to country.
In the three predictive models used in this study, age was the most important risk factor for type 2 DM. Similar findings were observed in studies conducted in Palestine (using ANN) and in Guangzhou, China (using ANN, DT, and LR models), where age was also found to be the most important variable. Those studies, like ours, did not include FPG levels as an input variable [8,24]. In a Canadian study where FPG was an input variable, findings using LR and gradient boosting machine techniques showed that FPG was one of the most important predictors of DM [23]. In our study, the DT model showed high blood pressure to be one of the most important variables, similar to the findings of the study in Palestine [24]. Using the LR model, a positive family history of DM was the second most important variable observed in our study, similar to the findings obtained in the LR and ANN models in the Chinese study [8].
Comparing the three models, we observed that the DT analysis performed best in terms of all classification parameters except for sensitivity and NPV. It was followed by the ANN model, while LR performed the least well. A study in Thailand observed the same order [25]. A similar study in Guangzhou, China observed that DT performed best and ANN performed worst [8]. Studies in Italy and among rural residents in Henan Province, China showed that ANN performed better than LR [26,27].
Further evaluations using the AUROC of the three predictive models showed a statistically significant difference between LR and ANN, as well as between LR and DT. However, there was no statistically significant difference in performance of ANN and DT. The performances of the three models in predicting DM were relatively high, with DT being higher than ANN and LR, respectively. A similar study in Tehran, Iran showed no performance differences between ANN and LR models [28]. Since DT and ANN had >95% discriminatory values for DM, we are confident that our data and the two predictive models can be a basis for the development of a valid risk assessment tool to predict DM among the Nigerian population. Another study conducted in Tianjin, China, also showed that the AUROC was the highest for a DT (0.8863) model, followed by LR. The authors, however, concluded that the LR was a better choice in view of its efficiency and accuracy, unlike in this study [29].
This study is one of the first to use predictive models to identify significant predictors of DM in a sample exclusively composed of Nigerians. A strength of this study lies in the comprehensive models developed; however, it has some limitations. Firstly, the self-reported nature of some of the variables may have been affected by recall or social desirability bias. Secondly the cross-sectional nature of the study does not allow for causal inferences. Nevertheless, the study does provide useful insights into the predictive risk factors for DM among Nigerians.
In conclusion, in this study, we implemented DM prediction models using three data mining algorithms: LR, ANN, and DT. We identified age and family history of DM as the most important predictors of DM. All three models had high discriminatory value for DM among our sample of participants. Of the three, the DT model performed best, followed by the ANN model and LR model in descending order.
Notes
Conflict of Interest
No potential conflict of interest relevant to this article was reported.
Acknowledgments
Research reported in this publication was supported by the Fogarty International Center of the National Institutes of Health (Award No. D43TW010134). The content is solely the responsibility of the authors and does not necessarily represent the official views of the National Institutes of Health.
Supplementary Materials
Supplementary materials can be found via https://doi.org/10.4258/hir.2021.28.1.58.