


I. Introduction
According to the Health Statistics 2021 published by the Organization for Economic Cooperation and Development (OECD), the life expectancy of Koreans as of 2019 is 83.3 years, which is higher than the average (81 years) in the 37 OECD countries [1]. Despite their high life expectancy, many elderly people face health concerns of varying severity. The Korea Institute for Health and Social Affairs reported that 84% of people aged above 64 have one or more chronic diseases, while 54.9% of them face multi-morbidity [2]. In particular, older adults’ health conditions can suddenly deteriorate during the aging process. However, effective ways to detect frailty are not easily available, even though the early detection of frailty is necessary for preventing adverse health outcomes in vulnerable elderly individuals [3].
Frailty, also known as frailty syndrome, is a specific term that refers to the deterioration of organ and cellular function due to senescence [4]. A weakened recovery system and multiple chronic health problems lead patients to experience adverse health outcomes such as walking disorders, falls, decreased quality of life, and comorbidities [5]. Without proper care, elderly people will eventually have difficulty performing daily activities and may be admitted to an institution or a hospital before a severe health condition occurs, increasing their risk of premature mortality [6]. Thus, the early detection of frailty is crucially important for the longevity and safety of older adults.
In 2001, Fried et al. [7] developed a questionnaire-based frailty assessment tool, also known as Fried’s frailty phenotype. Fried used five criteria (unintentional weight loss, exhaustion, loss of strength, low physical activity, and slow gait speed) to analyze a person’s frailty status. However, given differences in culture and living conditions, several studies have developed tools to analyze the frailty of elderly Koreans, such as the KFI-PC and KFS [8,9].
In this study, we applied machine learning to data from the Korean Frailty and Aging Cohort Study (KFACS) [10] to develop a machine learning model (the KFACS-ML) that can swiftly detect frailty and can identify predictors of frailty. We expect the model to reduce the time and resources spent on diagnosing frailty in comparison to the existing methods. Moreover, our approach would allow people to check their own frailty status regardless of their location.
II. Methods
1. Methodological Framework
This study carried out the following four steps to construct the KFACS-ML: data preparation, preprocessing, feature selection, and training/testing the model. Figure 1 outlines the overall process of this study. In the data preparation section, we constructed the dataset for our analysis by selecting questionnaire items suitable for the purpose of this study from the KFACS data. In the preprocessing section, missing values and outliers were removed to apply machine learning methods to the previously configured dataset. In the feature selection step, we extracted features from the preprocessed dataset that had predictive power for frailty. Lastly, in the training/testing step, the machine learning model was applied and we evaluated how well the model was trained, its validity, and its performance.
2. Data Preparation
This research was based on the dataset from the KFACS. The KFACS aims to analyze the causes of frailty and its effects among elderly people (aged between 70 and 84 years). The study annually collects various information from the participants. A total of 1,559 and 1,455 participants were collected in 2016 and 2017, respectively. The scope of the KFACS is substantial. It involves more than 700 survey items related to participants’ personal, medical, cognitive, and socioeconomic information. Information on participants’ health included physical performance examination results, detailed blood tests, and medical history.
To utilize the KFACS dataset, we first defined labels and features. In machine learning, the value to be predicted is called a “label,” and the attributes used for prediction are called “features.” Since the items to be predicted in this study are the signs of frailty, data labeling was applied to the KFACS dataset using the Korean version of Fried’s frailty phenotype. The KFACS version of Fried’s frailty phenotype comprises five questions, the same as in Fried’s original method. and all five questions must be answered to yield a frailty score from 0 to 5. According to the scores, three physical conditions could be defined. A person is defined as “robust” if all five questions have a score of 0, “pre-frail” if the person scores between 1 and 2, and “frail” if the person scores 3 points or more. Only the participants with robust and frail conditions were included in our sample because this study aimed to develop a frailty detection model.
Since the purpose of this study was to develop a frailty detection model that does not require a person to visit a hospital or to take tests to be diagnosed as frail, we only included simple questions that could be easily answered by any ordinary person. Accordingly, participants who did not fully answer the five frailty questions were excluded, as were all items that could not be answered through self-responses. Finally, in the data preparation process, 1,541 participants and 140 features suitable for the purpose of this study were selected from the KFACS dataset.
3. Preprocessing
In the preprocessing step, we eliminated missing values and outliers, scaled the data, and checked the distributions of labels. Due to the small sample size, removing all observations with missing values resulted in a dramatic decrease in the sample size. Therefore, in this study, features with more than 100 missing values were removed first, and then observations with missing values were removed. During this process, 97 observations and 34 features were removed.
We defined outliers as observations that incorrectly affected changes in the label and features that did not have any relationship with the label. All these outliers were removed from our sample. Moreover, 213 participants who did not answer all five frailty questions or who answered all the questions as “don’t remember” were excluded, and two features with a standard deviation of 0 were removed.
In addition, a scaling operation was performed to standardize values from different features. This is because a machine learning model will be biased towards a feature with higher values. In this study, all feature values are normalized to have a mean of 0 and a standard deviation of 1.
After preprocessing, 1,231 observations (i.e., individual participants) and 104 features remained in our dataset. Among those 1,231 participants, 1,066 are robust and only 165 are frail. Since the robust participants substantially outnumbered the frail participants, our dataset was imbalanced.
4. Feature Selection
Feature selection refers to the process of selecting a subset of features that have an important influence on predicting the outcome. Since the performance of a machine learning algorithm is closely related to the training set, it is crucial to construct a training set with proper features to develop a high-performance model. Accordingly, feature selection was applied before the training process. In this study, we applied multiple feature selection techniques to extract the features that had meaningful predictive power for frailty.
For feature selection, three popular methods exist: the filter, wrapper, and embedded methods [11]. The filter method involves selecting features based on statistical characteristics. More specifically, it selects the dependent variables that have a high correlation and removes variables with low variance. The filter method has the advantage of quickly selecting features, but it has two limitations. First, the threshold value has to be assigned by the user. Second, the stability of the results is poor because the method only considers each feature in isolation, ignoring the dependency between different features.
The wrapper method chooses the best subset of features with the highest performance after trying out various subsets of features. There are various methods of selecting feature subsets. Recursive feature elimination recursively removes features using a support vector machine (SVM) method. Sequential feature selection uses a greedy algorithm to add features one by one to an empty subset and then chooses the combination of features with the best performance. Although the wrapper method has the advantage of higher stability than the filter method, because it uses a machine learning classification method, it takes a long time to select features and poses a risk of overfitting.
Lastly, the embedded method combines the advantages of the filter method and the wrapper method. The method uses an embedded feature selection function. The function results in higher stability than the filter method and takes less time to select features than the wrapper method. However, since the embedded method also uses a classification method, there is a risk of overfitting. In this study, to find the optimal feature subset, performance was measured using various feature methods used in previous studies, and the subset of features with the highest performance was selected. Since the filter method operates based on a statistical analysis, meaning that the method cannot find the optimal feature subset, it was not used for feature selection. Thus, using the two feature selection methods, we discovered 27 features.
5. Model Training
Three machine learning algorithms were used to build frailty detection models: SVM, random forest (RF), and gradient boosting (GB) [12–14]. These three algorithms are well-known for showing good performance in solving classification problems [15]. Since this study dealt with a classification problem—that is, accurately classifying whether a participant was frail—SVM, RF, and GB were used.
However, it should be noted that our dataset was imbalanced. In order to overcome this problem, the holdout method (training: 80% and testing: 20%) with random resampling and stratified k-fold cross-validation was used to split the training set and estimate the model performance [11].
The k-fold cross-validation method measures average performance by dividing data into k subsets and then repeating the process of using one subset for validation and the remaining subsets as training sets. All data are used in a validation set at least once because training and verification are repeated while changing the validation set k times. Therefore, it enables researchers to measure the average performance of the trained model rather than its performance based on a specific dataset.
Stratified k-fold cross-validation is a method of dividing the dataset while considering the distribution of each label when dividing the fold into k layers. The dataset used in this study was imbalanced, with there being approximately 6.4 times more robust participants (1,066) than frail participants (166). To balance this, the stratified 10-fold method was applied to our dataset.
By implementing the aforementioned procedures, each model was trained with hyperparameters based on the three machine learning algorithms with features included from the feature selection process to achieve the optimal performance for building an effective model. Finally, a validation curve was visualized to ensure that the model was trained with proper hyperparameters and avoided overfitting.
III. Results
In this study, the final performance of three algorithms (SVM, RF, and GB) was evaluated using a test set, which contained unseen data not used for training or validation, and the results are shown in Table 1. The left side of the table shows the performance of the basic model, while the right side of the table presents the performance of the final model after optimization and generalization.
The macro average is the average value for each label (robust and frail), whereas the weighted average was calculated using weights based on each label’s distribution. For the frail label, the recall was quite low due to the imbalanced class distribution of the dataset. However, the precision score was 0.88 or greater in all three machine learning algorithms. Given that the weighted average of the F1-score was 0.94 or higher, all three algorithms generated meaningful outcomes for frailty detection.
Table 2 shows the mean square error of the training and validation sets according to changes in hyperparameters in each model. To prevent the model from overfitting to the training set, we selected each hyperparameter at the time when the validation error increased or no longer decreased. In the tuning process, SVM used the RBF kernel in the base model and had a C-value of 1.0, while the linear kernel and C values changed after tuning, resulting in a slight increase in performance.
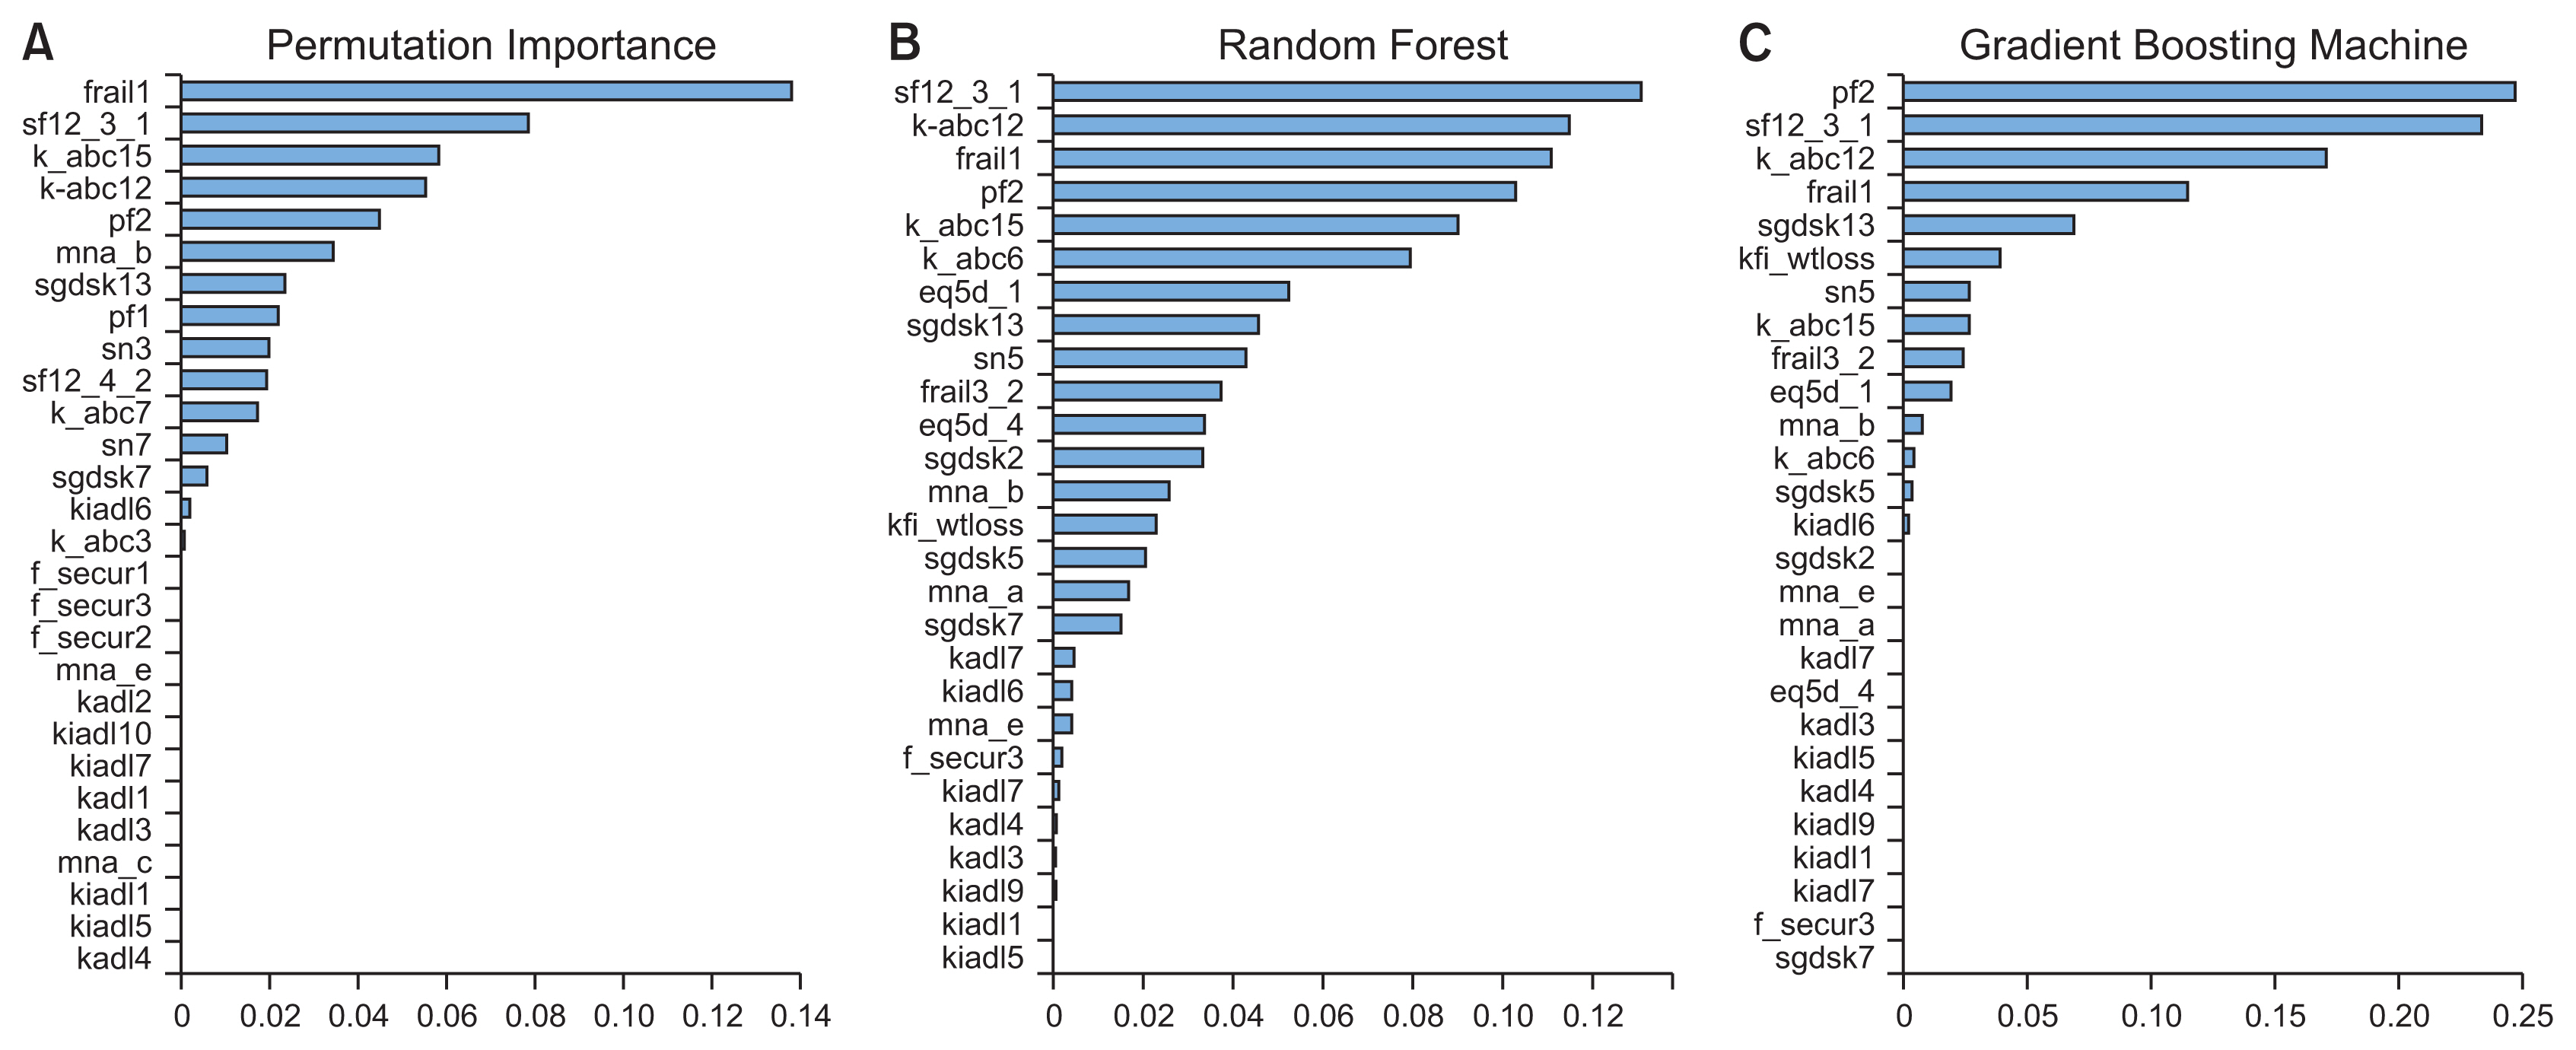
Figure 2 shows the permutation importance and feature importance within the RF and GB models derived from the feature selection process. The permutation-based determination of features showed different results from those derived from the models’ assessment of feature importance. A tree-based algorithm is likely to inflate the importance of features with high cardinality, leading to a risk of bias. Therefore, it is desirable to consider the results from both the feature selection process and the permutation-based determination of feature importance.
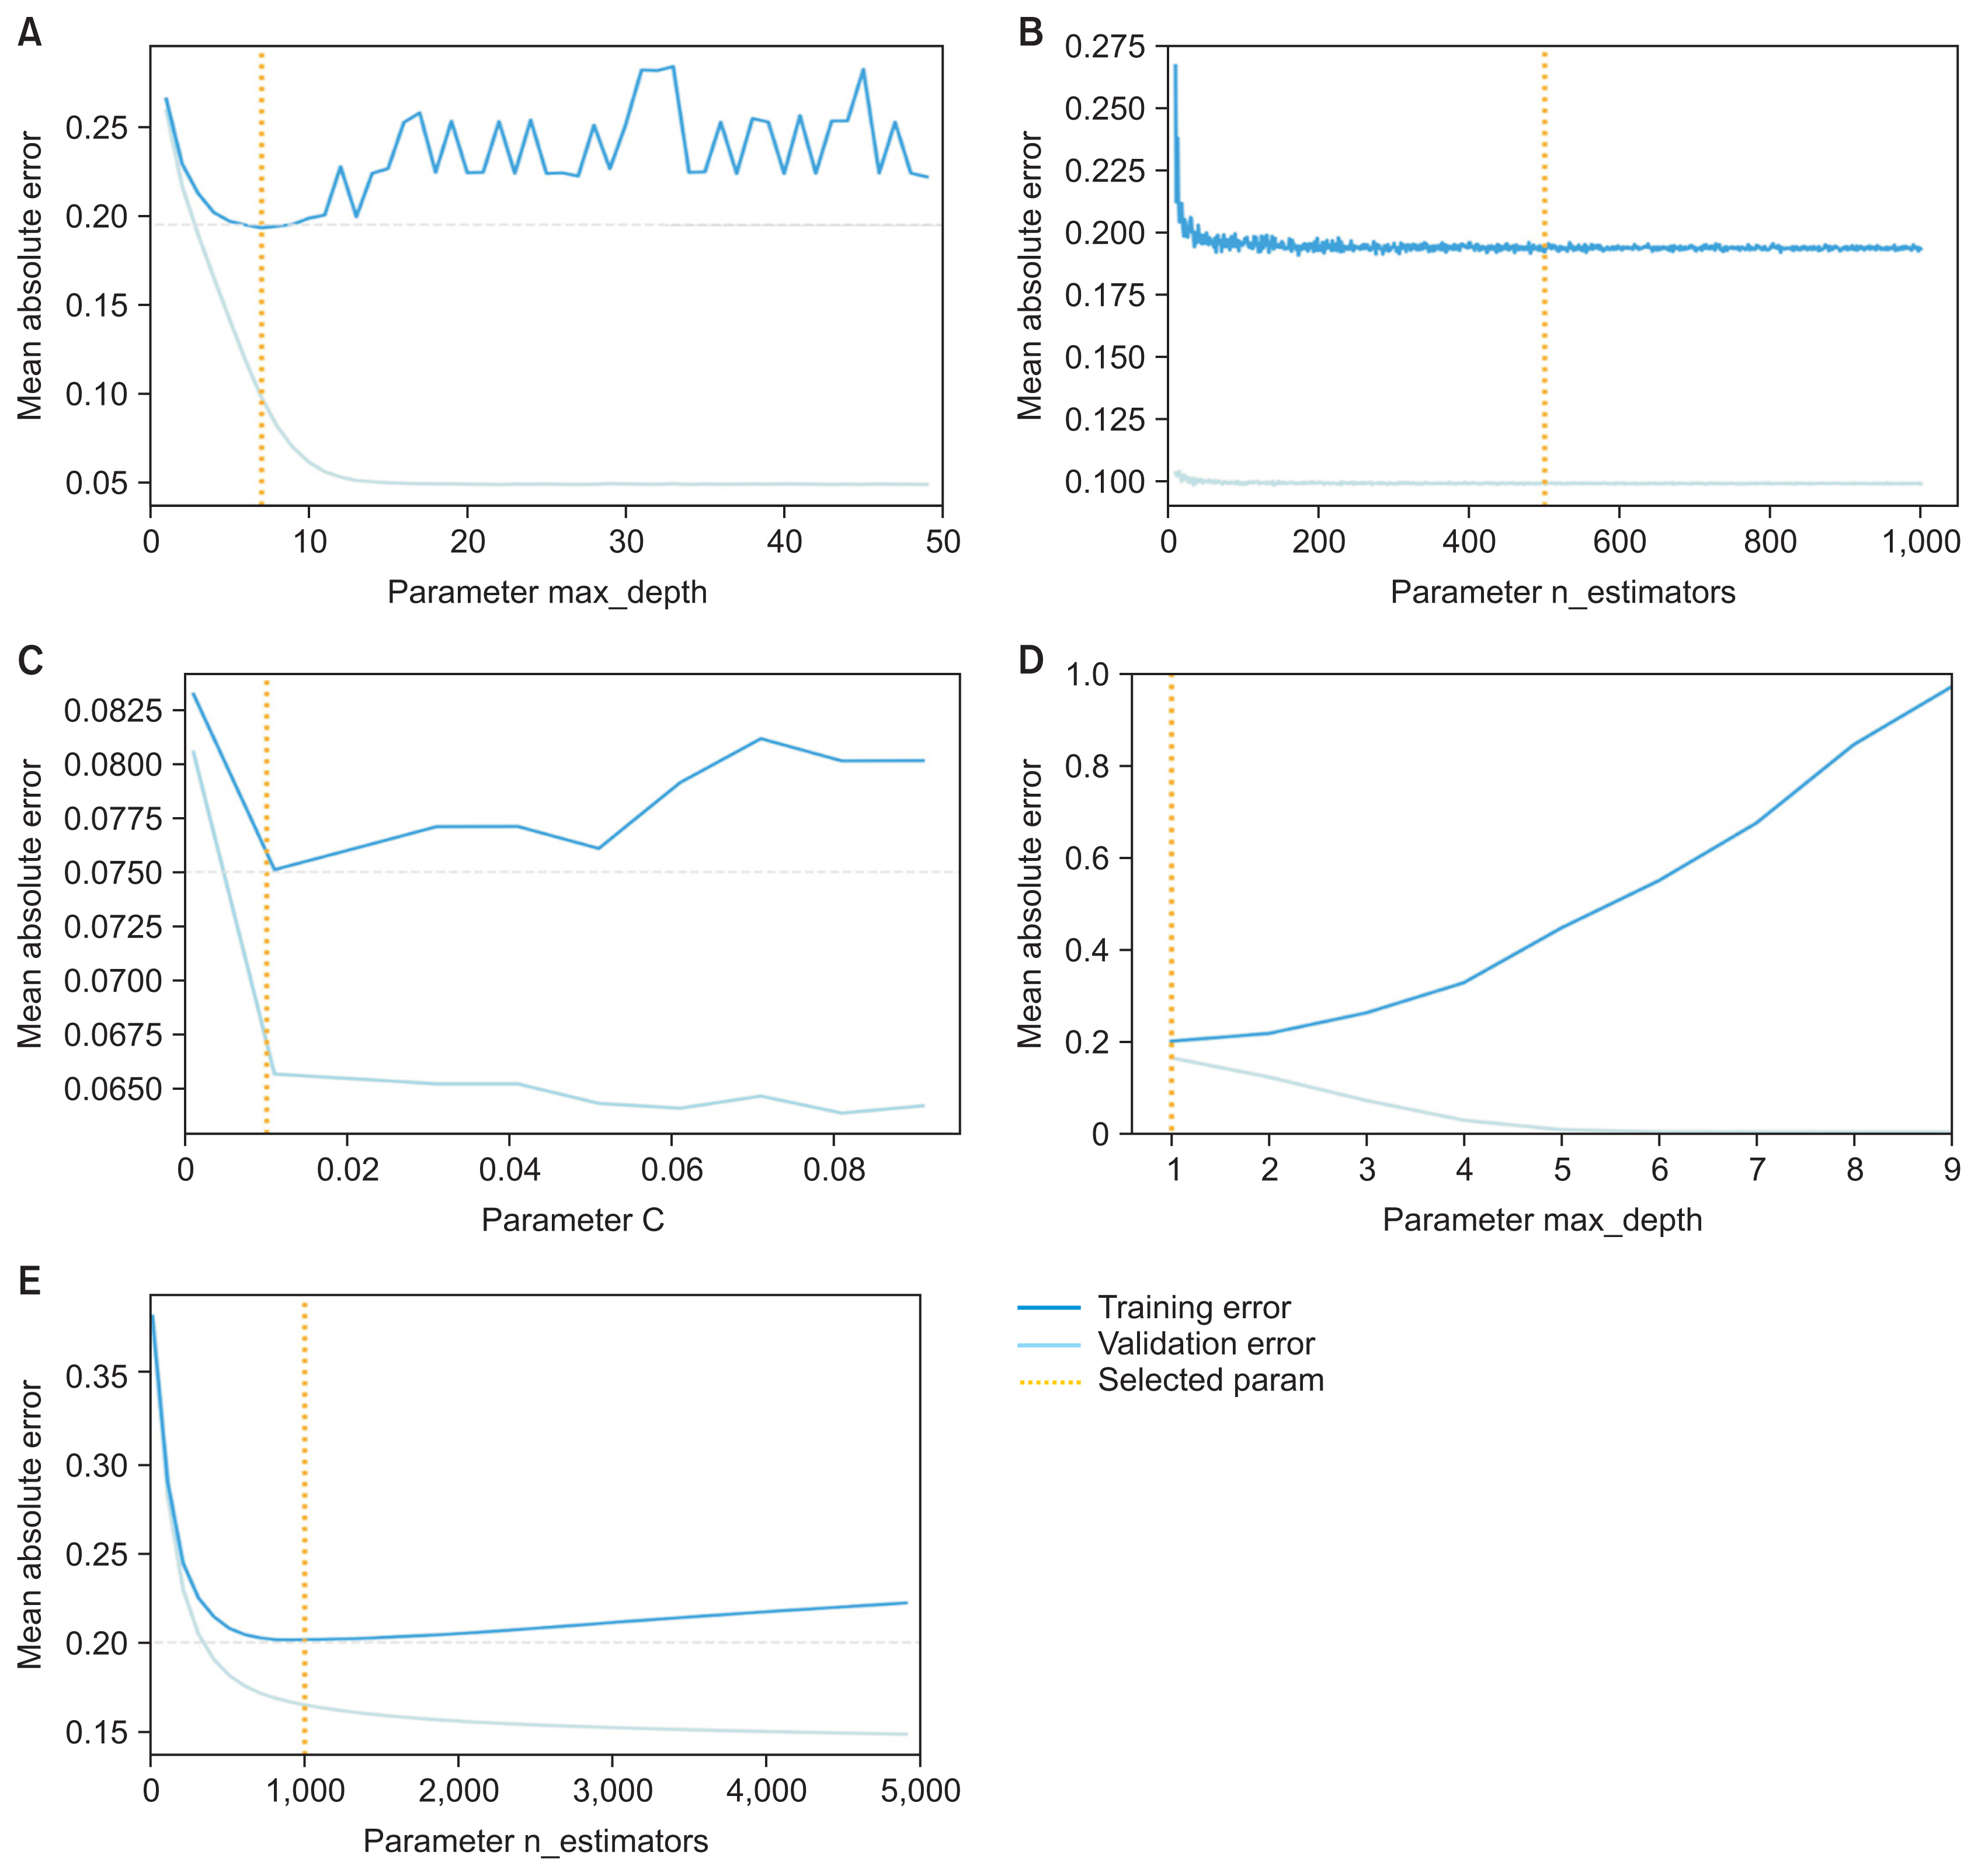
Comparing the three methods of determining feature importance, as shown in Figure 2, four out of the top five items were the same among the methods; these features can be interpreted as having a major influence on predicting frailty. The study showed 27 meaningful features from the 11 aging sectors listed in KFACS which were EuroQol Five-Dimension Scale (EQ5D) [16], Korean version of the frail scale (FRAIL) [17], food security (F_SECUR) [18], Korean version of the Activities of Daily Living (KADL) [19], weight loss from the Korean Frailty Index (KFI_WTLOSS) [8], Korean version of the Instrumental Activities of Daily Living (KIADL) [20],Korean version of the Activities-specific Balance Confidence (K_ABC) [21], Mini Nutritional Assessment (MNA) [22], mobility (PF) [23], 12-item Short Form Survey (SF12) [24], Korean version of the Short Form Geriatric Depression Scale (SGDSK) [25]during the feature selection process. Table 3 presents the actual questions in the questionnaire for each feature. Lastly, Figure 3 shows a validation curve with the line created before the validation error increased or no longer decreased to avoid overfitting. All models selected the proper lines, which were the values of the hyperparameters shown in the graphs.
IV. Discussion
Since frailty is an aging-associated deterioration of multiple physiological systems in human beings, the early detection of frailty could prevent or reduce the risk of adverse health outcomes and provide a chance to reverse frailty with appropriate interventions. Thus, a technique that can easily detect frailty is necessary would have important implications. Hence, this study developed a frailty detection model (the KFACS-ML) that allows anyone to check whether they are frail regardless of their location in a less time-consuming way than is currently possible.
Initially, our dataset suffered from a severe imbalance. To overcome this problem, we applied the holdout methods with random resampling and the stratified k-fold method. In addition, a validation curve was also visualized to ensure that the model was trained without a risk of overfitting. Overall, the three proposed models were fitted properly and showed high performance based on the weighted average F1-score, which reached 95.30%.
Several studies have aimed to extract features that influence frailty. The KFI-PC and KFS, which were developed as frailty screening tools for Koreans, provide 53 and 6 important frailty features, respectively. In this study, 27 meaningful features were found in the development of the KFACS-ML. Nine of these features were shared with the KFI-PC: KIADL5, KIADL6, KIADL7, K_ABC6, K_ABC12, K_ABC15, MNA_A, and SGDSK2.
The KFS classifies six frailty features that could be divided into three domain areas: physical, mental and social. Similarly, our 27 features can also be classified into these three areas: physical frailty (FRAIL3_2, SF12_3_1, PF2, K_ABC6, K_ABC12, K_ABC15, KFI_WTLOSS, MNA_A, MNA_B, EQ5D_1, EQ5D_4, KADL3, KADL4, KADL7, KIADLl, KIADL5, KIADL6, KIADL7, KIADL9, F_SECUR3), psychological frailty (FRAIL1, SGDSK2, SGDSK5, SGDSK13, MNA_E, SGDSK7), and social frailty (SN5). However, the results of feature importance do not necessarily mean that the model has identified practical factors for frailty; this question requires further research for verification.
The results of this study were highly meaningful, showing the effectiveness of adopting machine learning for the development of a frailty analysis tool. Furthermore, a questionnaire-based examination is not the only way to detect frailty. Machine learning could incorporate various measurements for detecting frailty, such as biosensors and natural language processing-based communication analysis.
We believe that our machine learning approach is more flexible than the other human-based evaluations for building questionnaires to assess one’s health condition. Moreover, our approach can discover unknown factors that predict frailty.