


I. Introduction
Kidney disease is one of the most common causes of early death worldwide. The number of patients with chronic kidney disease (CKD) totaled 700 million in 2017. Around 1.2 million patients have died globally from it, a number expected to increase by 2.2–4.2 million by 2040 [1]. According to the Emirates Nephrology Society, more than 520 individuals per million in the United Arab Emirates (UAE) general population have CKD. Among the available treatment options, dialysis is the most common. The drawbacks of dialysis include its discomfort and cost. Patients must visit a healthcare facility weekly for two to four dialysis sessions, according to their physician’s recommendations. Dialysis sessions cost between USD 175 and USD 275 per session [2]. Furthermore, dialysis prescription and therapy are often complicated and rely primarily on patient data, where several attributes may affect the survival rate and treatment quality.
At the present time, machine learning (ML) and big data analytics have been integrated into the healthcare field to diagnose and treat long-term patients. Several studies have utilized big data for dialysis care. One such study, by Barbieri et al. [3], analyzed data from 766,000 patients across several years and developed a patient- and session-specific artificial neural network (ANN) model comprising 60 attributes. The model was used to predict risks from intradialytic hypotensive periods before each hemodialysis session from the heart rate and systolic blood pressure (SBP) profiles, dialysis dose (Kt/V), and post-dialysis body weight predictions.
Moreover, Dr. Brendan Bowman utilized big data from dialysis dosing records of about 3,000 patients over several months [4]. The study aimed to develop a model that helped clinicians accurately predict and control dialysis patients’ red blood cell (RBC) counts, which modeled treatment outcomes to reduce treatment costs. Several dialysis dosing studies, such as the HEMO trial study [5], asserted that providing a higher dialysis dose has benefits for the RBC count stability of only some dialysis patients, not all. The HEMO trial study did not demonstrate an improved survival rate or lower morbidity when a high-flux membrane was used. This proved that larger datasets yield reliable results; however, not all problems can be addressed and deciphered by the dataset size [6]. On this note, Perl et al. [7] acknowledged a need for further research on big data analysis, which would validate the application of multidimensional measures and compute adequate dialysis dosing levels for each patient’s treatment.
The number of kidney disease patients on dialysis is increasing, and their well-being relies on medical technology, which includes the necessity of proper dialysis dosing levels to ensure that patients receive the right dialysis treatment at the right time. Earlier studies offered little information regarding predictive models for treating kidney disease patients that could provide adequate dialysis dosage levels [8]. Hence, there is a need to develop a model that aids physicians and clinicians in delivering precise, optimized dialysis treatments through big data analytics.
For data modeling and analysis of dialysis patients, from a medical viewpoint, blood electrolytes are the most critical parameters and must be controlled. Understanding electrolyte parameters and predicting their outcomes to deliver the optimal dialysis dosing for each patient is a challenge [9,10]. Therefore, it is essential to understand the parameters that correlate with electrolyte levels before determining and prescribing improved dialysis dosing to patients. To understand a patient’s electrolyte levels, data analytics tools may provide some insights and help interpret the significance of trends [11,12]. Furthermore, it is possible to build predictive models that determine the most significant attributes for electrolyte level prediction, which may aid in decision-making to prescribe and improve the dialysis dosing for patients [13–16]. Hence, this study aimed to analyze and predict patients’ electrolyte levels to improve dialysis dosing guidance, with the ultimate goal of bringing about positive effects for patients’ quality of life and well-being, hospitals, and the healthcare field.
II. Methods
The proposed approach for analyzing and predicting patients’ electrolyte levels to improve patients’ dialysis dosing levels is outlined in this section. The proposed ML predictive model types for this research are also presented, with a brief description of each.
1. Data Collection and Pre-processing
A single-site retrospective study was conducted, and all available patients treated with kidney dialysis at University Hospital Sharjah gave consent to participate in the study. Patients were in the dialysis unit for 1–5 years. The Institutional Review Board (IRB) of University Hospital Sharjah approval was approved for this study (No. UHSHERC-012-10062019). The established records of 45 patients undergoing several months of dialysis for kidney malfunction were obtained through the hospital’s Electronic Medical Record (EMR) system. The EMR data were categorized into 117 attributes, which were converted to a format suitable for further processing by the predictive models. Data preprocessing was carried out using RapidMiner Studio 9.1 (RapidMiner, Boston, MA, USA), a data science platform that supports several artificial intelligence (AI) tools. This step involved four stages, explained below.
1) Data integration and cleaning
Data integration allows predictive models to run efficiently. It was implemented herein by consolidating data from 45 dialysis patients, with each having multiple dialysis data entries across several months. Attributes lacking more than 90% of their values were dropped from the analysis; furthermore, missing numeric values were supplied by the average attribute value, while categorical attributes were supplied by the most frequently occurring value. Further cleaning of the dataset involved manually replacing errors with a defined value as partial offset for the dataset’s “noise.”
2) Data transformation and reduction
This stage went hand-in-hand with the data-cleaning stage. Per-patient averages were calculated for attributes that were missing from some patients’ records. Several other attributes with missing values were replaced by means of proper nominal values or function expressions. If the values were missing for all months for a particular attribute in a patient’s record, then the entire row of missing values was deleted from the dataset. That is, the missing values were not input by any other means because doing so would have violated data integrity.
2. Exploratory Data Analysis and Data Algorithms
Exploratory data analysis (EDA) incorporates data knowledge and visualization tools to understand the relationships among significant patient attributes. To implement the EDA step, RapidMiner Studio 9.1 and Minitab (minitab.com) were used to create scatterplots and boxplots, which enabled visualizing vital blood electrolyte levels per patient and analyzing their trends in the dataset. A time-lapse view of vital electrolytes was also obtained to generate further insights from the dialysis sessions on a monthly basis.
ML algorithms were utilized to predict patient electrolyte levels from the selected attributes. The chosen algorithms were decision tree (DT), neural network (NN), linear regression (LR), and support vector machine (SVM) [17,18]. Each technique was selected for its popularity in the data science field, reported accuracy in previous research, and ease of use.
3. Data Prediction, Interpretation, and Predictive Model Performance
Predictive models were then built to select several electrolytes from the big data for analysis of precise dialysis dosing. The information obtained from the EDA step was taken, following patient privacy policies of not including any personal information, and was used to build the algorithmic models. The models were trained and validated using 80% of the available data, and the remaining 20% was used for testing the models.
Each trained predictive model was then tested with the final testing dataset to predict the output attributes, which were displayed as tables, charts, and reports. The predictive models identified the most significant predictive attributes for electrolyte concentrations, which could be used to prescribe precise dialysis dosing for each dialysis patient.
Finally, the four predictive techniques were compared to evaluate the performance of each model in terms of the root squared correlation (R2) and root mean square error (RMSE). The comparisons indicated which of the models would generate the best predictive results, with fewer errors and uncertainties.
III. Results
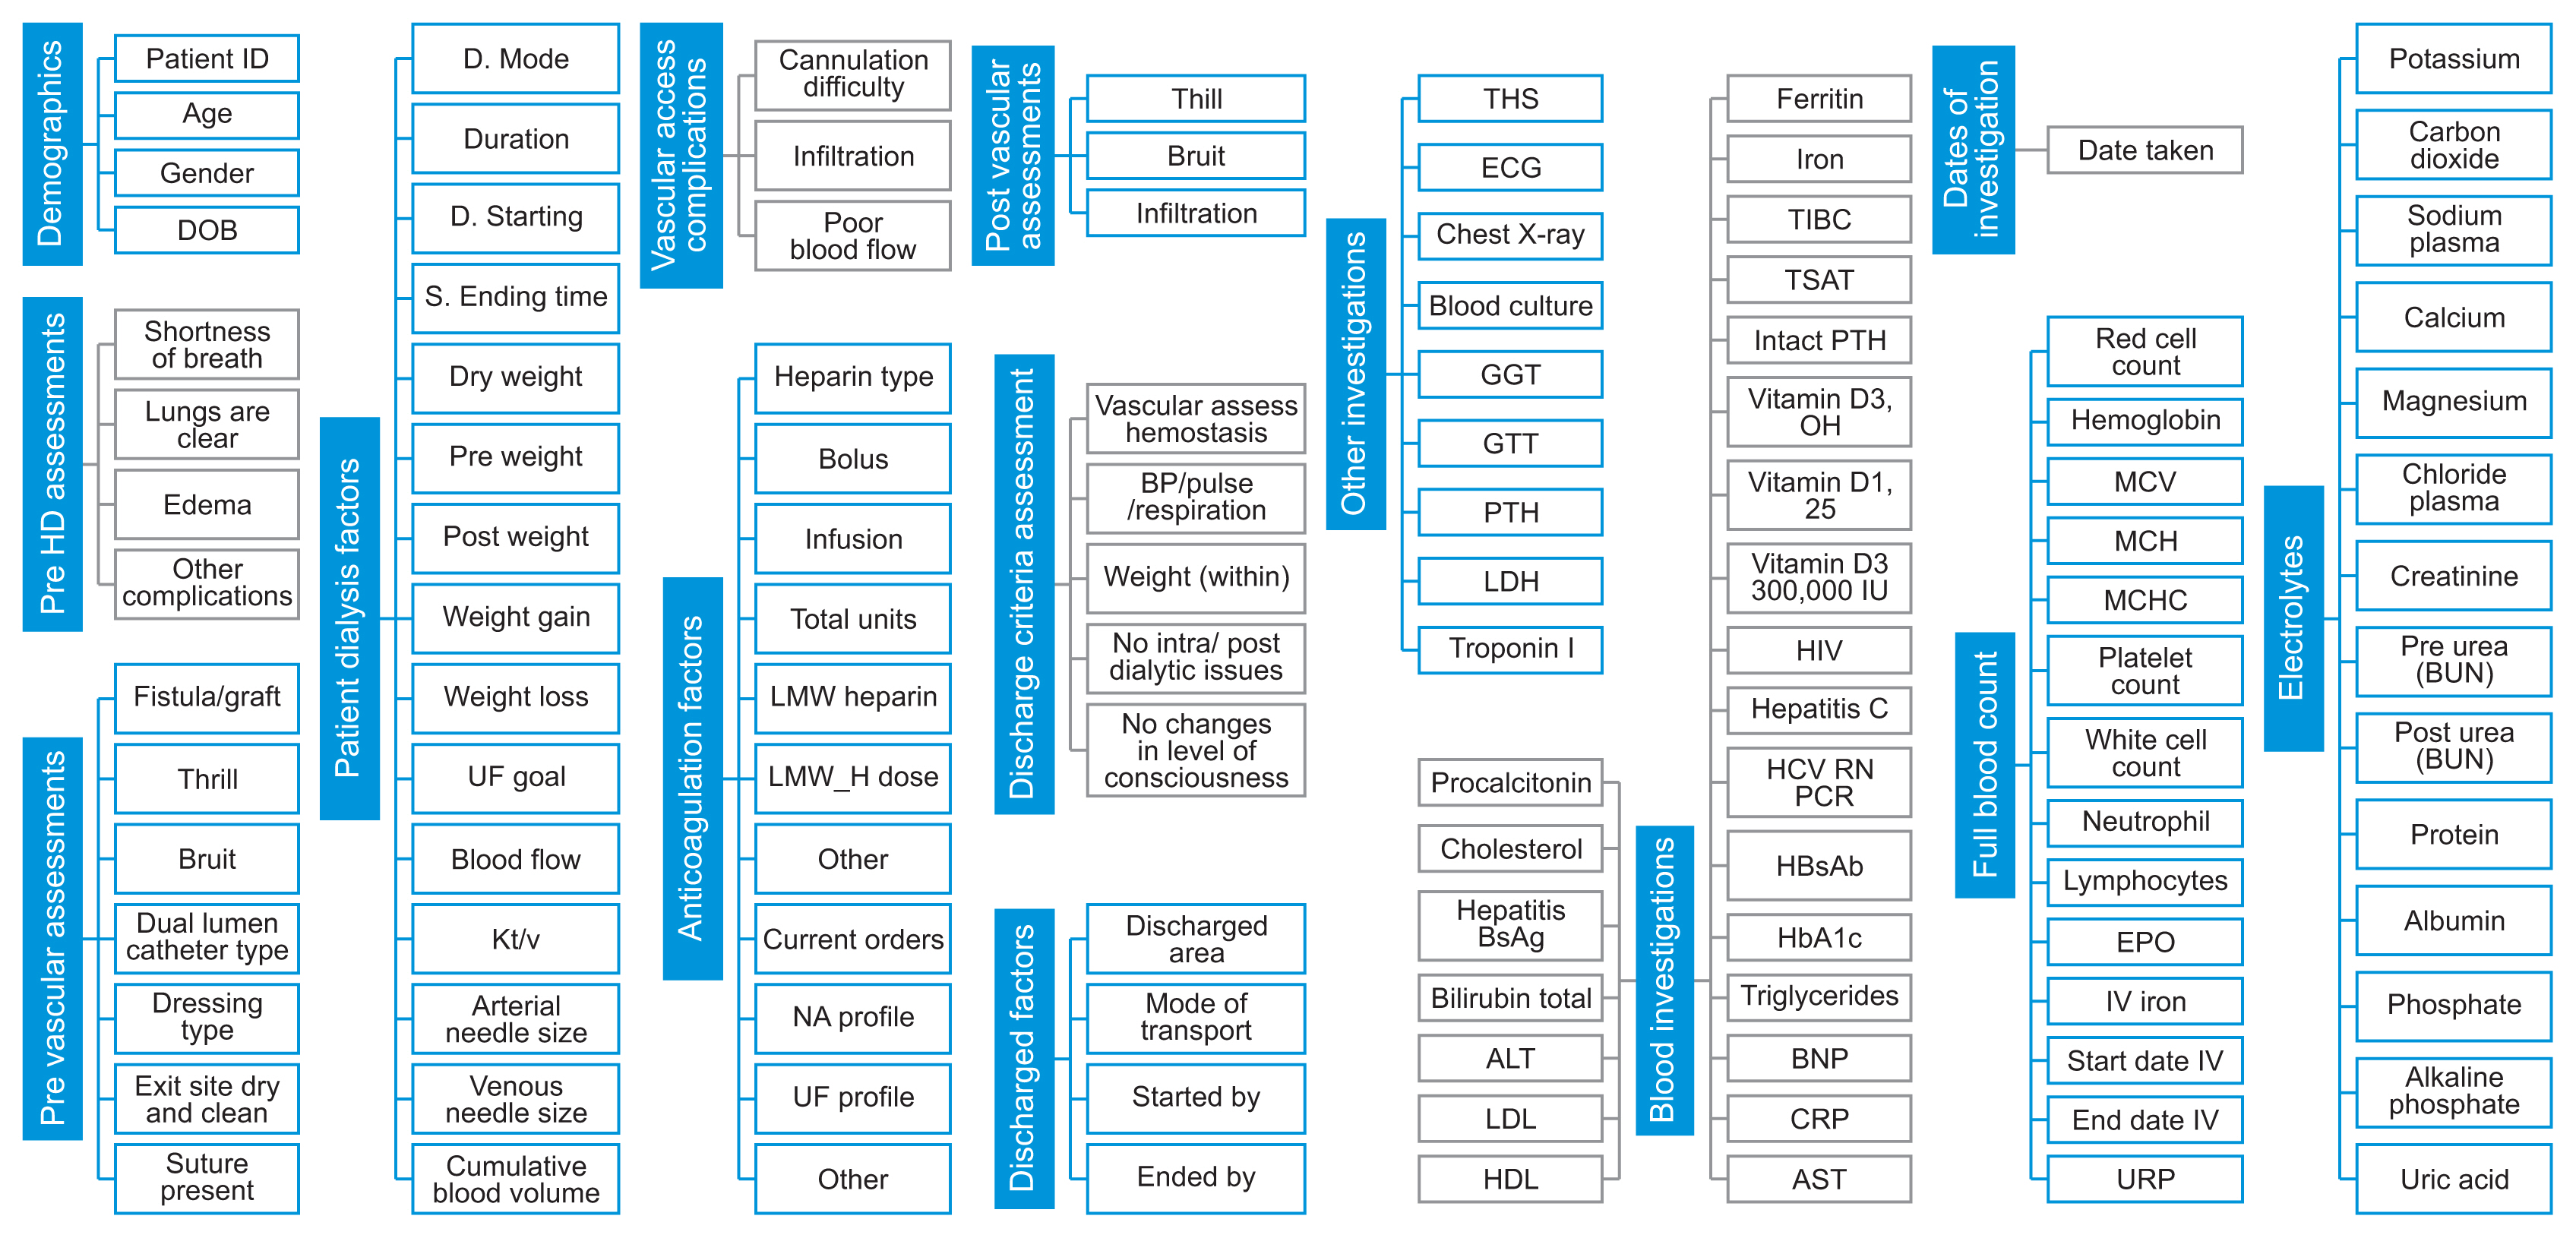
With the collection of big data, the datasets were restructured. Figure 1 shows the 14 categories and their 117 attributes.
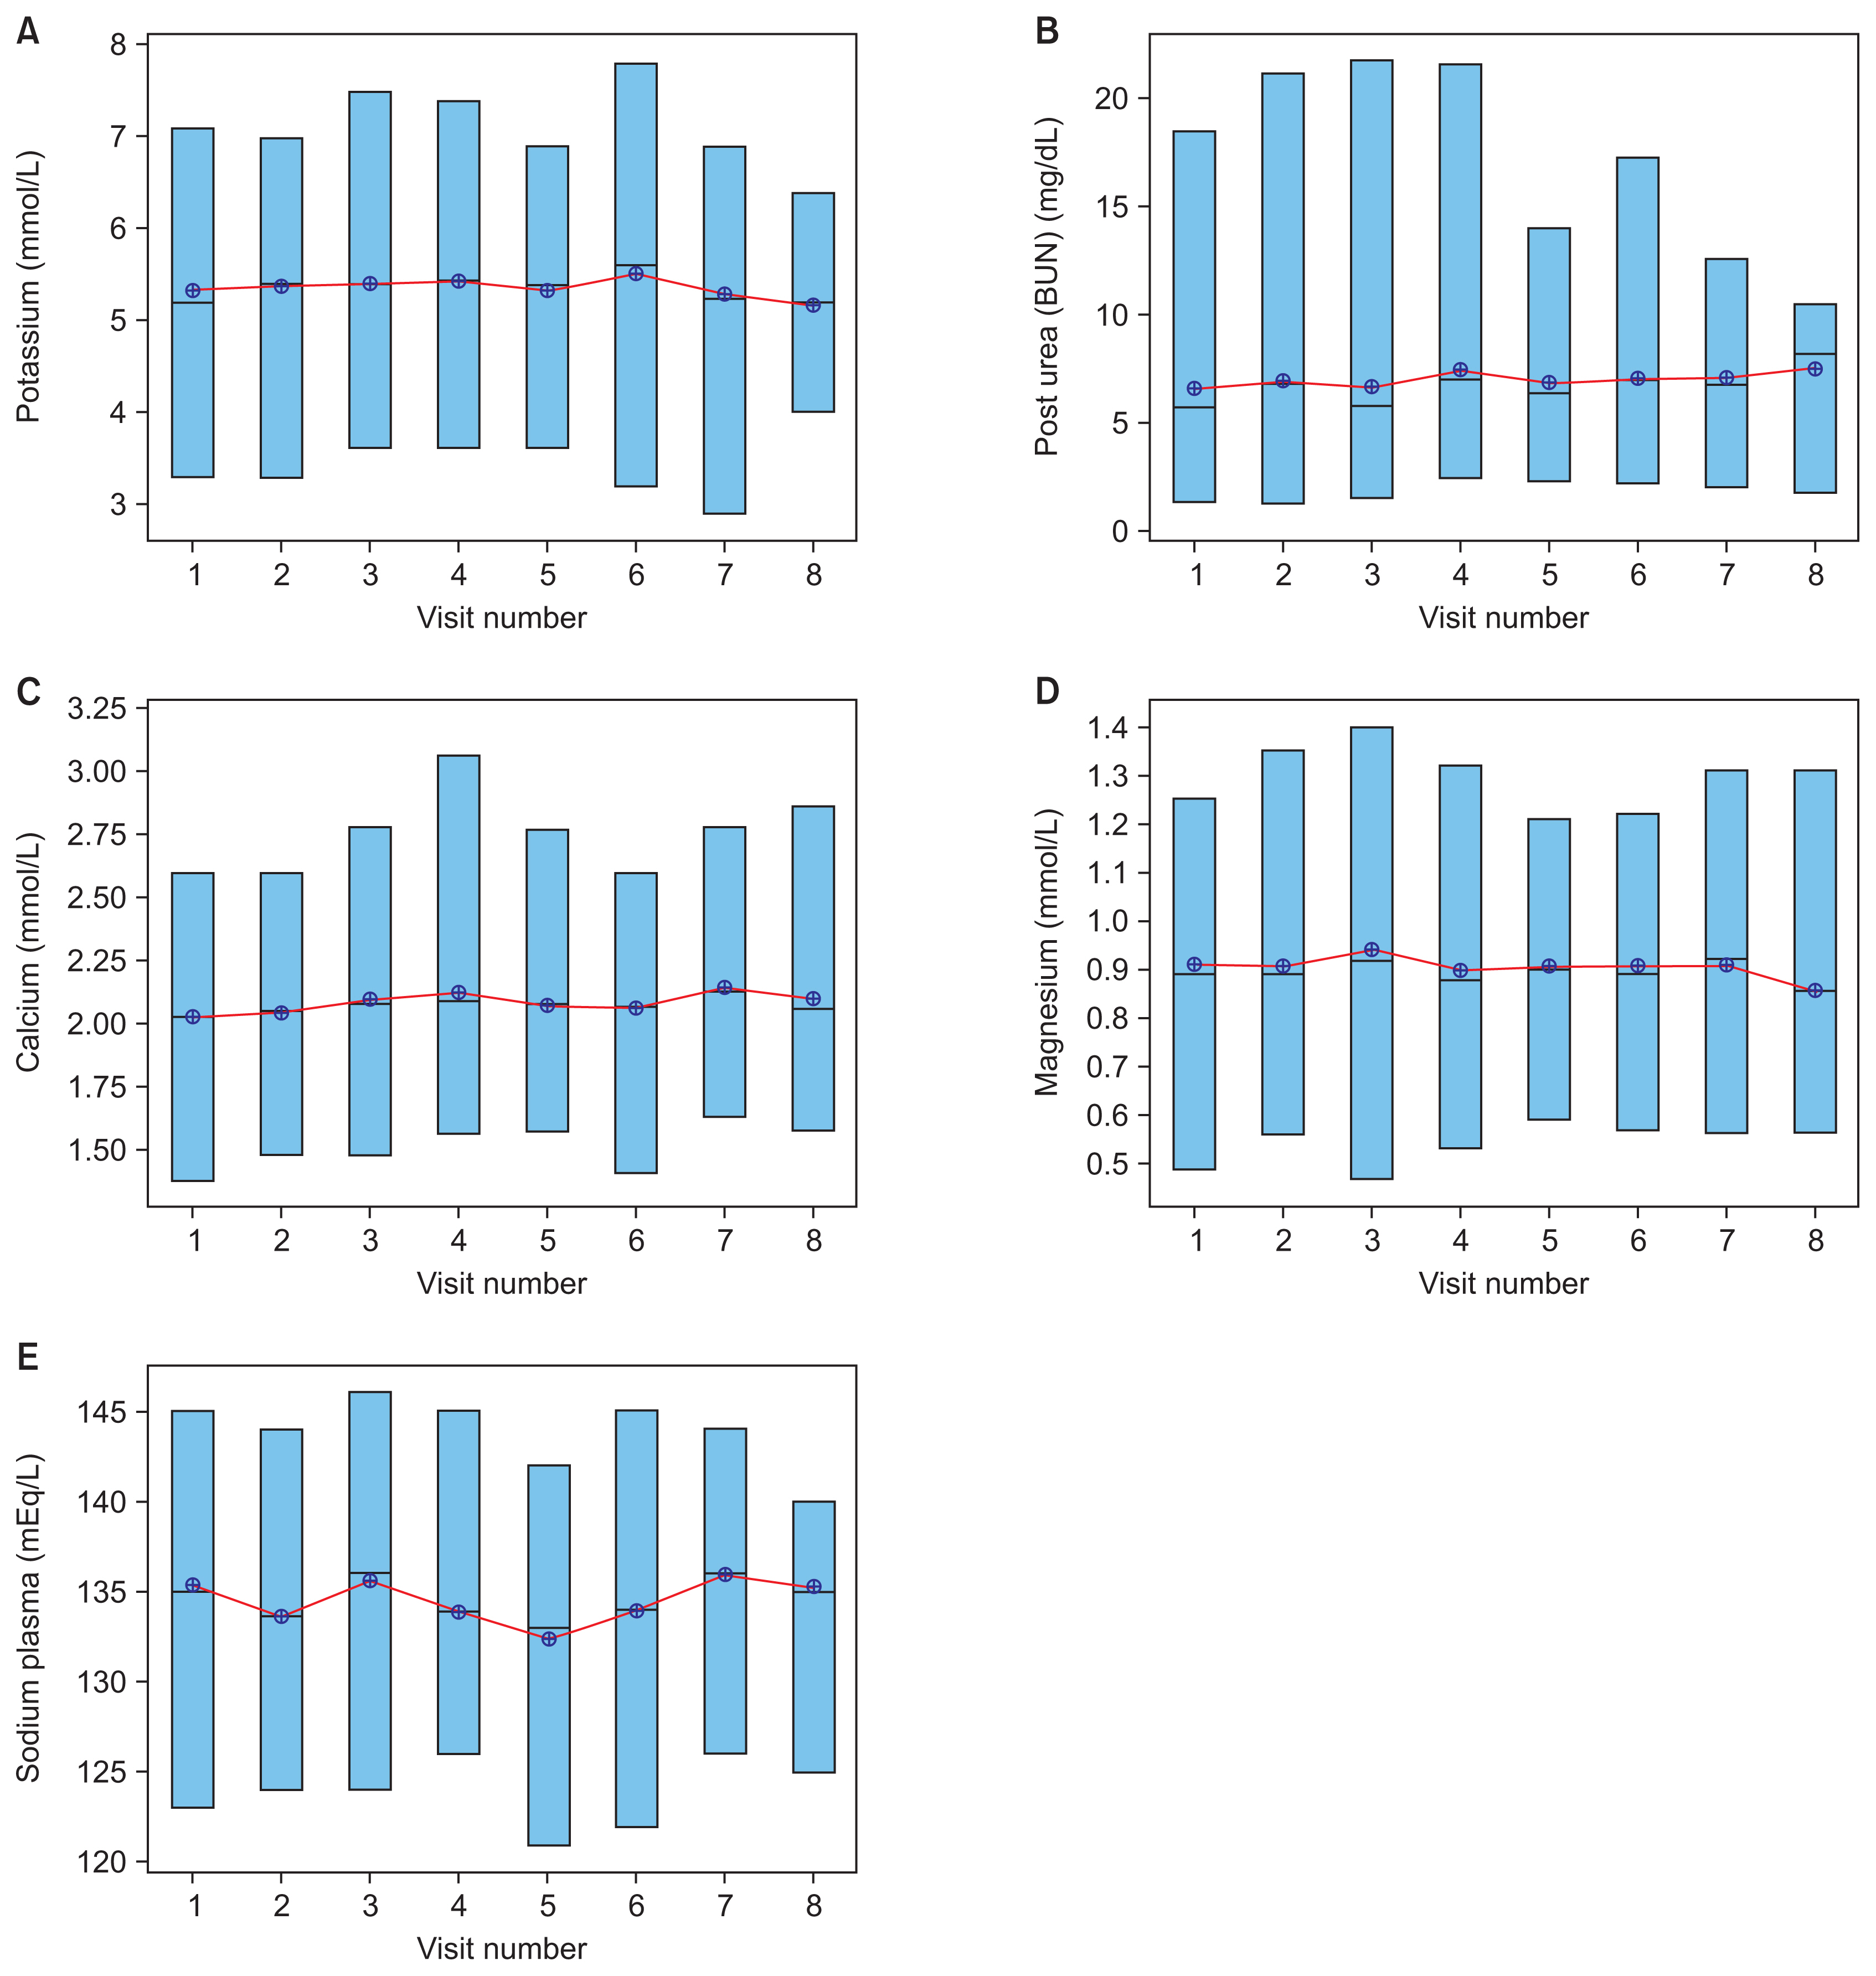
Data for potassium, calcium, plasma sodium, magnesium, and post-dialysis urea were plotted as time series to check variability among patients, as shown in Figure 2. Figure 2A displays the variability profile of potassium throughout patients’ monthly checkups, highlighting the fact that an 8-month course of dialysis had some positive and negative effects on the electrolyte levels of some patients. To further study the causes of high variability in some vital electrolytes, electrolyte trends were visualized using several tools during EDA.
Boxplots of significant electrolytes were created as the first EDA approach, shown in Figure 3. Each box represents the range of the particular electrolyte for each of the 45 dialysis patients upon their monthly dialysis checkups. Within each electrolyte profile plot, the mean of every patient is shown as dark blue circles, while the electrolyte minimum and maximum ranges are plotted as dotted horizontal red lines. Black lines connect the mean from one dialysis patient to another to further emphasize variability.
The boxplots demonstrated significant variability of electrolyte levels from patient to patient, as is also seen in Figure 2. The largest degrees of variability appeared in the plasma sodium and potassium electrolyte profiles. Patients’ electrolyte levels were shown to have fluctuated, which is a serious concern from a medical point of view, and it seemed possible that significant variations could be due to the non-removal of potassium during dialysis sessions. However, the plasma sodium profile added insight, since changes in sodium levels have an inverse effect on potassium levels. Therefore, the decline in plasma sodium levels in Figure 3E corresponds to the increase in blood potassium levels in Figure 3A.
To add to the insights from important electrolytes, a time-lapse study was analyzed to view these electrolytes from the perspective of dialysis sessions over time, shown in Figure 4. The plots represented the connected mean with electrolyte levels on the y-axis and visit numbers along the x-axis. Each box in the plots represents the range of a particular electrolyte for patients receiving dialysis on a monthly basis.
The electrolyte trends of dialysis patients displayed low variability with respect to the time-lapse input. Figure 3A shows high variability in potassium levels, but Figure 4A demonstrates very low variability. Because Figures 3 and 4 show consistent variability in the electrolyte distributions for different patients and visits, the time-lapse electrolyte results further support the inference that dialysis was indeed working well, with proper dialysate solutions and dialysis sessions. Hence, the analysis showed that other factors caused the high variability of levels of vital electrolytes in patients. The four predictive models mentioned earlier were used to interpret the causative factors for the data presented in Figure 4.
1. Data Prediction and Interpretation
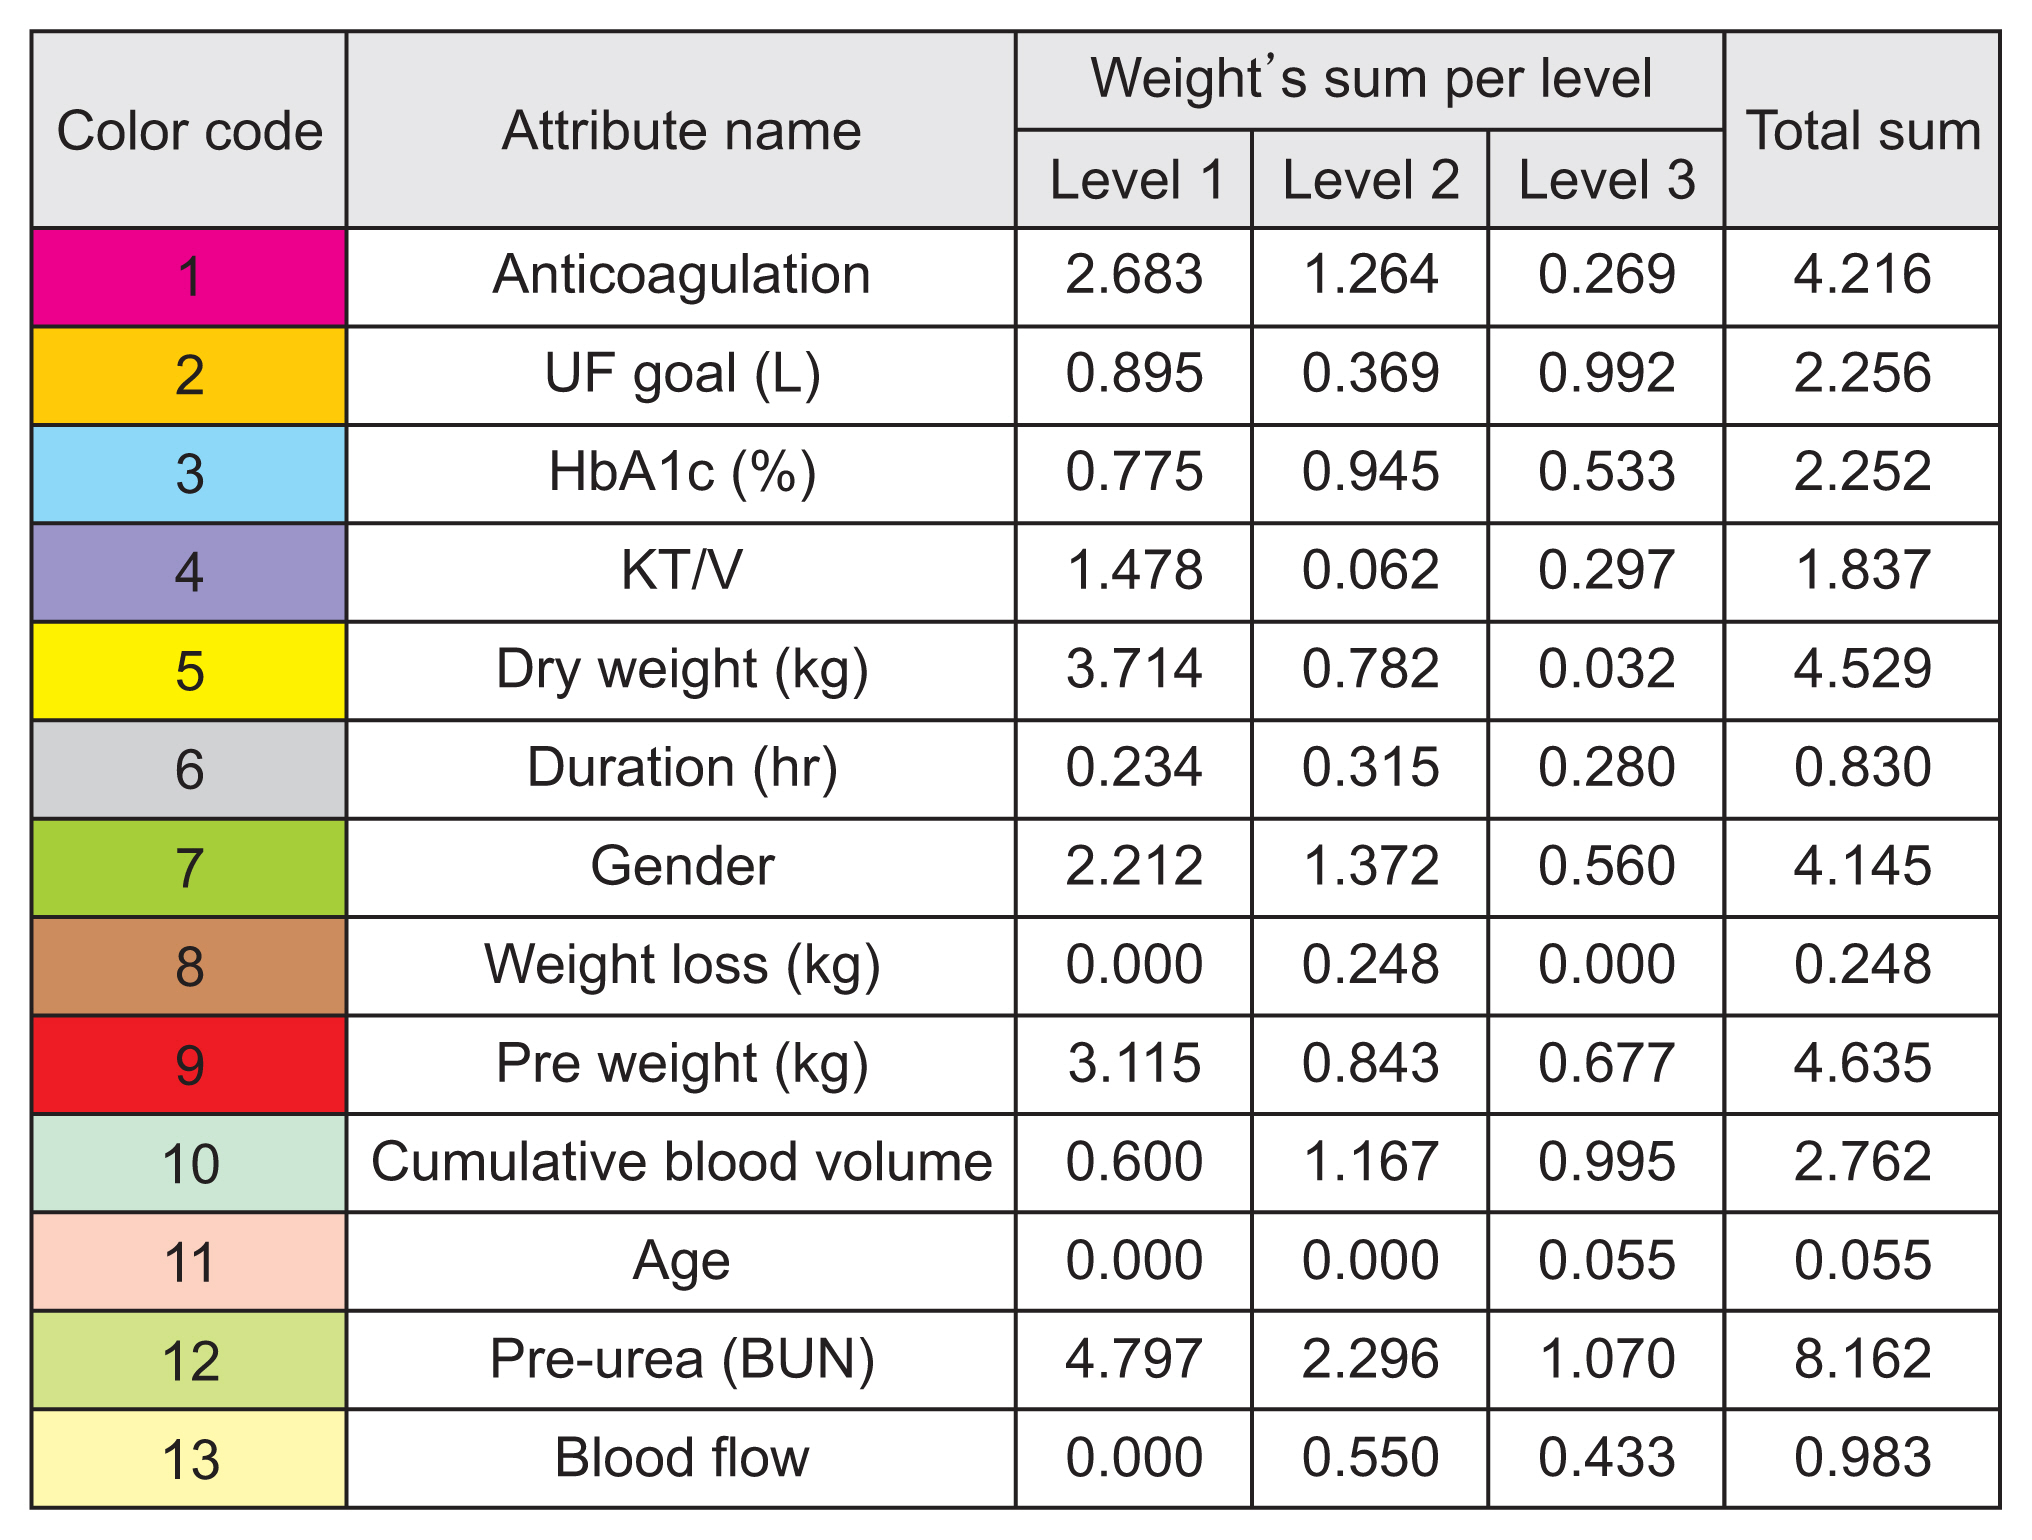
Each of the four models had differently weighted predictors and predicted different electrolyte outcomes. Since the models incorporated predictions of 13 electrolytes with the output of weights, each model’s most important predictor attribute was captured in Figure 5.
From Figure 5, it can be seen that various attributes affected the predictions of certain electrolytes, illustrated as multiple attributes with repeating colors and their corresponding values. Level 1 (L1) defines the most important feature from the model, followed by level 2 (L2), then level 3 (L3). For further statistical details from the illustrations, Figure 6 displays the specific color code for each input attribute to the model as a weighted table for further characterization.
In other words, Figure 6 displays the sums of the weights of the input attributes at three importance levels from the four predictive models. The total sum of the attribute weights was also generated, corresponding to how much weight the attributes showed in these models for one of the top three importance levels from the prediction results. These weights were taken from the predictive model output, with reference to Figure 5.
As a result, the top five input attributes were identified as pre-dialysis blood urea nitrogen (BUN), pre-weight, dry weight, anticoagulation, and sex. Figure 6 indicates pre-dialysis BUN as the most significant attribute, with the highest analytical total weight (8.162) from all models. From a medical standpoint, each patient’s BUN levels are tested monthly before dialysis is administered. The next most significant attributes are pre-weight, dry weight, anticoagulation, and sex, with total analytical weights of 4.635, 4.529, 4.216, and 4.145, respectively.
Hence, our study recommends following the DT model’s decision-making support system because the results encourage physicians to ensure that patients’ pre-dialysis BUN levels are within an acceptable range. To do so, physicians ought to consider each patient’s lifestyle before dialysis treatment because the five most significant attributes are related to lifestyle features. Other variables included in the models (e.g., duration and age) were not significant as predictors.
2. Model Performance
Tables 1 and 2 illustrate the performance of each of the four predictive models as integrated tables. Table 1 displays the performance of the predictive models from the validated and trained output, which used the training dataset, while Table 2 does the same for the tested, finalized model output and the testing dataset.
In our comparison of the models, DT achieved by far the most accurate results, with higher values of R2 and lower values of RMSE for both the training and testing models. For the training output performance in Table 1, DT achieved an average of 0.4649 ± 0.1639 for R2 and an average RMSE of 18.8783 ± 4.74369. For the final tested dataset model performances in Table 2, DT had R2 and RMSE values of 0.4099 and 21.7011, respectively. The highest R2 value in the DT model was 0.752 for alkaline phosphatase, and the lowest RMSE value was 0.096 for magnesium.
IV. Discussion
In this research, a clinical decision-making support system was developed for dialysis patients using data analytics. The results demonstrate the potential of extracting insights from big data to transform healthcare from a traditional symptom-driven practice to precisely personalized medicine.
This study utilized big data from more than 100 dialysis parameters in patients’ records, where critical electrolyte parameters were used to analyze, predict, and provide insights on how to improve a patient’s dialysis dosing. Therefore, electrolyte parameters were investigated with respect to demographic attributes and attributes typical of dialysis patients, including glycated hemoglobin and pre-dialysis BUN values. Vital electrolytes (i.e., magnesium, calcium, sodium, potassium, and post-dialysis BUN) were found to be highly variable in patients, due either to insufficient removal of electrolytes during dialysis sessions or to an inverse correlation with other electrolyte profiles. An example of inverse proportionality involved the higher levels of potassium in patients due to the lower sodium levels. However, it was also demonstrated that the electrolyte levels were consistent over time for each month when a time-lapse view of each electrolyte was analyzed. This clarified that the patients had received appropriate dialysis treatments.
After several types of predictive models (DT, NN, SVM, and LR) were built for further investigation, they predicted electrolyte levels within a range of demographic and vital dialysis parameters. Pre-dialysis BUN, pre-weight, dry weight, anticoagulation, and sex were found to be the five most significant predictive factors. Moreover, the DT model was demonstrated to be the best of the four models we evaluated because it provided a higher average R2 output and lower average RMSE values for electrolytes.
Ultimately, the predictive results achieved the goal of our study in determining important factors for the improvement of patients’ dialysis dosing levels, where the interpretations from predictors verified that the duration and frequency of dialysis were not crucial attributes for determining patients’ important electrolyte levels. Instead, the five most significant attributes were pre-dialysis BUN, pre-weight, dry weight, anticoagulation, and sex, which are related to the lifestyle features of dialysis patients.
Moreover, in clinical practice by nurses or physicians, predictive models can be carried out using multiple patients’ datasets, and the three most important attributes can be noted from the models’ significant levels, which will support decision-making and offer insights from the predictive models’ output. Thus, from our results and an interpretation of the models’ most significant attributes, physicians ought to educate patients about patterns of nutritional intake. This, likewise, provides patients with more accurate dialysis dosing using big data analytics from the growing number of dialysis patients, which will eventually help improve each patient’s quality of life, life expectancy, and well-being, as well as reducing costs, efforts, and time consumption for both patients and physicians.
On that note, this study comprised 45 patients in total, with dialysis sessions recorded from January 2020 to August 2020. In the future, this study could be extended either by analyzing the records of a larger number of patients or by adding temporal data with a history of dialysis earlier than January 2020. This could further improve the predictive models and lead to more reliable results. Other dialysis machine parameters could also be added to the predictive models to determine their correlations with patients’ electrolyte levels, which may support researchers in further investigations.
The limitations of this work include the fact that it was conducted at a single site and the small number of participants. The study’s results need to be validated on a larger scale. Unfortunately, to our knowledge, no previous studies have used ML models to predict electrolyte concentrations, which makes it challenging to validate our models’ performance. Moreover, there is a need for further research on big data analysis, which would validate the application of multidimensional measures and compute adequate dialysis dosing levels for the patient’s treatment. Hence, there is a need to develop a model that aids physicians and clinicians in delivering precise and optimized dialysis treatments through big data analytics.