

I. Introduction
Public and professionals concern over patient safety, adverse healthcare events, and medical errors have been increasing since before the beginning of the new millennium. Lucian Leape, Don Berwick, and others had pioneered research on this field since the 1990s [1] and claimed that if medical errors can be prevented or reduced, enormous life and cost savings could be obtained. There are many ways to improve patient safety using information technology [2], and one of the primary ways for improving safety is improving the error and adverse event detection and reporting systems. Non-punitive adverse event reporting system must be implemented in order to enhance the safety initiatives, the awareness and proactive participation from the members of the community, and the overall quality of healthcare. Although some adverse event reporting system approaches in healthcare industry are automatically enabled, self-reporting is useful as there are some events that can only be identified by an individual who are directly involved in them. However, many problems and barriers exist that make use of such reporting systems insufficient [3]. Wu et al. [3] reported that about 95% of hospitals (valid sample size 327) have implemented an adverse event reporting system in Taiwan; but only 6% of them have a computerized system. Although very large hospitals have implemented a system for self-reporting by healthcare professionals, there still are large gaps between the number of self-reported events and the actual number of these events.
Qualitative studies have identified a number of barriers hindering the development of adverse event reporting culture. Principle among these is the idea of a "blame culture," where the staffs are concerned that they will be personally held responsible for errors, and will receive undue disciplinary measures. Other barriers include: fear of reactions from co-workers; the specific characteristics of these events; and lack of feedback [4]. The culture of healthcare itself has also been highlighted as a significant barrier, with its shared beliefs about collegiality, self-regulation and the inevitability of errors, resulting in ubiquitous discouragement to staff-reporting.
In general, Korea is considered to be at the leading edge of adopting healthcare information systems. One national university hospital had built a complete paperless hospital system by May 2003 and they have operated this system without any difficulties [5]. In addition, many tertiary hospitals have built systems utilizing mobile technology through ubiquitous hospital information systems. Primary care physicians are using computerized clinic management systems and all citizens of Korea receive the medicare system. Thus, all of the medical bills of the hospitals are handled through electronic data interchange.
In contrast, efforts to improve patient's safety through HIS in hospitals are still at an early stage. There was no detailed information on the current state of adverse event reporting systems in Korea, which made it difficult to develop an appropriate solution. Therefore, as a first step toward building patient safety culture, we performed a large-scale survey to assess the current status of adverse event reporting systems. The result will serve as a valuable source for making fair comparison with the international standards and enable collaborative researches on patient safety.
II. Methods
We used the Adverse Event Reporting System (AERS) questionnaire developed by the Agency for Healthcare Research and Quality (AHRQ, Rockville, MD, USA) [6]. The AERS questionnaire includes topics such as whether a hospital collects information on adverse events, what information is collected, who reports occurrences, how their privacy is protected and uses of the data collected. The questionnaire shares the objectives of our research such that it provides a relatively complete picture of the adverse event-reporting systems in hospitals, focuses on the main reporting vehicle for the hospital, describes reporting procedure for the majority of adverse events, and gives a picture of the types of events that are not reported to their systems. Therefore, the AERS survey questionnaire for risk managers was translated into Korean and was used with minor modifications made to improve clarity and data, such as editing to clarify terminology or wording, adding response options to obtain more complete data, and adding open-ended response options. Back translation was done to confirm the correctness of the Korean version. The content validity was checked through the expert group discussion and consensus.
The online version of the questionnaire was distributed by e-mail to all of the hospital risk managers in the country, with the cooperation of the Korean Quality Improvement Nurse Society (KQINS). The e-mails solicited the risk managers' active participation by providing them small incentives and stimulating their motivation of improving the current system. And also the KQINS distributed the official letter and recommended to respond through the Board of Directors network. Data were collected from 14th May until 30th June, 2008. Seventy-two percent responded, and almost all hospitals with the individual Qquality Iimprovement departments responded. Statistical analysis was conducted using SPSS ver. 12.0 (SPSS Inc., Chicago, IL, USA). Descriptive statistics were used to summarize the characteristics of the subjects and the reporting system in each respective hospital.
III. Results
1. General Characteristics of Respondents
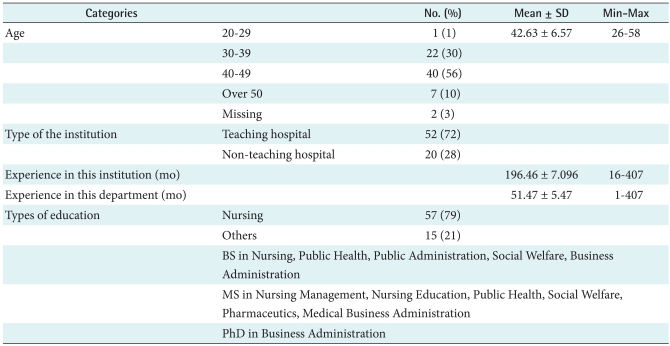
General characteristics are summarized in Table 1. The average age of the subjects was 42.63 (┬▒ 6.57) with the respondent group in their forties being the most prevalent group. Almost two-thirds (72%, n = 52) are working for teaching hospitals. The duration of their experience in the institution ranged from 16 months to 407 months, and the duration of experience in the department ranged from 1 month to 407 months. Seventy-nine percent (n = 57) of the respondents had nursing or other clinical degree, but most of them (99%, n = 71) did not have any degree related to the law and other credentials of risk management (96%, n = 69).
2. System of the Reporting Process
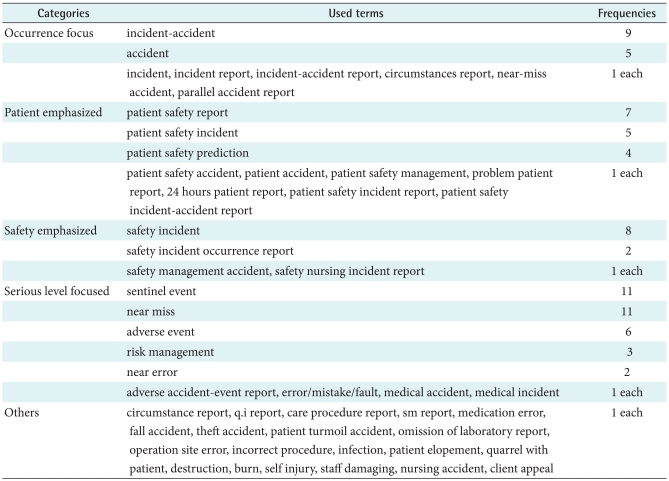
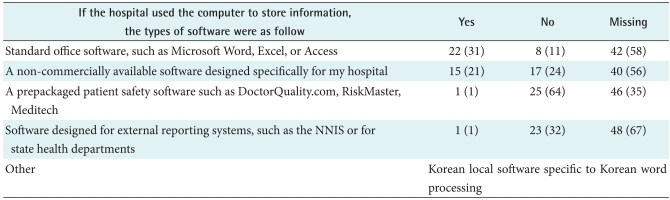
Eighty-five percent (n = 61) of the hospitals collected adverse event information where harm has occurred or might have occurred to a patient during the course of patient care. Terminology used to describe such occurrences in the hospitals are listed below in Table 2. It was revealed that there are subtle variations of terms used to name the occurrences, as there exists no standardized or consensus terms. Furthermore, 79% (n = 57) of the hospitals were using the same terms throughout the hospital, whereas 6% (n = 4) of them were using different terms in different departments, which reveal the lack of standardization of terminology, even within individual institution. The sources of information from which the respondents learned about these occurrences are summarized in Table 3. The most frequent source of information was the "occurrence form" (89%, n = 64), and followed by committee meeting (67%, n = 48), direct calling (61%, n = 44) and patient's notification (61%, n = 44). Eighty-one percent (81%, n = 58) of the hospitals stored the information on occurrences in a central dedicated database. Those without central database (18%, n = 13) stored the information in various ways such as with the concerned party, nursing department, and administrative department. However, there were cases where the location of database is unknown or secrete. Only 48% of the case stored the information on paper, 44% used both paper and computer, and 8% used only computer. The types of software used to store information are shown in Table 4. The most frequently used software is standard office software, whereas adoption rate of prepackaged patient safety software (3%, n = 1) and software designed for external reporting systems (3%, n = 1) were extremely low.
Eighty-nine percent of the hospitals allowed descriptive accounts to report the occurrences. Most hospitals collected information regarding the time of occurrence (99%, n = 71), place of occurrence (97%, n = 70), patient's age/sex/demographic information (97%, n = 70), whereas collection rate of information about the personnel involved (67%, n = 48) and contributing factors (78%, n = 56) were comparatively low (Table 5).
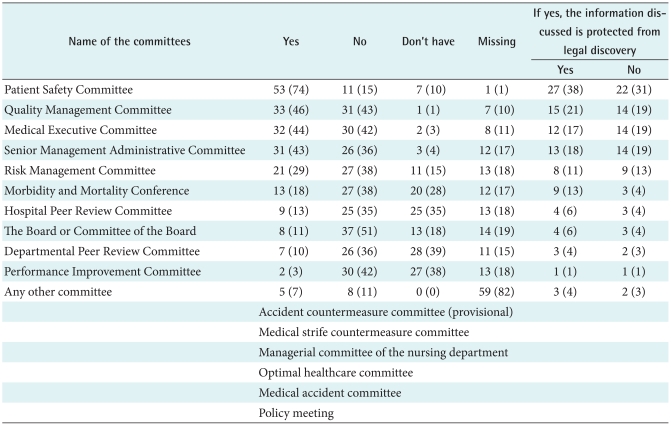
About half of the hospitals (46%, n = 33) collected the severity of harm which occurred to the patient, however not all of them mentioned the levels of severity. Only 28 (39%) hospitals described the levels of severity and the number of hospitals using 2 levels were 24%, 3 levels 21%, 4 levels 15%, 3 levels 9% and other using 1, 6, 7, 8, 9 levels were one hospital each. Regarding the question whether the information in the hospital's current reporting system is protected from legal discovery, 49% (n = 35) answered yes and another 49% (n = 35) hospitals said no. The concerned committees where the occurrences are discussed are summarized in Table 6. Majority of the committee was the Patient Safety Committee (74%, n = 53) and Quality Management Committee (46%, n = 33), Medical Executive Committee (44%, n = 32), Senior Management Administrative Committee (43%, n = 31) followed.
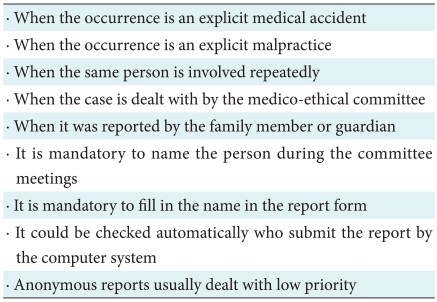
The origin of staff group that reports adverse events varied. The nursing staff was the group with highest report number, followed by the technicians, pharmacy staff, administrative staff and physician group (Figure 1). Only 6% (n = 4) of the hospitals answered that physicians who were not employed but working in the hospital reported occurrences to the reporting system, 22% (n = 16) of them answered the unemployed physicians did not report occurrences, and 21% (n = 15) answered they didn't know. Over half of the hospitals (51%, n = 37) employed all physicians, where they had no physicians working in the hospital without explicit employment position. Only 20% (n = 14) of the hospitals answered that other individuals who were not employed but working in the hospital reported occurrences to the reporting system, 26% (n = 19) of them answered the unemployed individuals did not report occurrences, and 21% (n = 15) answered they didn't know. In other case, 33% (n = 24) of the hospitals didn't have such type of employees. Seventy-five percent (n = 54) of the hospitals did not allow individuals to report occurrences without identifying themselves, but on the contrary, 14% (n = 10) of them allowed in all cases, 11% (n = 8) in some cases. In the case of which reporter identified him or herself, 50% (n = 36) of the hospitals protected the person's identity, 30% (n = 22) did not, and 17% (n = 12) of them only protected in some cases (3%, 2 cases were missing). The cases when the reporter's identity was not protected are listed in Table 7.
Most of the hospitals (82%, n = 60) didn't keep the report of occurrences in an employee's personnel file, whereas 5% (n = 4) of the hospitals kept all the cases, and 11% (n = 8) of them kept in some cases. The types of report kept in an employee file were as follows; involved in cases where the patient was harmed such as by transfusion error or medication error; involved in the similar cases repeatedly; resulted in the organizational loss; resulted in the open case; and resulted in the official reprimand.
Only 54% (n = 39) of the hospitals had an organized patent safety program that managed or coordinated all of the hospital's patent safety activities, and 46% (n = 33) of them didn't have. For the current reporting system, only one hospital started with patient safety program first and then moved to the reporting system, and 33% (n = 24) of the hospitals started with reporting system first. Other 18% (n = 13) of the hospitals started with both patient safety program and reporting system concurrently, and one hospital had no reporting system at all.
3. Trend of the Reporting
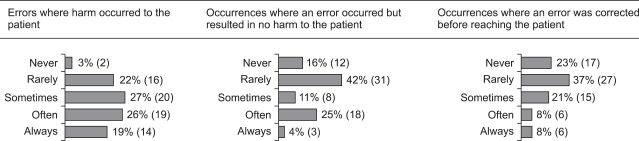
It was found that the trend of the reporting frequency was somewhat different according to the severity of the occurrences. When the result of the occurrence was explicit, it was reported more. However, if the occurrence was resulted in no harm or corrected before reaching the patient, it was reported less (Figure 2). The most frequent reason why errors were not reported was the fear of individuals being involved (Table 8). It was 50% (n = 36) that individuals did not know these errors should be reported, and about half (47%, n = 34) of the individuals did not even know the methods of reporting. About one third of the individuals (33%, n = 24) did not even realize an error had occurred, and about one fourth of the individuals (24%, n = 17) did not have access to the reporting mechanism.
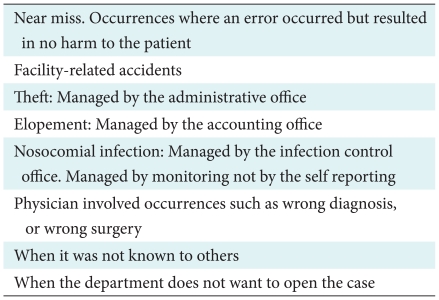
Fifty-five percent (n = 40) of the hospitals reported nosocomial infections to the reporting system, and 42% (n = 30) did not report nosocomial infection. Thirty-eight percent (n = 28) of the hospitals reported all the occurrences to the hospitals' reporting system, and 57% (n = 41) hospitals did not. The occurrences which were not reported are listed in Table 9. Thirty-seven hospitals (n = 51%) estimated that 0-30% of the occurrences in the reporting system resulted in patient harm, 3 hospitals (n = 4%) estimated 31-60%, 6 hospitals (8%) estimated 61-100% and other 36% (n = 26) of the hospitals didn't answer the questions.
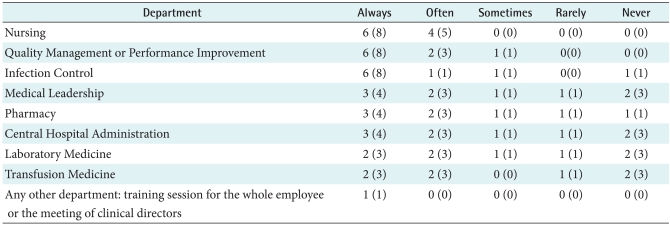
Most hospitals (74%, n = 54) allowed department of risk management to receive reports of occurrences from all areas or departments, but in some hospitals (23%, n = 17) they didn't because there was no such department. The areas or departments where the department of risk management couldn't receive the reports of occurrences were pharmacy and medical department. The only department that ran the risk management and reporting systematically was nursing department. The frequency of report received from different departments is summarized in Table 10.
4. Utilization of the Reporting Data
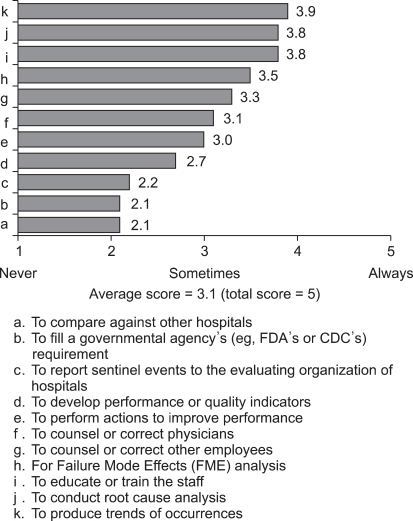
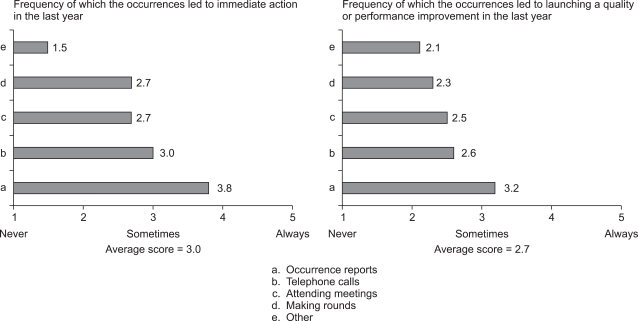
The most frequent use of data was to produce trends of occurrences, to conduct root cause analysis and to educate or train the staff. The least use of data was to compare against other hospitals, to fill a governmental agency's requirement or to report sentinel events to the evaluating organization of hospitals as there was no such organization that run on a regular basis in Korea (Figure 3). The results after the occurrences are summarized in Figure 4. The most frequent contributing factor that led to the immediate action or to launch a quality/performance improvement was the occurrence reports followed by telephone calls and/or attending meetings. The least contributing factor was making rounds.
Most of the hospitals (85%, n = 61) produced reports of their occurrence data, and in this case, 5% (n = 4) produced weekly, 26% (n = 19) monthly, 30% (n = 22) quarterly, 12% (n = 9) yearly and other 8% (n = 6) of the hospitals produced twice a year or if required. Most of the hospitals (68%, n = 49) did not distribute any occurrence reports within the hospital, but on the other hand some hospitals did (14%, n= 10). In the case of which the hospital distributed reports to the relevant department, 8% (n = 6) of the hospitals needed less than one week to distribute, and 5% (n = 4) of them needed over 2 weeks to distribute the report.
IV. Discussion
Based on the result of this research, several major topics are raised with regards to the patient safety problems and the solutions.
First problem is that there is no standardized report protocol. It was found that there are no standard terms used for describing the patient safety related matters even within a single institution. This point is argued in the Chang's study, where they stress the importance of the common language for the improvement of the situation [7]. Lack of such common language will cause communication error that will result in the low efficiency of the resolution for the problems and system improvement. It will be mandatory to develop the standardized communication system for the patient safety issue to lower the occurrences. This similar situation applies to anonymous reports. It varies from the sentinel event to near miss, and equipment error etc, which means that there is no consensus, common understanding and criteria to report, communicate, or measure the current situation of patient safety problems in hospitals.
Second problem is the paucity of information. There is not enough information in quantity and quality, and the types of information collected the least frequently by reporting system are; contributing factors, administrative follow-up action and any action taken after the occurrences. This implies that there are no in-depth information to follow-up the cause and effect of the occurrence, and the information necessary to resolve the root-cause to improve the system of the hospitals is not available. This goes directly against the point raised by Rex et al. [8] regarding the importance of the wealth of information to conduct the root cause analysis.
Third problem is that there is no established protection procedure. Currently, there is no protection or anonymity safeguard for the reporters or individuals involved in the occurrence. Seventy five percent (n = 54) of the hospitals do not allow individuals to report occurrences without identifying themselves. In the case of which reporter identifies himself or herself, only about 50% of the hospitals protect the person's identity. Considering that the most frequent reason why errors are not reported is the fear of individuals being involved, this is very discouraging. Besides, the percentage of information discussed in committee protected from legal discovery was very low. This means that it is very hard to open the information to solve the problem proactively, and there exists fear and anxiety among the individuals involved in the occurrences that prohibit improving the situation. Considering only the specialty-based, voluntary, and anonymous reporting by health care professionals identified a broad range of medical errors [9], it needs more proactive solution to protect the anonymity of the reporter.
The fourth but not the least of the problems is mindlessness and indifference of the people working in the hospital. It is almost over 50% that individuals do not know these errors should be reported, and about half of the individuals do not even know reporting protocol. About one third of the individuals do not even realize an error has occurred, and about a quarter of the individuals do not have access to the reporting mechanism. This means that there is no systematic approach for improving the current problematic status.
It was revealed that the nursing staff is the group with highest reporting number for adverse occurrences, whereas physician group is far behind in the list. Also, the only department that runs the risk management and systematic reporting is nursing department. This can be the main reason that the reporting system does not operate in as efficiently as possible, because physicians and surgeons who may be the center of problems are not actively reporting adverse occurrences. As was noted in one research, requiring physician board certification, physician hospital privileges, or office accreditation is not likely to reduce office adverse events. For example, restrictions on dilute local anesthesia for liposuction would not reduce adverse events and could increase adverse events if patients are shifted to riskier approaches [10]. State and/or national legislation establishing adverse event reporting systems and the change of the institutional cultures should be supported.
It is absolutely imperative to consider the situation, develop appropriate solutions, encourage proactive involvement from healthcare community and change the culture for protecting the privacy of reporters and individuals involved in adverse occurrences. In USA, UK, Canada and Australia, several measures for ensuring patient safety such as national institutions, national reporting systems and legislations for the patient safety exist. To cite one example in Taiwan, their implementation of adverse event reporting systems has occurred in two stages. In the first stage, the Taiwan Joint Commission on Hospital Accreditation under the Department of Health launched a project to develop and promote a web-based reporting system for hospitals to gather information about adverse events or errors occurring inside the hospital by self-reporting. In the second stage, another project was launched to establish a national information infrastructure to integrate individual reporting systems into a national adverse event reporting system in 2004 [3]. Hospitals and government all around the globe which had not set in place of the adverse event reporting systems and which has no systematic or national approaches could benchmark the cases to resolve the patient safety problems for the time being. As medical industry is considering the global medical tourism, it is mandatory for them to prove that they provide very safe medical system and high quality as well.
The limitation of this study was that it could only give the statistical summary of the current status. To provide the solutions for the problems, it needs to be studied using qualitative methodologies by interviewing the front line practitioners in person and to analyze the phenomena in detail. The authors propose that variable methods should be sought and the methodological triangulation should be adopted to get profound understanding about the patient safety reporting system related phenomena.
It was repeatedly pointed out that national legislation establishing adverse event reporting systems should be supported and mandated to report all the patient safety related occurrences of not only sentinel events but also near misses. There are certain critical elements necessary for reporting systems' success [11]. These critical elements include making the system legally required, with protection from discovery; developing the system collaboratively, including all stakeholders in the system's design and implementation; clear and objective definitions of reporting criteria as a basis for collecting accurate and consistent data; ongoing training and educational support for system users; and having a stakeholder advisory group for ongoing assessment and recommendations, ensuring the system's relevance and viability. Other elements vital to the success include having a secure Webbased system and ensuring that adequate resources and supports are dedicated to operating and maintaining the system. Ultimately, the success of the system also requires that users receive feedback regarding their own performance. It must be possible to analyze data at both the facility and nationwide levels, incorporating dissemination of lessons learned. And also, no standard classification for patient safety was existed previously, Korean version of ICPS can be used and adopted as a standards for the successful implementation of the system [12]. We hope that this kind of efforts and initiatives serve as the global standard for improving the quality of healthcare.