

I. Introduction
Image segmentation enables the extraction of certain organs from clinical diagnostic images and provides important information/data used in the evaluation of secondary diagnoses used for surgeries. This provides virtual information on target organs without directly dissecting patients' bodies [1,2]. Image segmentation, which results in two-dimensional images, is a technology used to accurately select only target organs and to quantitatively analyze these organs through 3D modeling. However, inaccurate image segmentation generates considerable errors in the final results of the diagnosis, making it difficult to trust the results as secondary data for diagnoses and surgeries.
Meanwhile, in clinics, as the dependency of individual medical devices on 3D imaging increases, demands for the reconstruction of the 2D images of those image devices, such as magnetic resonance image (MRI) devices, computed tomography (CT) devices and sonography devices, into 3D images rapidly increase as well [3].
The most important element of 3D image reconstruction is image segmentation in 2D images, which can be done using various methods such as edge detection, threshold segmentation and area growth [4,5]. The segmentation method used in clinics for 3D images is thresholding, which involves an inconvenient condition in which unnecessary volumes must be manually removed. Therefore, subjectivity is involved in this method depending on the skillfulness of the operators in clinics. In addition, although thresholding is advantageous in that it defines an appropriate threshold to show only the information within the set value, it is disadvantageous in that all areas with the same intensity are shown as having the same volume and thresholds themselves, thus causing volume losses. Therefore, since organs in images have diverse shapes, textures, etc., it is very difficult to find a typical solution.
The active contour model proposed by Kassn [6] and Xu and Prince [7] has been attracting the attention of many researchers. The active contour model is a method to minimize the energy function consisting of an external force calculated from image data and an internal force defined as curves or surfaces, which are the initial contours that refer to those curves or surfaces that change their shapes on their own. The external force is a force defined as enabling initial contours to change variable models into the shapes of objects in the images.
Xu and Prince [7] proposed a snake using gradient vector flows (GVF) as a new external force.This is a method that uses the GVF as a new external force by introducing a vector diffusion equation in order to diffuse the gradient of the edge map extracted from the images. The GVF snake diffused the external force that had existed only at the edge and in its surroundings to entire areas, thereby enabling the snake to progress even in flat areas where no edge existed. Through this process, the problem of setting up initial contours was solved, and the problem of external forces occurring only perpendicularly to the direction of the progression of the snake at U-shaped edges could also be solved. However, this is not a fundamental method for improvement of continuous automatic chest wall segmentations in CT images, and the active contour models still cannot normally converge or progress from their positions if default values are partially included in or positioned near other organs. In addition, if clinical operators set up new default values every time results are produced, the results may show different target organs depending on centrality. Therefore, automatic calculations of default values that are suitable to desired organs are necessary [8,9].
Whereas existing active contour models are manual methods, and though they have difficulties in continuously segmenting multiple images automatically, the method to be developed in this study will automatically calculate those default values that are maximally close to the contours of target organs and then store the calculated default values. In addition, every time a new patient's images are inputted for the same area, the deformation of the active contour model will occur based on the automatically calculated and stored default values. Thus, the inconvenience of operators will be eliminated, and the possibility for resulting images to be produced differently will be reduced.
Since the shapes of human bodies are almost the same in general, if an appropriate number of images are learnt, experiments with new images will not require more than the learnt area. As for the order of implementation, information on the shapes of organs will be learnt first, mean shapes will be obtained from the learnt objects in order to use the mean shapes as default values of the active contour models, and then the final contours will be obtained through the convergence of active contour models.
II. Methods
A computer with a Pentium(R) D CPU 3.40 GHz/2.0 GB RAM was used for this study, and Matlab ver. 7.4 (R2007a release, MathWorks Inc., USA) was used for analyses and implementation. As experimental images, 512 × 512 × 16 chest CT images obtained from Light speed pro16 (GE medical system, USA) were used, and the parameters used to obtain the images were as follows: slice thickness of 2.5 mm, DFOV 360 mm, a voltage of 120 kVp and a tube current of 297 mA. In the text, problems in the calculation of the default values of the GVF algorithm were analyzed, mean shapes were proposed for automatic default value calculations and the characteristics of the mean shapes were evaluated using synthetic images to test the performance of the mean shapes. For the learning, 20 synthetic images of different shapes were used, and 30 reference points were used for each image. Then, five training sets and 30 reference points per training set were used to test the ability for image segmentation in actual CT images.
1. Snake Algorithm of Image Segmentation
The snake of traditional image segmentation methods begins the transformation defined by the default values that are designated by the user and actively transforms initial contours in the direction of minimizing energy functions with the effects of the external energy induced by the image itself and the internal energy within the snake curve to find out the final contour [6,10,11].

The snake is configured by internal energy and external energy into formulas (1), (2), resulting in formula (3) [12]. In the formula, the initial contour is expressed by X(s) = {x(s), y(s)}, where x(s), y(s) are the x- and y-coordinates of the contour, respectively. X'(s)represents the first-order differentiation of the contour, and X"(s) represents the second-order differentiation. Specific values of α and β, which are weighted, are inputted depending on situations. To find out the solution to formula 3, X(s), which is a function of s, is partially differentiated against time t. Therefore, the solution to formula (2) can be obtained when the value of X(s) is stabilized.

The external energy is developed as shown in formula (4). Also, the 2D Gaussian function has standard deviations. Gσ(x, y) represents the Gaussian function, I(x, y) represents the image and ▽ is the gradient representing (∂x, ∂y). As the sigma value of the Gaussian function increases, the vector field in the image becomes weaker such that when the snake conducts a differential operation, the results of the operation do not fall into local minimums, and convergence is smoothly achieved. Therefore, it can be said that the ability to attract the snake will eventually become larger.
2. GVF Algorithm for Image Segmentation
Unlike early snake methods, the GVF can form vectors that are diffused toward the edge even in areas with no edge information. It uses formula (5) in place of formula (4) in traditional methods.

To achieve the minimization of energy functions, the vector field v(x, y) = [u(x,y), v(x,y)] that satisfies E2Ext(x,y) = v(x,y) is used. Therefore, in the GVF, the modified method in formula (5) is used as the external energy, where f represents the edge map and differentiates image I(x, y) and ▽fis the gradient of the edge map (7). uis a weighted value that is involved in determining the degree of the diffusion of the vector field.
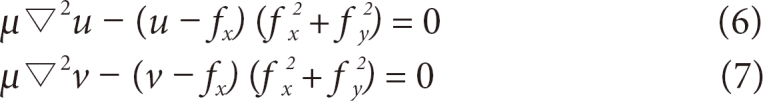
Based on the solution of Euler's equation using differential and integral calculus with permutation, the GVF is defined as formulas (6) and (7), and through the iteration of these, u, v will be obtained. Once the external energy has been defined, in areas with no edge information, the external force will be smoothly transformed to diffuse edge information, and in areas with many pieces of edge information, variable contours will be induced. Therefore, the target image necessary for clinical diagnoses can be more precisely segmented compared to traditional snakes.
1) Characteristics of GVF parameters
The GVF can adjust the degree of transformation by using four internal energy parameters. In formula (3), the parameters are α, β, γ, κ (α: elasticity, β: hardness, γ: viscosity, κ: weighted value of external force), and there is the parameter µ and numerical iteration in the formation of the vector field. It is difficult to find the optimum state through combinations of individual parameters, and even if the optimum state is found, the contour is drawn toward organs other than the target image if the default values are not accurate. The parameters obtained from formulas (3) and (5) are described below.
(1) Numerical problem of GVF energy: Next, formula (3) is expressed by formula (8) Euler equation, so it is expressed numerically.

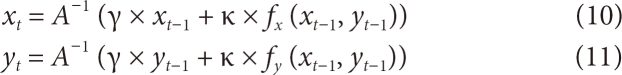
When organized, it is represented by formula (9). When this has been organized into an Amatrix, the entire formula FINT + FEXT= 0 is represented by Ax + fx(x, y) = 0 and Ay + Fy(x, y) = 0. In this case, if weighted values α and β are adjusted, the characteristics of the matrix will be changed. The properties of elasticity and hardness can be adjusted. fx(x, y) is obtained from formula (6) and Fy(x, y), from formula (7). While converging in the scenario of energy minimiza tion through iteration, the coordinates of the contour being changed will be in the form of Ax = b, where xtrepresents the final contour coordinates to be obtained, Ais the internal energy matrix and b is the information obtained from the external energy. Therefore, the state is developed into formulas (10) and (11), and contour coordinates are obtained through iteration. xt-1represents the contour coordinates in the stage before iteration, xt, and the values may be adjusted with the weighted value γ. This shows a phenomenon physically similar to the characteristics of viscosity, and κ is designed to give certain weighted values to the calculated external force.
For these individual parameters, certain values may be used as necessary. Therefore, the characteristics of each parameter necessary for this study are explained below.
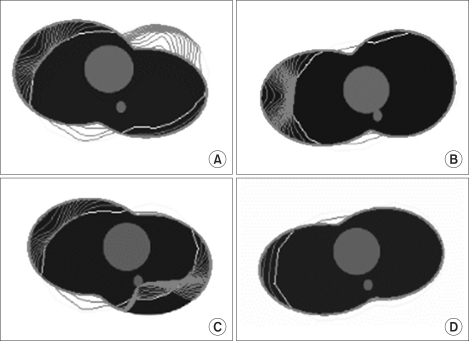
(2) Analysis of the characteristics of parameter µ: µ and numerical iteration are parameters that form vector fields and are involved in diffusion. In the following experiment, the shape of the human chest was virtually constructed, the weighted values of elasticity, hardness, viscosity and external force were kept constant, and µ values were changed while the experiment was conducted.
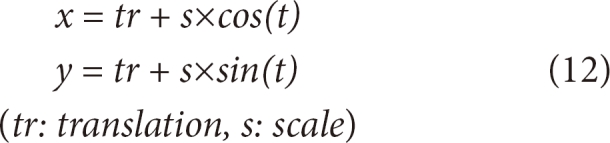
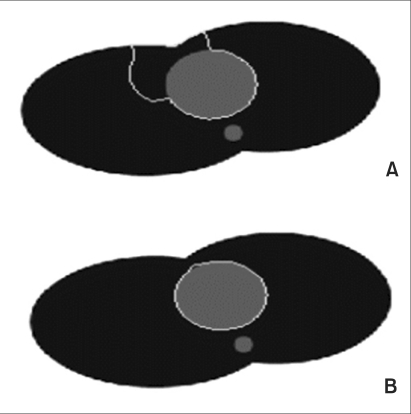
The default value was transformed into a round shape using formula (12), and the experiment was conducted while changing µ values (Figure 1). In the artificial model, the black area represents the lung and the grey area, the heart. On the back of the heart, the aorta was modeled. The red area represents the process of convergence of the edge, and the yellow area represents the default value.
In Figure 1A, a large part of the default value is included in the heart and small parts are included in the chest wall outside the heart. When µ = 0.02, the vector is well-diffused, and thus the edge is pulled toward the heart, while when µ = 0.2, many forces that are pulling the edge toward the lung appear confusingly as shown in Figure 1D. This fact shows that the default value at the boundary between the heart and the lung is strongly pushed toward the lung.
Eventually, as µ becomes larger, the vector field is diffused and becomes larger. And, if the vector field is excessively diffused to become complicated, a balance of power is reached with an edge in another surrounding organ, and the contour for convergence will become unable to progress further between these two edges.
(3) Analysis of the characteristics of parameter alpha: Alpha is involved in the adjustment of elasticity characteristics. The green line is the result finally obtained through the process of transformation after the setup of the default value. When the alpha value decreases, convergence of elasticity will decrease, and if the alpha value increases, elasticity will increase and the vector field will flexibly converge even in large areas (Figure 2). However, if the alpha is too large, the transformation cannot form the optimum image result, and the edge will excessively converge so that no edge can be found.
(4) Analysis of the characteristics of parameters beta, gamma and kappa: Like parameter alpha, parameter beta is a factor that adjusts the characteristics of transformation when the contour converges, and it adjusts the hardness of edge values. However, more constant values should be applied to these values compared to parameter alpha in order to obtain an optimum result. Gamma denotes viscosity and kappa is the weighted value of external force. More constant values should be applied to these variables compared to parameter alpha in order to obtain an optimum result. Even if new experimental images are tested, the range of adjusted values is not greater than that of alpha. Therefore, there is little necessity to adjust these after the default setting. The optimum result should be found out through parameters alpha and µ.
3. Problems in Manually Set Values of GVF
The GVF method by Xu and Prince [7] has a superior ability to implement image segmentation and can be utilized in more applications compared to the traditional method by Kass. However, for the contour to converge on the edge, if any strong edge exists in the vicinity, the GVF cannot form accurate image results. On the contrary, it either cannot progress from the position or is pulled toward another organ. If the default value is set to be closer to the contour, the result of the image segmentation will be better. In this model, the default value should be arbitrarily drawn by the operator, and images should be made over a long time for optimum image segmentation in clinics. However, this leads to increased operator fatigue, and it is difficult to set default values in continuous image experiments to process multiple images. Although the parameter adjustment explained earlier in 2.1 can change an inaccurate final image result of a contour into the desired result, obtaining combinations of parameters takes a long time. Furthermore, even if energy converges as a result of combination, the possibility of determining the contour of the optimum image will be low [8,9,13]. Therefore, the setup of the default value still remains a problem.
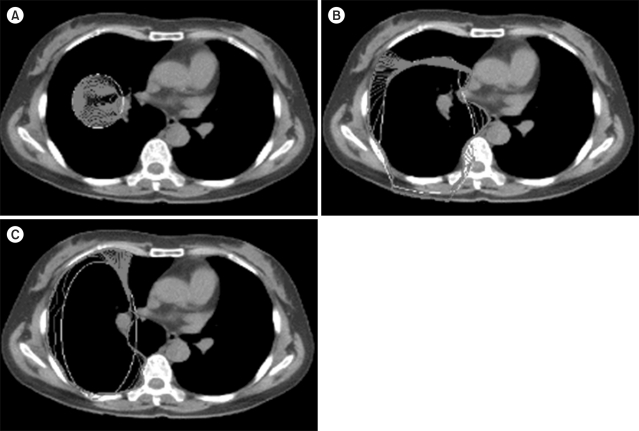
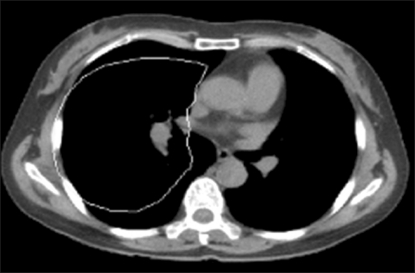
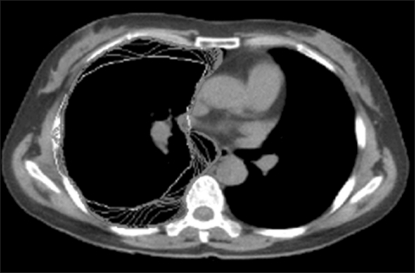
In the chest CT image experiment, an arbitrary default value setting was tested in order to obtain the final contour of the chest wall (Figure 3). The black area represents the lung, the white surrounding areas represent bone and the grey areas represent muscles and tissues. Based on the results of the experiment, Figure 3A shows a case where a default value was set to be smaller than the lung; here, the contour could not progress further as the default value was too small. In Figures 3B and 3C, the default value was set to an oval shape in order to touch the boundary of the lung with the image using formula (8).
Although the default value was set to an oval shape in order to simulate the shape of the lung, the convergence did not progress smoothly, as the default value was partially included in surrounding tissues. Although a certain shape of the default value can be automatically set up as shown in Figures 3B and 3C, the probability of failure will be high if there is any organ in the vicinity. If the user repeatedly segments the chest wall of the lung in a clinic, the probability of failure in obtaining proper diagnostic images will increase. Therefore, it is necessary to calculate the default value in a shape maximally similar to the target organ. In this respect, mean shapes will be presented in the model implemented in this study.
4. Mean Shape
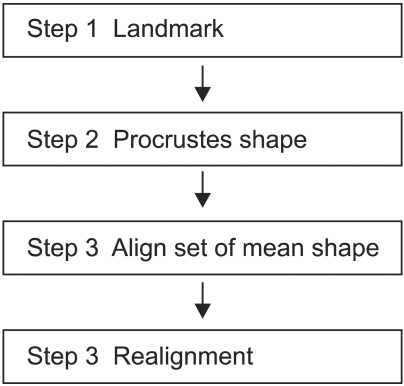
The mean shape processes presented here consist of the following four stages (Figure 4). Stage one is a process to assign landmarks in training sets in order to define the form of the study model. xj, yj coordinate sets are expressed by 2D vectors, and the numbers of landmarks and training sets can be applied diversely depending on the area of application. In images requiring accurate shapes, large numbers of landmarks and samples are necessary. Stage 2 is a process to geometrically align collected landmarks, and not all the coordinates obtained from training sets are consistent. Therefore, aligned coordinates are necessary to analyze the contour of an object. A representative method to align coordinates is procrusted analysis [14], which aligns contours so that the sum of the differences in distances between the average of both the contours and individual contours is minimized. In stage 3, the mean shape of local structure modeling will be calculated. Stage 4 is a process to geometrically align mean images themselves, and it can be conditionally used. In this stage, if images with large distributions and deviations of shapes used for study are inputted as experimental images, the default value will be reset by calculating scales, translations, etc. so that the snake can easily converge.
1) Procrustes shape values of GVF
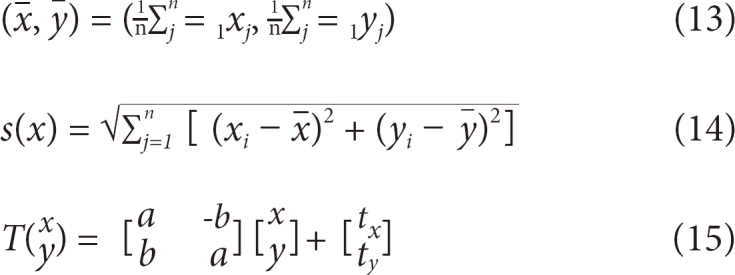
For procrusted distances, a form to correspond one-to-one in a matrix in the form of the least square is required. The central point of each form in stage 1 is calculated by formula (13); all shapes for study are aligned at the central point [15]. Through formulas (14) and (15) in stage 2, all matrixes are made to be of the same size and direction and rotated around the central point in order to optimally align all study models (Figures 5, 6). xj, yj coordinate sets in formula (13) represent the landmarks obtained from the edges of the study images. (x, y) is a set of the mean landmarks used to calculate the scales in formula (14). Therefore, the result will be the condensation of diverse sizes of contours for study into the same size. Formula (15) represents a matrix transformation formula used to rotate the matrixes by angle θ around the origin point, and it serves to rotate all coordinate sets for study in the same direction.
III. Results
1. Result of an Experiment with the Mean Shape Compared to Synthetic Images
Final contours can be obtained from the default value of the mean shape after going through the transformation by active contour models. When necessary, obtained coordinates can be reset to the position of the default value using scales and translations with formula (15).
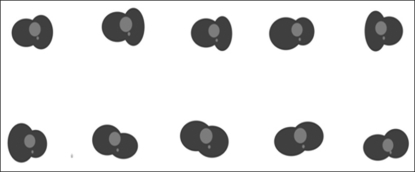
In general, the shapes of human bodies do not have any large geometric deviation. Therefore, even though there are some differences arising from gender and age, the deviations can be sufficiently overcome. From the results, it can be seen that the mean shape was properly applied and the snake converged successfully. In experiments c and d, the default value was reset with the scale (1.2) and translation (-40, -50), as the experiments were conducted with input images exceptionally different from the mean shape (Figure 7).
In experiment c, insufficiently converged areas can be seen at the bottom right-hand side. This is a result of an experiment conducted with the same parameters as those of a and b (Figure 7). If the parameters of c are adjusted, the contour can converge as in the cases of a and b (Figure 7). Also, if only the scale and translation of the mean shape are set, the contour will easily converge. Finding the optimum parameter set takes a long time and is difficult. However, if the mean shape obtained through training is used, the active contour model will converge well, and even the images that are not acceptably convergent can be made so if their scales and translations are reset. If the experimental method shown in Figure 5 is used, the mean shape that has been stored will appear if the images of a new patient are inputted, so the contour of the lung will be calculated through convergence. If a completely different image is inputted, the default value will be reset by changes in the scale and translation as necessary, and the final contour of the target organ in the image will be found.
2. Results of Using Automatic Default Values for the Chest CT Images
To accurately evaluate a chest wall with actual clinical CT images, five study images and 30 landmarks were used. For image segmentation, the default value should be manually determined to be close to the edge of the target organ in the image. However, in the proposed algorithm, a default value close to the contour of the lung is automatically calculated to show a result similar to the shape of the lung (Figure 8). In addition, the results of the experiment show that the snake normally converges beginning from the automatic default value and is calculated along the final contour. Moreover, the most suitable result of image segmentation was formed with the final contour (Figures 9, 10). Therefore, the final contour in the image result can be used as the coordinates necessary for 3D modeling and in quantitative evaluations of the lung.
This is the result of quantitative analyses in which the total number of automatic and manual segmentations and the distributions of time data of the two segmentation methods were compared with each other. Furthermore, manual segmentation was experimented with 10 times by two clinical experts with knowledge in anatomy on the same image to obtain the results (Figure 11; Table 1). The entire time for automatic segmentation is shown to be shorter by around 10 seconds on average, whereas Manual 1, in the 10 identical experiments, shows larger deviations compared to Manual 2. This indicates that the time to calculate results will vary with the concentration of each person who actually segments images. The deviation of the automatic segmentation was 0.774 second, and the deviations of the manual segmentations were 5.104 seconds and 3.627 seconds. Therefore, it is expected that deviations will become larger if large volumes of clinical data are handled. Based on the results of the experiments, the automatic segmentation method can reduce the fatigue of clinical operators and users and enhance their work stability.
IV. Discussion
In this study, a method to automatically calculate default values of lung images was developed in order to provide clinical users with efficient and fast segmented information on lung images. Based on the results of the experiments, it could be seen that the contours could be found more easily with the developed method compared to the manual default values of snakes. Compared to the manual setting, the fatigue of clinical users was reduced and the entire time required was reduced. All the default values should be designated by the operator in the case of manual methods. However, in the case of the method proposed in this study, if only an automatic default value is stored from the mean shape, the default value is automatically retrieved every time an experimental medical image is inputted so that it can be used as the default value. When images with shapes that are much more different from learnt data are experimented with, the default value will be moved to an appropriate position based on the inputted images if appropriate scales and translations are inputted into the mean shape [15]. In this study, the number of training sets was limited to five in order to conduct experiments on segmented chest wall CT images. Although this was a small number of studies of clinical experiments, the results were shown to be excellent. Therefore, it is expected that better results of clinical applications will be produced if more study data are used. Although the best results can be obtained only when the number of studies and landmarks are increased, this study sought to study clinical applicability under the most basic conditions and planned to evaluate the method using more clinical images in later studies.
It is believed that the results of this experiment will be efficiently utilized to quantitatively evaluate lungs in clinics because the shapes of different patients' chest walls are almost identical. However, the study should be exceptionally applied to patients with malformation of the tunnel breast resulting in a severely twisted chest wall.
As for future studies, case studies should be conducted with increased numbers of medical images and experiments to automatically segment the chest wall, even in patients with malformed chest walls [16]. In addition, recently, studies have been seeking to develop software for 3D automatic surface reconstruction in order to automatically detect pulmonary tumors (nodule) and obtain 3D anatomical images of human bodies using CT and MRI images. Thus, it is thought that this study can be utilized to conduct basic experiments in studies of 3D image segmentation [17].