

I. Introduction
Sleep is an essential life process in u-health environment [1]. It is as important to our well-being as the food we eat, the water we drink, and the air we breathe. Lack of sleep is a common feature of our society, affecting students and adults alike [2]. Problem sleepiness can be deadly. Approximately 140,000 automobile crashes each year in Korea result from drivers who were "asleep at the wheel [3]." The analysis of sleep stage based on biosignal is the way to evaluate the quality of sleep [4]. Identification of an individual's sleep stage is the first step in sleep studies for clinical diagnosis and treatment of sleep disturbances. It is common knowledge that sleep is an essential state of rest and refreshment. Sleepiness, trouble concentrating, and increased risk of accidents are caused by insufficient sleep, which can be better understood by interpreting sleep stages and the sleep cycle The theory of non-linear dynamic systems, also called chaos theory, has now progressed to a stage, where it becomes possible to study self-organization and pattern formation in the complex neuronal networks of the brain [5]. The chaotic process, correlation dimension (D2) and largest Lyapunov exponent (L1), were performed to quantify the complexity of physiological phenomena of sleep electroencephalography (EEG) at different sleep stages. D2 proved to be very useful for characterizing the brain dynamics in different sleep stages. It is found that D2 decrease in deep sleep stages, thus reflecting a synchronization of EEG [6,7]. D2 was also used for characterizing the brain dynamics doing mental tasks [8-10]. The D2 was also used for characterizing the nature of EEG signal. In principle, converging D2 value point towards a non-linear deterministic nature and diverging D2 values would stress the interpretation of EEG signals as noise. The next section presents the experimental results of the performance of nonlinear analysis and discussion.
II. Methods
1. Experimental Materials
Four healthy young men between the ages of 27 and 29 years (mean age 27.5 years) volunteered participate in the present study. They did not use any medications and had no sleep complaints. The subjects were asked to go to bed between 10 pm and 12 pm and were permitted to sleep for a maximum of 8 hours. All recording were preceded by at least one adaptation night in the sleep laboratory. Polygraphic recordings of the EEG, electrooculography (EOG) and electromyography (EMG) were obtained. EEG electrodes were placed at C3 and C4, according to the international 10-20 electrode placement guidelines. The ground and reference were placed in the right earlobe. The chin EMG was recorded at the submental region. The EOG leads were placed on the outer cantus of the left and right eyes. For the recording, BIOPAC MP150 system was used with a 1 kHz sampling rate and a gain of 10,000. The high pass filter was set to 0.5 Hz ad the low pass filter to 100 Hz. The 60 Hz notch filter was on at all times. All subjects gave written informed consent prior to the experiments. Sleep stages were scored visually on a computer screen using standard criterion for each 30 second epoch. In this study, the sleep stages were divided into four stages (wakefulness, stage 1; light sleep 1, stage 2; light sleep 2, stage 3; deep sleep 1, stage 4; deep sleep 2, rapid eye movement [REM]). Because stage 1 is a transient state, stage 1 and stage 2 together were classified as light sleep. Sleep stage 3 and stage 4 were called deep sleep.
2. Methods
The presence of chaos in dynamic systems is quantified by measuring the complexity of dimension and characteristic exponents which estimate of the level of chaos. Dimension gives and an estimate of the system complexity that is solved by D2. Largest Lyapunov exponents quantify the exponential sensitivity of divergence to initial condition and estimate the amount of chaos in a system.
1) Phase space (attractor dynamics)
The first step of chaotic analysis involves reconstructing the phase space from a single time series. Phase space is an abstract mathematical space in which to view the dynamic. This is accomplished by utilizing time delay and embedding dimension. The choice of an appropriate time delay T and embedding dimension d is important for the success of reconstructing the attractor with finite EEG data. For the time delay, T, the first local minimum of the average mutual information between the set of measurements X(t) and X(t + T) was used [11]. Mutual information measures the general dependence of two variables.
The minimum embedding dimension in the reconstruction producer was estimated using and algorithm proposed by Kennel et al. [12]. The algorithm is based on the idea that in the passage from dimension d to d + 1, one can differentiate between point on the orbit that are true neighbors and those that are false. A false neighbor is a point in the data set that is identified as a neighbor solely because of viewing the attractor in too small embedding space. When the point in the data has achieved a large enough embedding space, all neighbors of every attractor point in the multivariate phase space will be true neighbors. Mathematically, a reconstructed phase space can be described as follows

Where X(t) is the time series from a dynamical system, T represents appropriate time delay and d is a proper embedding dimension for phase space reconstruction.
2) Correlation dimension (D2)
D2 describes the dimensionality of the underlying process in relation to its geometrical reconstruction in phase space. This section estimated the complexity using the approach based Grassberger-Procaccia algorithm [13]. It estimate the average number of data points within a radius r of the data point rij. as
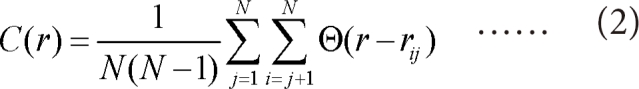
Where C(r) is the number of points within all the circles of radius r and N represent the number of points in phase space, and ╬ś is the Heaviside function.
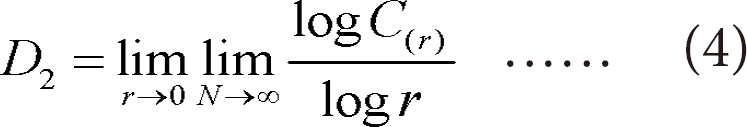
And rij is the spatial separation between two points labeled i and j, usually given in an m-dimensional time-delay embedding by Euclidean norm. A plot of log(C(r)) versus log(r)should give an approximately straight line, whose slope in the limit of small r and large N is the correlation dimension.
3) Largest Lyapunov exponent (L1):
The L1 from the EEG signal was evaluated based on Rosenstein et al. [14] algorithm. For their method, the L1 can be defined using the following equation.
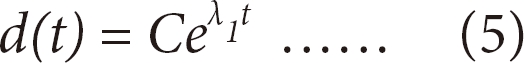
Where d(t) has the average divergence at time t and C is a constant that normalizes the initial condition. After reconstructing the phase space, the algorithms find the nearest neighbor of each point in the trajectory. The nearest neighbor,  , is found by searching for the point that minimizes the distance to the particular reference point, Xj, This is expressed as
, is found by searching for the point that minimizes the distance to the particular reference point, Xj, This is expressed as
Where dj(0) is the initial distance from the jth point to its nearest neighbor, and  denotes the Euclidean norm. By taking the logarithm of both sides of example (5), we obtain
denotes the Euclidean norm. By taking the logarithm of both sides of example (5), we obtain
Where ╬öt is the sampling period of the time series, and dj(i) is the distance between the jth pair of nearest neighbors after I discrete-time steps, i.e, iŌĆó╬öt seconds. The example (7) represents a set of approximately parallel line (for j = 1, 2, ŌĆ”, N), each with a slop roughly proportional to ╬╗1. The largest Lyapunov exponent is calculated using a least-square fit to the average line defined by
Where <Indj(i)> denotes the average over all values of j.
III. Results
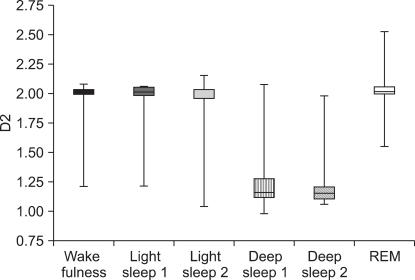
Figure 1 represents the mean D2, standard deviation and the sleep stages for entire sleep EEG of each sleep recording sets. The most significant finding is the decrease of mean D2 from light sleep 1, 2 (stage 1, 2) to deep sleep 1, 2 (stage 3, 4) and increased at REM sleep stage. The differences between individual subjects are displayed in wakefulness stage.
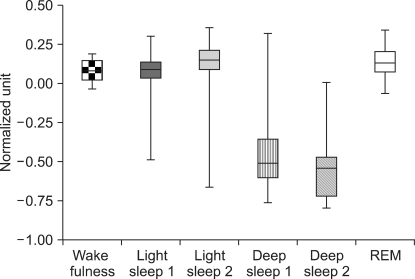
The mean values and standard deviations of L1 are shown in Figure 2. The results show that the more sleep moves to deep sleep 1, 2 (stage 3, 4), the lower L1. Both D2 and L1 displayed a similar pattern in entire sleep stages between and within-subjects.
IV. Discussion
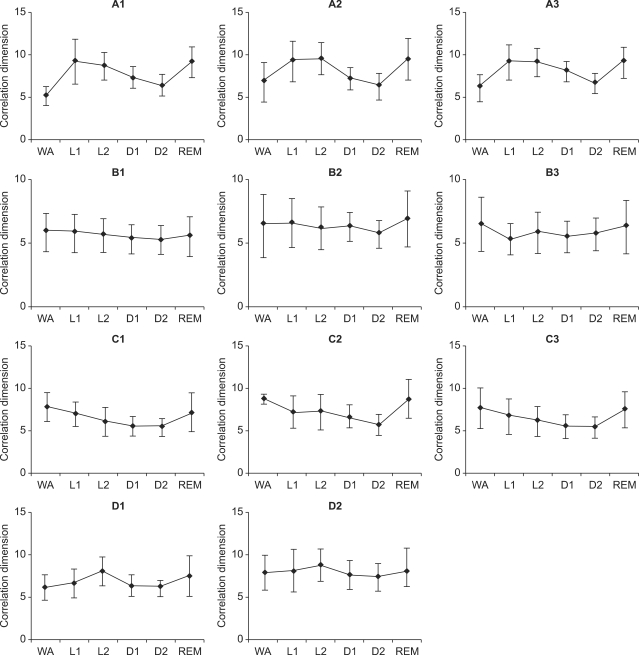
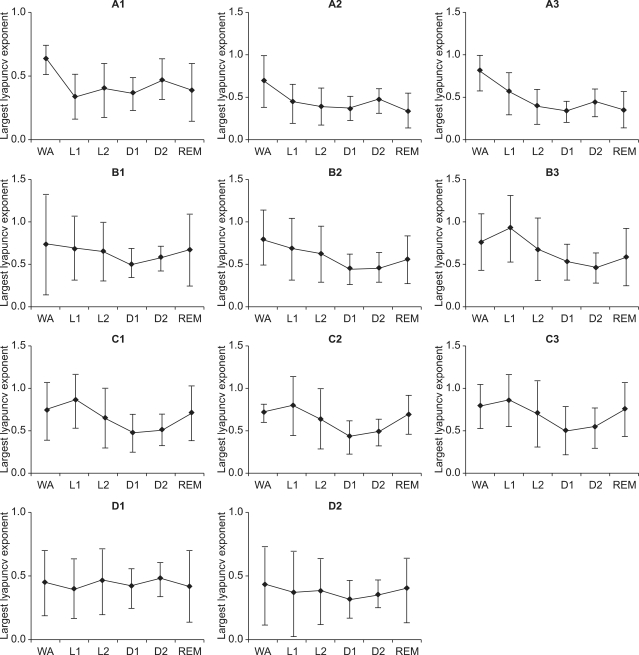
The aim of the study is to investigate the use of chaotic methods for sleep scoring with the single EEG signal. The chaotic methods including correlation dimension(D2) and largest Lyapunov exponent (L1) are evaluated by the experimental dataset. Both D2 and L1 for the entire sleep EEG per 30s epochs were calculated. The mean of D2 and L1 decreased from light sleep to deep sleep and increased at REM stage. These results of D2 are generally consistent with the results reported by Roschke and Aldenhoff [6] Because the neurons of the brain become more inactive as person goes through from one sleep stage to the next sleep stage, until sleep stage 4, few number of neuron will be available for processing the information, and as a result the D2 and L1 be decreased. But in REM stage, the neurons become active as a result the D2and L1 be increased. Individual differences were also found in chaotic analysis in Figures 3, 4. D2 and L1 respectively and displayed similar patterns between inter-subjects. The results show that D2 and L1 decreased from light sleep to deep sleep and increased at REM stage. We present experimental results of the chaotic methods, and demonstrate the feasibility of our approach with a simple measurement of EEG signal that involved datasets from four subjects. The results of nonlinear analysis show high relationship with sleep status and experimental output. Therefore integrated analysis with traditional (linear: Fourier transform) analyzed methods is helpful to improve the validity and explore the physiological mechanism of sleep status with various scientific analyses.