I. Introduction
Pusan National University Hospital (PNUH) was founded on November 1, 1956 as the only national hospital in Pusan city and established an affiliated hospital in Yangsan, a newly developed city on the outskirts of Pusan, in 2008. PNUH has 1,170 beds and 2,100 staffs, treated 911,649 outpatients and 361,246 inpatients, and performed about 16,000 operations in 2010. PNUH is the largest medical center in the Southeastern region in Korea with several specialized centers including regional emergency-care center, regional cancer center, and cardiovascular center. Recently, a trauma center, pulmonary center, and regional clinical trials center were established with special government grants.
Information Communication Technology has been widely applied in hospitals worldwide. The Healthcare Information and Management Systems Society categorized hospital information system according to eight stages [
1]. Stage 0 systems do not have medical support subsystems such as laboratory, pharmacy, and radiology. Stage 1 systems include a medical support system. Stage 2 systems include clinical data repository (CDR) utilizing information from the medical support systems. Stage 3 systems include clinical decision support system (CDSS) integrated with CDR and nursing records. Stage 4 systems include a computerized physician order entry (CPOE) and CDSS based on the knowledge acquired from the evidence-based medicine. Stage 5 systems integrate the information provided by CPOE, CDSS, and medical support systems. Stage 6 systems include electronic medical record (EMR) and CDSS based on Critical Pathway and Clinical Practice Guidelines. Finally, State 7 systems allow for inter-operability among systems by using Continuity of Care Document. 82% of information systems for tertiary hospitals in Korea, including PNUH, belong to Stage 6 [
2]. Recently, the Seoul National University Bundang Hospital in Korea became only the eighth hospital in the world and the first outside the United States to receive a certificate for Stage 7 [
3].
Healthcare systems in Korea are heavily dominated by the private sector, with only 78 (4%) of 1,943 hospitals being public in 2007 [
4]. Except a few national university hospitals, most public hospitals suffer from inadequate facilities and manpower, mainly due to a lack of government support. While most private hospitals are increasingly introducing state-of-art hospital information systems (HISs) such as EMR and CDSS (Stage 6) in order to improve the quality of services, many public hospitals cannot afford such upgrades. To deal with this imbalance in information system (IS) adoption between public and private hospitals, government has decided to invest in developing the model for IS for public hospitals at PNUH.
The performance of ISs should be evaluated from both qualitative and quantitative perspectives before and after their implementation in order to improve user satisfaction and justify capital investment on IS. Qualitative evaluation deals with the factors related to user satisfaction and improvement in the business process. The Performance Reference Model (PRM) was developed by the Office for Management of Budget in the United States and has been widely used in evaluating IS performance for government projects in the United States. Chung [
5] applied PRM to evaluate IS performance for several government projects in Korea. Since PRM evaluates IS based on the key performance indicators (KPI) for each of three system layers (input, process, and business), it provides a comprehensive view of the overall IS performance. They developed PRM ver. 2.0 as a standard performance evaluation tool and identified 138 KPIs for evaluating the performance of government IS projects. However, many of these KPIs are not applicable to the healthcare setting because they were primarily developed for ISs for government projects unrelated to healthcare. Therefore, a need has arisen to identify KPIs for evaluating the performance of IS projects in a healthcare setting based on the PRM framework.
Quantitative evaluation primarily deals with the economic effects of IS. Although several studies have conducted economic evaluations of IS projects in healthcare [
6,
7], most of these studies did not adequately account for intangible or indirect benefits such as savings of opportunity costs due to reduced waiting time. Parker et al. [
8] introduced the information economics (IE) approach to account for intangible benefits by systematically analyzing intangible benefit items. Chae et al. [
9] used IE to analyze the economic effects of CPOE and Kang et al. [
10] also studied the economic feasibility of EMR using IE. In order to disseminate the system developed specifically for PNUH to other public hospitals, the system must be evaluated and demonstrated its economic feasibility.
Therefore, this study presents the Pusan Hospital Information System (PHIS), evaluates its performance qualitatively based on PRM, and conducts economic analysis by using the IE approach.
II. Case Description
1. History
PNUH first introduced the order communication system (OCS), often called the CPOE system, the admission/discharge/transfer (ADT) system, and billing systems in 1997. The picture archiving and communication system (PACS) was introduced in 2004 and EMR was introduced to the Yangsan PNUH in 2008.
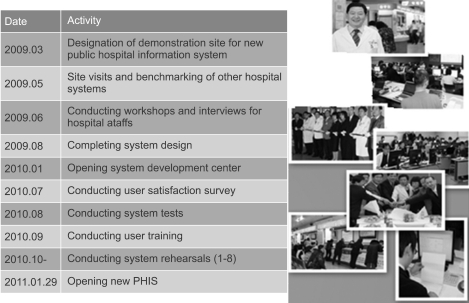
As shown in
Figure 1, PNUH was designated as a demonstration site for the new PHIS by the Ministry of Health and Welfare in March, 2009. A new task force was organized to carry out planning, identifying user requirement, and user training. This task force was comprised of a planning committee (10 members), user coordinators (9 nurses, 3 information specialists), 5 user training instructors, a nursing information committee (11 members), a system development team (52 members), and a key user team (180 members). A total of 1,179 person-months (average 50 persons per month) was devoted to the development of the PHIS. Selected members from the task force visited several hospitals to learn about EMR and the implementation problems experienced by these hospitals. Survey on user satisfaction was conducted in July, 2010 to elucidate the user problems and identify areas for improvement. The PHIS was finally opened on January 29, 2011.
A number of user training sessions, seminars, and system rehearsals have been conducted since the development project was approved in March, 2009 (
Table 1). A total of 14,095 task force members have participated during this period.
2. Business Process for PHIS
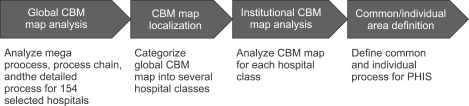
The business process for PHIS was derived from the Component Business Model (CBM) by IBM [
11]. As seen in
Figure 2, the overall hospital industry CMB map was defined by using 154 selected hospitals, the global CBM map was categorized into several hospital classes according to size and ownership of the hospitals, CBM map for each hospital class was analyzed, and the common and individual process for PHIS were defined.
3. Information Technology (IT) Infrastructure
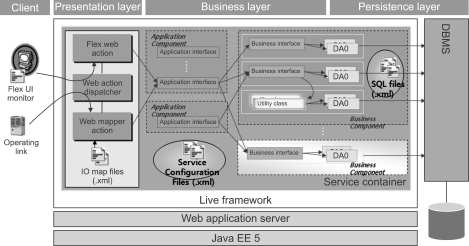
The IT infrastructure for PHIS is comprised of various information technologies, as shown in
Figure 3. PHIS was designed by component-based development and developed by the Rich Internet Application User Interface tool and medical specialized framework. Web 2.0 which allows for a dynamic web service was applied to the UI layer to provide a user-oriented business environment. In addition, Flex 3.0, which is a well-known RIA solution by Adobe Systems (Mountain View, CA, USA) was used to design a quality screen with less network traffic for complex clinical tasks. With Flex 3.0, users can select a widget for designing their own individualized screen, and quickly search for the specific widget by using a widget docking function.
Live Framework 5.0, which is an application development tool by Hyundai Information Systems, Inc. (Seoul, Korea), was used to develop applications in the business layer such as medical, medical support, ADT, and customer relations management. Live Framework 5.0 is a web application framework based on Java EE 5, which was developed by Hyundai Information Systems, Inc. for medical applications by using component-based infrastructure such as Web Mapper, Service Container, and Query Document Access Object. It was well integrated with Flex 3.0 to reduce complexity and improve efficiency and stability in system development.
4. System Overview
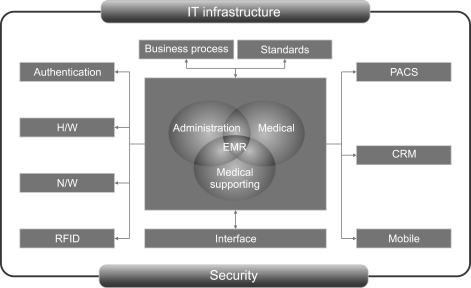
The newly developed PHIS is comprised of five subsystems: medical (CPOE, EMR, CDSS, nursing), medical support (lab, radiology, and pharmacy), administration (billing, insurance claims, ADT), PACS, and Customer Relations Management (CRM), as shown in
Figure 4. These systems were developed by the web-base approach. The key functions of these subsystems are summarized as follows:
EMR is the core of the medical subsystem and is closely integrated with medical support subsystems, administration subsystems, and PACS. EMR for PHIS has the following functions:
Image editing function for anatomical regions
Search function for the past history of old patients
Environment setting function for order/patient selection/button customized for patient treatment pattern
Nursing care recording function for diagnosis (D), nursing care (N), action (A), and results reporting (R) by using departmental set based on the International Classification for Nursing Practice (ICNP)
User management function for access control for users
PACS provides digitalized medical images and stores them in the image database, which allows the test results collected from over 50 medical devices to be transmitted to outpatient clinics, inpatient wards, Intensive Care Unit, and emergency center. It is fully integrated with EMR and OCS for smooth information flow.
CRM provides information to improve the quality of patient services. It has the following functions:
Comprehensive patient management function for providing single-view customer support based on information from the integrated customer database
Campaign management function for providing customer information via SMS and email by templates for regions, age group, case-mix, and tests to support the promotion campaign
Notification function for providing information on reservations for outpatient visits and physical examination
A mobile system is under development and will provide patient information through mobile phones. Duty doctors at the emergency center carry a radio frequency identification (RFID) tag so that their check-in and check-out times are automatically recorded. RFID tags will replace most of the bar codes in the future.
A security system was developed according to the government security guidelines as follows:
Hospital network is protected from outside hacking by a firewall
Individual passwords are authenticated when they are stored in the database
Logged-in screens are automatically logged-out after a predetermined time period to prevent unauthorized access
Every transaction is automatically logged for tracking down unauthorized access
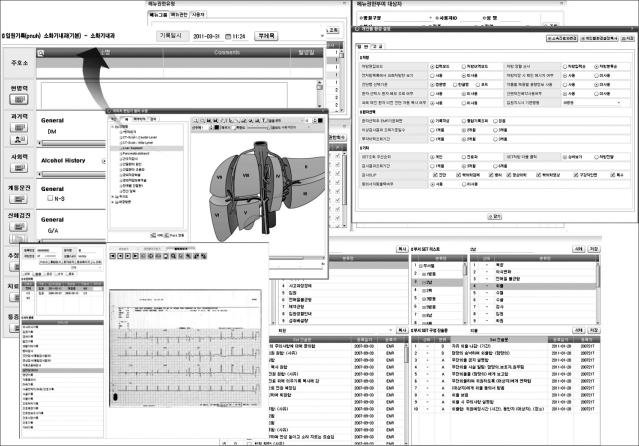
5. Characteristics of PHIS
1) Creation of individual medical/nursing templates
PHIS allows for the provision of various customized documents by individual setting of the computing environment. It also allows for easy creation of nursing records, by combining several nursing templates based on ICNP, and of individual and departmental charts by using a combination of blocked charts and pasting of images (
Figure 5).
2) Integrated OCS
PHIS enables all authorized information to be accessed by Single Sign In and supports one-stop services for the specialized clinical centers. Prescription orders, test orders, insurance codes, and logistics codes used in OCS were fully integrated, which has improved the consistency in clinical information, reduced duplication, and improved the accuracy in billing and patient statistics.
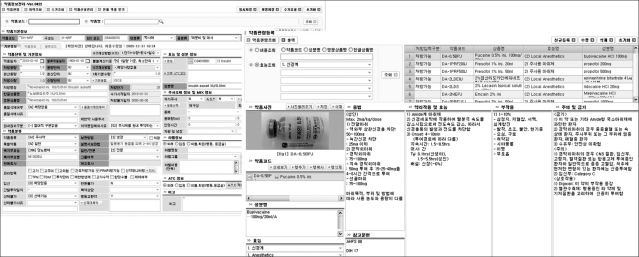
3) Comprehensive administration functions
PHIS allows for simultaneous registration/billing at all windows, automatic calculation of account receivables, simulation of treatment costs, and automatic confirmation of eligibility for severe/rare disease patients and of the remaining drug prescription days for the purpose of insurance reimbursement. It also provides various consent forms, test guidelines, and class schedules for various diseases to improve patient services. By integrating all internal systems, ADT staffs can monitor the availability of hospital beds and the status of lab tests in real-time, and effectively manage antibiotics, narcotics, Total Parenteral Nutrition, and anticancer drugs. These functions help improve patient services, staff productivity, and the efficiency of administrative activities (
Figure 6).
III. Results
1. Qualitative Performance Evaluation
1) Subjects and methods
Questionnaire survey was conducted to identify the factors influencing IS success in July, 2010. 41 doctors, 104 nurses, 11 medical support staff, and 25 administrative staff responded to the survey with response rate of 79%. 14 KPIs were derived from three layers based in PRM. Specifically, the input layer was comprised of IT factors (e.g., system quality, information quality, user understanding of system, information sharing, and security) and human factors (top management support). The process layer was comprised of transaction process (efficiency of process and quality of business transaction) and management process (regulation management, knowledge management, and security management). The business layer includes the effects of the system on the efficiency of business outputs and user satisfaction [
12].
2) Results
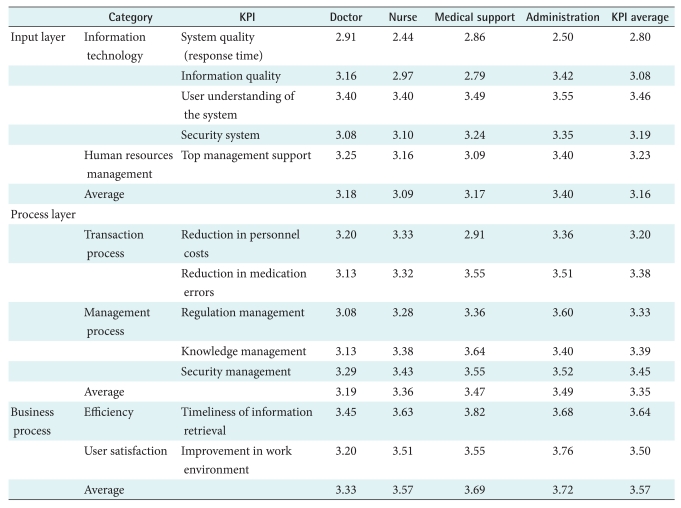
As shown in
Table 2, the average input layer score was 3.16: user understanding of the system score was the highest (3.46) but the system quality score was the lowest (2.80). Specifically, nursing staff were more dissatisfied with the slow response time than the other groups because they used the system more frequently. A high user understanding score may ease the adaptation to the new system for users at PNUH. The top management support score was high for administrative staffs because they interact with the top management more frequently than the other groups.
The average process score was 3.35: improved security management was the highest (3.45), and the efficiency in transaction process was the lowest (3.20). Specifically, the process scores for doctors and nurses in the areas of reduction in medication errors, regulation management, knowledge management, and security management were lower than non-medical staffs, perhaps due to the weak medical functions of the systems.
The average score for the business layer (3.57) was higher than the scores for the input and process layers, perhaps users were well adapted to the old system despite of system problems. Specifically, the average business scores for efficiency of business outputs and user satisfaction were the lowest for doctors (
Table 2).
2. Economic Performance Evaluation
1) Subjects and Methods
Two surveys were conducted to estimate the reduction in outpatient waiting time by comparing the time at PNUH with that at S hospital, a hospital similar to PNUH except for its implementation of EMR. 426 and 228 outpatients were surveyed at PNUH and S hospital, respectively [
13].
Economic performance of HIS was evaluated based on the IE approach in order to account for the intangible benefits. The IE approach broaden the scope of the benefits to value and categorize it into 5 specific value items: direct benefits, value acceleration, value linkage, value restructuring, and innovation valuation. Direct benefits refer to the traditional benefits from HIS such as savings in personnel costs due to reduced workloads. Value acceleration refers to the value associated with the time factor such as the reduced opportunity costs for patients due to the reduced waiting time. Value linkage refers to the value accrued from compounded effects such as savings for hospital costs due to reduced medication errors. Value restructuring refers to the value accrued from the increased productivity by reengineering business process. Innovation of valuation refers to the added value accrued from the introduction of new systems or policies (e.g., information sharing among hospitals). Sensitivity analysis was performed to test the validity of the hypothetical parameters used in the economic analysis and to simulate the effects of policy alternatives such as dissemination of information system for PNUH to other public hospitals.
2) Results
The cost item includes hardware, software, network, maintenance, and depreciation. Depreciation was estimated by assuming 5 years of economic life and no salvage cost. Maintenance costs was assumed to be free until 2012 and 10% of the total system costs thereafter. The annual discount rate was assumed to be 3.69%.
Benefits were estimated based on the assumptions that only direct benefits (e.g., savings from reduced paper works) would be derived in the first year of implementation (2011), that value acceleration (e.g., savings from opportunity costs due to reduced waiting time), value linkage (savings from the reduced medication errors and improved quality of care), and value restructuring (savings from improved work process) would be derived from 2012 after users become familiar with the new systems, and that innovation of valuation (e.g., savings from re-examination of laboratory and X-ray tests) would be derived from 2013 after government policy allows for information sharing among hospitals.
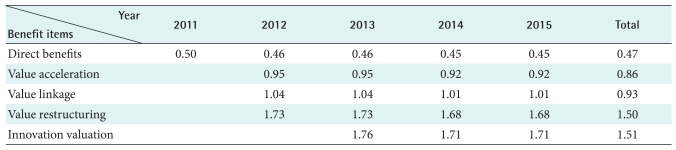
The cumulative benefits to costs (B/C) ratio was 0.50 in 2011, 1.73 in 2012, 1.76 in 2013, 1.71 in 2014, and 1.71 in 2015. As seen in
Table 3, the B/C ratios steadily increase as value items are added. The total B/C ratio was 0.47 if only the direct benefit was included, but increased to 0.86 with the addition of value acceleration, to 0.93 with value linkage, to 1.50 with value restructuring, and to 1.51 with innovation valuation (
Table 3).
IV. Conclusions
The new PHIS was developed by the web-based IT infrastructure and began implementation on January 29, 2011. Before its implementation, the performance of the old PHIS was qualitatively evaluated based on PRM in order to identify problem areas for the old system and collect baseline data for comparing with the performance of the new system. In the input layer, the system quality was low and nursing staff were more dissatisfied with the slow response time than other staff, perhaps due to their frequent use of the system. In the process layer, the accuracy of the business process was low and especially doctors were more dissatisfied with inaccuracies in the business process and program errors. Finally, in the business layer, the average score for the business layer was higher than the scores for the input and process layers. However, doctors were less satisfied with the system, perhaps due to the weak clinical function in the old systems. The results showed that system performance, especially response time, and clinical function should be improved. The newly developed EMR and CDSS are likely to improve the clinical function for doctors and nurses.
We also performed economic analysis for the newly developed HIS by using the IE approach and performed sensitivity analysis for the hypothetical parameters and the scenarios according to the number of hospitals to be disseminated. We used the IE approach in order to quantify the intangible benefits systematically. IE attempts to categorize the benefits into five value types: direct benefits, value acceleration, value linkage, value restructuring, and innovation valuation. While actual hospital data were used in most of the analysis, some data were extrapolated from the literature if actual data were not available. The patient waiting time for two outpatient departments were compared for two hospitals (one with and one without EMR) in order to estimate the time savings from the reduction in waiting time. In the results, the B/C ratio was 0.47 if only the direct benefit was included, but increased to 0.86 with the addition of value acceleration, to 0.93 with value linkage, to 1.50 with value restructuring, and to 1.51 with innovation valuation. The IE analysis demonstrated the economic profitability of the PHIS project if all intangible benefits were included. Sensitivity analysis showed that the B/C ratio was further increased if the same system was disseminated to other public hospitals.
In the future, a performance of the new PHIS should be evaluated again after 6 months of its implementation based on qualitative as well as quantitative (or economic) perspectives by using the above results as baseline data. Specifically, KPIs from the previous survey should be compared with the KPIs from the second survey to determine whether new PHIS will indeed improve user satisfaction, especially for medical staffs, and improve efficiency in business process. In addition, economic performance of new PHIS should be analyzed again by accounting for the actual changes in waiting time for outpatients and transaction processing time after 6 months of its implementation.
Acknowledgements
This article is supported by the grant for the public hospital information system project by the Ministry of Health and Welfare.
References
1. Healthcare Information Management and Systems Society. Essentials of the US hospital IT market. 2010. 5th ed. Chicago: Healthcare Information Management and Systems Society; p. vii.

2. Yu KB. Effects of EMR and CDSS on hospital performance [dissertaion]. 2011. Seoul: Yonsei University Graduate School of Public Health; p. 26.
3. Choi J, Kim JW, Seo JW, Chung CK, Kim KH, Kim JH, Kim JH, Chie EK, Cho HJ, Goo JM, Lee HJ, Wee WR, Nam SM, Lim MS, Kim YA, Yang SH, Jo EM, Hwang MA, Kim WS, Lee EH, Choi SH. Implementation of consolidated HIS: improving quality and efficiency of healthcare. Healthc Inform Res 2010;16:299-304.


4. National Health Insurance Corporation. 2007 National Health Insurance statistical yearbook. 2007. Seoul: National Health Insurance Corporation; p. 40-41.
5. Chung KH. Methodology for performance evaluation of public information systems. 2008. Gwacheon: Korea Information System Development Institute; p. 47-56.
6. Chung WJ, Lee SH. Cost-benefit analysis of internet-based prescription delivery system. Korean J Health Policy Adm 2002;12:54-83.
7. Korea Development Institute. Pre-evaluation of public health information systems. 2008. Seoul: Korea Development Institute; p. 79-183.
8. Parker MM, Trainor HE, Benson RJ. Information strategy and economics: linking information systems strategy to business performance. 1990. Englewood Cliffs, NJ: Prentice Hall.
9. Chae YM, Lee HJ, Park CR. Economic analysis of order communication system for hospitals. Korean J Prev Med 1991;24:473-484.
10. Kang SH, Chung YI, Chae YM. Economic analysis of electronic patient record. J Korean Soc Med Inform 1997;3:37-47.
11. IBM. Information strategy plan for public hospitals [unpublished report]. 2007. IBM.
12. Chae YM, Cho KW, Kim HS, Park CB. Evaluation of hospital information system based on the performance reference model. Korean J Health Serv Manag Forthcoming 2011
13. Chae YM, Kim S, Cho KW, Kim HS, Kang SH, Kim HH, Park CB. Economic analysis of hospital information system by information economics approach. J Korean Soc Health Inf Health Stat 2010;35:195-205.