

I. Introduction
In Korea, those top-ranked causes of death excluding suicide and traffic accident are all chronic diseases: cancer, cerebrovascular diseases, cardiac disorders, diabetes, pneumonia, chronic lower respiratory diseases, liver disorders, and hypertensive diseases [1]. As illnesses with symptoms that last over three months, chronic diseases lowers the quality of the elderly life and puts greater strain on national health budgets [2].
Patients with chronic diseases require frequent clinical tests and treatments, even several times a day. Since it is not easy to visit hospitals so frequently, many patients measure their health status with their own measuring devices at home. However, they are only able to see their current measurement data. They are unable to figure out whether or not their overall health is improving [3].
Obesity and hypertension are closely related to the mortality from many chronic diseases. For this reason, the increase and decrease in people's body weight, body mass index (BMI), body fat, and blood pressure are important indicators of their health status [4,5]. The causes of obesity and hypertension are various and complex. Therefore, approaches to treatment of obesity and hypertension are not easy. The established methods for the effective treatment of obesity and hypertension are multi-dimensional, and the health control programs for the treatment of obesity and hypertension are integrated programs that include diet, exercise, and behavior correction programs [6,7].
With the development of information technology, many studies on health control programs have utilized information technology to manage their programs effectively. Some previous studies have utilized computerized programs or the internet to find effectual methods for generating personalized exercise prescription or managing subjects [8-10]. Other studies have also utilized computer programs or the internet to administer their diet programs productively [11,12]. Recently, some studies have tried to link health devices to computer programs for ubiquitous health care [3,13,14].
However, these studies were limited in the sense that the subjects' body weight, body fat, and blood pressure were measured by separate measuring devices or the data measured were passed through some mediation procedures. Measurement and management, therefore, were not integrated as a whole-both variables managed independently of each another.
To prevent such possibly error-causing limitation, we developed an integrated weight management system, Health Improvement and Management System (HIMS)-diet, which linked a weighing device to the computer program, and validated the effectiveness of the system with experimental study [15]. Now we upgraded the system into an integrated health management system, HIMS-everyday, which linked additional measuring devices to the computer programs as well. HIMS-everyday manages the subjects' body weight, BMI, body fat, blood pressure, blood sugar, and daily habits on the basis of their personalized health information and induces the subjects to take action for their health control by method of stimulation. In this study, we introduce the HIMS-everyday and evaluate the effectiveness of the system on health management in middle-aged and elderly women.
The goal in designing HIMS-everyday is to encourage people to manage their health status continuously by providing health information centered on health status data (weight, BMI, body fat, blood pressure, and blood glucose) immediately after they measure themselves. In contrast to previously designed systems, measurement and management are fully integrated within the HIMS-everyday system. In this system, people can access an analysis of their health information immediately after measuring themselves using the devices connected to the computer system. Moreover, the system is designed to manage health information systematically and continuously through automatic storage of all health data in the database.
The purpose of this study was to explore possibilities related to health promotion nursing interventions utilizing the system as a tool. Perceived health status and health promotion behaviors were very important to improve subjects' self management. Utilizing the system as a tool needs usage time and frequency including other variables.
The focal contribution of this paper to existing studies on health management system can be summarized as the following: 1) Introduction of biofeedback-based personalized health care system-designed to integrate health status measurement and health management in one system. 2) Evaluation of the effect of the system on middle-aged and elderly women's health through experimental study.
II. Methods
1. Overview of the System
1) The external appearance and function of the system
The system dubbed as HIMS-everyday was a personalized health care system. The external appearance of the system looks like a form in which a computer, a weight scale and a measuring device are combined as shown in Figure 1. The displayed monitor image in Figures 1 is an example of user interfaces when the subject measures her body weight, body fat, blood pressure, and blood glucose. Using the weight scale on the right lower side in Figure 1 the subject measures her body weight. Using the measuring device on the left lower side in Figure 1 the subject measures her body fat, blood pressure, and blood glucose. Subjects of the system can verify the changes in their health status immediately after measuring themselves.
With respect to the subjects, the function of the system can be divided into two parts: physical health indicator management part and life style management part. The physical health indicator management part consists of four physical test modules and three analysis modules as diagrammed in Figure 2. In the physical test modules, subjects measure their body weight, percent body fat, blood pressure and blood glucose using devices connected to the computer programs. In the physical test analysis modules, evaluation of the measured data is performed using the database in the computer system and subjects individually manage their health status according to the evaluation result. Subjects are also able to observe improvement in their health status as a result of their own health management.
The life style management part is composed of one survey module and two analysis modules as diagrammed in Figure 3. In the life style survey module, subjects check their daily life styles using the computer programs. In the life style analysis modules, evaluation of the surveyed data is performed using the database in the computer system and subjects individually manage their daily life styles according to the evaluation results. As with the physical test analysis modules, subjects are able to observe the changes in their life styles as a result of their own health management.
The main purpose of this study is to validate the effectiveness of the personalized health care system by assessing the effect on the changes of body weight, BMI, body fat, blood pressure, perceived health status and health promoting behavior. For this reason, the technical details of the internal system are excluded from the scope of this study.
2) The health management process and user interface of the system
The health management process of the system consists of four stages-log-in, measurement of health status, data analysis, and display of health status trend. The first step is to log into the computer system. The second step is to measure the body weight, percent body fat, blood pressure, and blood glucose and to survey daily life style. The subject measures herself by using measuring instruments connected to the computer as instructed by the computer display screen. The subject also checks her life style details on the computer display screen. In the third step, data analysis stage, the system calculates the changes in his body weight, percent body fat, blood pressure, and blood glucose using the subject's health data stored in the database and shows these measurement in numeric values. In the fourth and last step, the system displays the trends in the subject's measurement data as graphs.
The displayed images in Figures 2 and 3 are examples of user interfaces that the subject operates during the health managing process. The images on the left side in Figure 2 are examples of the user interface when the subject measures her body weight, body fat, blood pressure, and blood glucose. The images on the right side in Figure 2 are examples of the user interface through which the system shows the subject's analysis data and trends in body weight, body fat, blood pressure, and blood glucose in various graph forms. The image on left side in Figure 3 is an example of the user interface when the subject checks her daily life style. The buttons on the image are details for checking her daily life style. The image on right upper part of Figure 3 is an example of the user interface through which the system shows the status of sending data to Web server. The image on right lower part of Figure 3 is an example of the user interface through which the system shows the subject's trends in life style in a graph form.
2. The Method of Validating the Effectiveness of the System
1) The validation process
The subjects used the HIMS-everyday system in their daily lives. The trends in the subjects' weight, BMI, body fat and blood pressure were analyzed using the subject-particular information stored in the database during their actual usage of the system. The subjects were instructed to manage their own daily habits continuously by measuring themselves using the system, as well as by confirming the measurements and the analytical results provided by the system. Moreover, we checked the changes of the subject's perceived health status and health promoting behaviors with respect to the differences between before and after applying the system by using some questionnaires.
2) Subjects and experiment time/setting
The subjects were 83 middle-aged and elderly women in two regions (middle sized cities, Gyeonggi-do and Gyeongsangnam-do). This study was performed with human subjects in community base. We did not confirm official IRB approval. But they were provided with an aural explanation about the purpose and procedure of this study before agreeing to the participation. All the subjects got the informed consent before starting study. The subjects were recruited at the communities and Monastery voluntarily. If the subjects had difficulties in using system and impaired mobility, we did not enroll them. Among these women, those who used the system only once and gave up in the middle of the experiment were excluded subsequently, thereby leaving a total of 69 subjects that used the system more than once throughout the given period. The length of the experimental period for each subject was 8 weeks dispersed over a span of 7 months (from December 11th 2007 to July 7th 2008), and the 8-week period differed in terms of dates among the subjects. The experiment locations were a facility for elderly nuns and the research office of a faculty member at their college. The HIMS-everyday systems were installed in the facility and the office.
3) Instruments for perceived health status, health promoting behavior
To check one's perceived health status, we used the instrument that was based on health self rating scale originally developed by Lawton et al. [16] and later revised by Kim [17], on a 3 items, 5 Likert scale. The higher score means higher perceived health status. Cronbach's alpha of the scale was 0.76 at the time of the scale's original development and 0.91 in the present study.
To check one's health promoting behavior, we used the health promotion lifestyle profile (HPLP) that was developed by Walker et al. [18], and later revised by Park et al. [19] to fit the traits of elderly women in Korea. The Cronbach's alpha was 0.92 at the time of the profile's original development, 0.95 in study of Park et al. [19], and 0.89 in the present study. The profile is comprised as 6 areas totally 40 items on a 4-point scales the following: self-realization, 7 items (1-7); interpersonal relations, 6 items (8, 10, 30-33); nutrition, 6 items (25-29, 9); health responsibility, 10 items (11-20); exercise: 4 items (21-24); stress management, 7 items (34-40). The higher the score, the better the health-promoting behaviors.
4) The analysis of experimental results
As system usage of twice or more was perceived to be significant for analysis, only the data of 69 subjects that used the system twice or more were analyzed for this paper. We used Microsoft Access 2007 database management system (DBMS) and SPSS ver. 18.0 (SPSS Inc., Chicago, IL, USA) as our data analysis tool. We analyzed the effect of the system on the subjects' weight, BMI, percent body fat, blood pressure and pulse rate with respect to the differences between before and after applying the system using paired samples t-test method and Pearson's correlation method to check their correlations. Instruments for perceived health status, health promoting behavior were used Cronbach's alpha.
III. Results
1. General Characteristics of the Subjects
The 69 subjects who used the system twice or more were all middle and old-aged women in two regions with existing interest in health management and thus participated voluntarily in this experiment. Among them, 47 women (68.1%) were between the ages of 35 and 64, and 22 women (31.9%) were over the age of 65-generating a mean age of 53.36 (Table 1).
2. The Effect of the System with Respect to the Differences between Before and After Applying the System
Table 2 shows that the 69 subjects' mean weight decreased from 58.36 to 57.75 after applying the system and mean BMI decreased from 23.59 to 23.35, mean percent body fat decreased from 32.47 to 32.26, mean systolic blood pressure decreased from 130.01 to 123.29, and mean diastolic blood pressure decreased from 82.29 to 77.70.
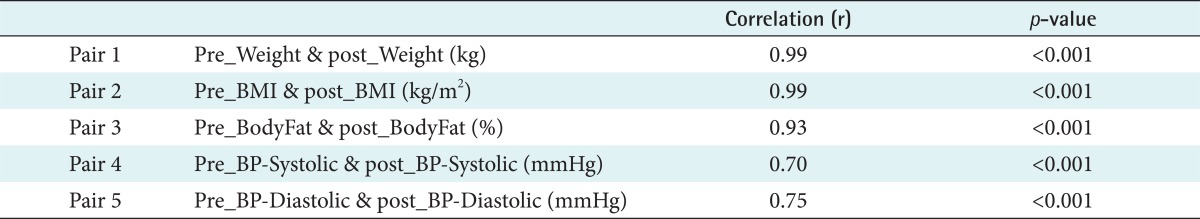
Table 3 shows that the correlations between before and after applying the system in the subjects' weight, BMI, percent body fat, systolic blood pressure, and diastolic body pressure were 0.99, 0.99, 0.93, 0.70, and 0.75, respectively.
Table 4 shows that test statistics of weight, BMI, systolic blood pressure and diastolic body pressure were t68 = -4.13, t68 = -4.00, t68 = -3.59, and t68 = -4.60, respectively and the differences were significant (pWeight < 0.001, pBMI < 0.001, pBP_Systolic < 0.001, pBP_Diastolic < 0.001).
3. The Effect of System Usage Time Period on Weight, BMI, Body Fat, Blood Pressure
We analyzed the effect of system usage time period on the subjects' weight, BMI, body fat, and blood pressure. Calculating the period from the day when the participant first used the system to the day when the participant last used the system, the longest was 68 days, the shortest 17 days, and the mean period was 49.48 days (Table 5). As a result of analyzing the relation between system usage period and the change in subjects' weight, BMI, body fat, and blood pressure, we were able to deduce that the system usage time period is not correlated with changes in weight, BMI, body fat, and blood pressure. Table 6 shows, that the system usage period is not significantly correlative with changes in body weight (r = 0.045, p = 0.712), BMI (r = 0.037, p = 0.763), body fat (r = -0.086, p = 0.480), systolic blood pressure (r = -0.035, p = 0.776), and diastolic blood pressure (r = -0.144, p = 0.237).
4. The Effect of System Usage Frequency on Weight, BMI, Body Fat, Blood Pressure
We analyzed the effect of system usage frequency over the 8 weeks of participation on the subjects' weight, BMI, body fat, blood pressure. The highest usage frequency was 10 times and the lowest 2 times, generating a mean frequency of 3.72 times (Table 5). As a result of analyzing the relation between system usage frequency and the participant's weight, BMI, body fat, and blood pressure changes, we were able to deduce that the higher the frequency, the greater the change in weight, BMI and body fat. However, we discovered that system usage frequency is not correlative with changes in blood pressure. Table 6 shows that system usage frequency correlates significantly with changes in weight (r = -0.269, p = 0.026), BMI (r = -0.268, p = 0.026), and body fat (r = -0.261, p = 0.031). However, system usage frequency is not significantly correlative with changes in systolic blood pressure (r = -0.133, p = 0.276) and diastolic blood pressure (r = 0.084, p = 0.494).
5. The Changes of Perceived Health Status and Health Promoting Behavior
We analyzed the changes of the 69 subjects' perceived health status and health promoting behavior with respect to the differences between before and after applying the system using Paired samples t-test method. The results are shown in Table 7. The score of perceived health status did not show a statistically significant difference (t = -0.271, p = 0.788). As a result of examining the health-promoting behaviors, the sum of the total scores did not show a statistically significant difference (t = 0.125, p = 0.901), either. Each sub-item score: self-realization (t = -0.521, p = 0.604), interpersonal relationships (t = -0.796, p = 0.429), nutrition (t = -0.796, p = 0.429), health responsibility (t = 1.132, p = 0.262), exercise (t = -1.570, p = 0.122), and stress management (t = 1.860, p = 0.068) were all statistically insignificant.
IV. Discussion
The purpose of this study was to test the accuracy of an integrated health care system, dubbed HIMS-everyday and to explore possibilities related to health promotion nursing interventions utilizing the system as a tool. Experimental study on the changes in body weight, BMI, body fat, and blood pressure with respect to the system usage was performed over a period of 8 weeks. We also checked the health status and health-promoting behavior change of the subject before and after applying the system.
The differences between before and after applying the system were significant in body weight, BMI, and blood pressure. The frequency in system usage correlated to the changes in body weight, BMI, and body fat significantly. However, the period in system usage did not affect the change of blood pressure significantly. The body weight, BMI, body fat, and blood pressure of subjects who used the system for a longer period had not improved significantly.
As for perceived health status and health promotion behaviors, which was deduced by measuring subjects' data recorded before and after system usage, some sub-item scores improved. However, total score did not change significantly. The total score of perceived health status showed 9.98 to 10.03 points, yielding a mean score of 3.3 points per question.
While the mean score of 3.3 points in this study was higher than the average score of 3.06 points, in a previous study [20] on perceived health status, this difference may be attributed to the fact that many of the subjects in our study were elderly. Since higher score on perceived health status indicates recognition of one's own health status as good, by extension we can infer that an increase in physical activities will lead to better cognition of the patient's own health status when the system is provided as an intervention device. To apply the system in future interventions, it is necessary to ascertain consistent frequency of system usage for among all subjects.
Health promoting behavior scores also were not significant statistically. The scores consist of six sub-items that determine various areas of the health-promoting behaviors. The mean score in this category showed 2.78, which is similar to the score 2.71 in study of Park et al. [19]. Although the difference is not significant, the system used in this study can be used to obtain on-site measures of body weight, percent body fat, systolic and diastolic blood pressure, in various levels objectively. We believe that such synthesis of accurate objective information and real-time verification by the subjects in this system will be useful in administering future intervention towards improvement in health-promoting behavior.
The previous health care systems managed the health data, but only by measuring health status with separate measuring machines. Therefore, it was not easy to maintain a measured or observed management of the health data. In contrast to such previous systems, the proposed system integrates health data with the data-based health management programs.
Therefore, the system is able to provide instantaneous biofeedback to subjects on their measured health data using the database that stores the subject-customized information. In the case of an increase in the body weight, body fat or blood pressure, subjects receive stimulation to act upon the need to control their health. In the case of decreasing trend or maintaining their goals, they would be able to verify the extent of changes in their data-centered health information.
We believe that obtaining accurate objective data and analyzing them through the system will greatly enhance future healthcare interventions, as the system helps us to understand the subjects' conditions easily and guide them to take proper behaviors to promote their health status.