Modified Mixture of Experts for the Diagnosis of Perfusion Magnetic Resonance Imaging Measures in Locally Rectal Cancer Patients
Article information
Abstract
Objectives
This study demonstrates the feasibility of using a modified mixture of experts (ME) model with repeated measured tumoural Ktrans value to perform an automatic diagnosis of responder based on perfusion magnetic resonance imaging (MRI) of rectal cancer.
Methods
The data used in this study was obtained from 39 patients with primary rectal carcinoma who were scheduled for preoperative chemoradiotherapy. The modified ME model is a joint modeling of the ME model via the linear mixed effect model. First, we considered two local experts and a gating network, and the modified expert network as a liner mixed effect model. Afterward, the finding estimates were obtained via the expectation-maximization algorithm. All computation was performed by R-2.15.2.
Results
We found that two experts have different patterns. The feature of expert 1 (n = 10) had a higher baseline value and a lower slope than expert 2 (n = 29). A comparison of the estimated experts and responder/non-responder groups according to T-downstaging criteria showed that expert 1 had a more effect treatment responder than expert 2.
Conclusions
A novel feature of this study is that it is an extension of classical ME models in case of repeatedly measured data. The proposed model has the advantages of flexibility and adaptability for identifying distinct subgroups with various time patterns, and it can be applied to biomedical data which is measured repeatedly, such as time-course microarray data or cohort data. This method can assist physicians as important diagnostic decision making mechanism.
I. Introduction
Recent advances in the field of biomedical informatics have led to the use of multiple models for pattern classification and regression. The incorporation of computational techniques and artificial intelligence in medicine can be applied in the classification and prediction of disease [1,2]. For example, Spilker et al. [3] used mixture model analysis to categorize benign and malignant tumor subgroups in animal models.
Among many methods, the 'divide-and-conquer' principle, which is often used to address complex problems by dividing them into simpler problems whose solution can be combined to yield a final solution, is applied for the solution of complexities in data [4].
In applying this principle, Jordan and Jacobs [5] proposed a modular neural network architecture called mixture of experts (ME). The mixture of experts contains two networks, one is called the 'experts' network, which is a population of simple linear classifiers; the other is called the 'gating' network, which mixes the outputs of the expert network. The gating network receives input vector and produces a partition of unity at each point in the input space. The outputs of expert networks are combined by a gating network simultaneously trained to stochastically select the expert that is performing the best at solving the problem [6].
To learn the algorithm for the ME model, Jordan and Jacobs [5] proposed the expectation-maximization (EM) algorithm, which is a general statistical approximation algorithm of Dempster et al. [7]. Using this algorithm, the learning process is separated to fit with the modular structure. Also, the EM algorithm can be extended to provide an effective training mechanism for the ME model based on a Gaussian probability assumption [7].
Research in the area of using the ME model has been carried for several years. Ubeyli [8] applied it to the diagnosis of breast cancer and diabetes, Subasi [9] used electroencephalography signal classification for wavelet feature extraction, Corchado et al. [1] proposed decision support in the diagnosis of leukemia patients, and Raman et al. [10] presented an infinite mixture of experts model to find an unknown number of sub-groups within a given patient cohort based on survival analysis. Myoung et al. [11] applied the ME model to find hidden subgroups of liver cirrhosis using transient elastography data in patients with chronic liver disease. Shankaracharya et al. [12] also proposed ME modeling to identify prediabetic, diabetic, and non-diabetic individuals with high accuracy in 1,415 Indian patients.
Preoperative chemoradiotherapy (CRT) has been widely used to decrease the local recurrence rate of locally advanced rectal cancer. Lim et al. [13] suggested that perfusion magnetic resonance imaging (MRI) of rectal cancer could be useful for assessing tumoural Ktrans changes by CRT at three time points (2-5 days before CRT, end of the 2nd week of CRT, and 1-4 days before surgery). Also, they demonstrated that tumors with pre-CRT Ktrans values tended to respond favorably to CRT, particularly in terms of downstaging criteria.
On the basis of this data, we will apply a ME model to find subgroups with respect to various time trend patterns. However, it is necessary to modify the ME framework, because the classical ME model cannot be applied to repeatedly measured data. The main concept of the modified ME model is replaced with a linear mixed model in an alternative to the expert network. Then, we apply the EM algorithm for learning the modified ME model. In this study, date obtained from 39 patients with primary rectal carcinoma who were scheduled for preoperative CRT were used to test the modified model. Thus, we expect to classify patients who have various time trend patterns.
This method has a further advantage in that a modified ME model can facilitate the classification of risk groups in medical decision making problems.
The remainder of this paper is organized as follows. In the second section, the ME architecture is briefly explained, and the perfusion MRI data is described. The EM algorithm used for the modified ME architecture is presented. Also, the modified ME model is proposed for application to repeated measures data. In the third section, the results of applying the proposed ME model to the MRI data are reported. Finally, in the last section we give some concluding remarks and discuss extensions to the proposed model.
II. Methods
1. Perfusion MRI Data Overview
Preoperative CRT has been widely used to decrease the local recurrence rates of locally advanced rectal cancer. CRT can induce complete/partial pathological response and tumour downstaging due to vascular changes and cell death [14]. Lim et al. [13] monitored the permeability change effects of CRT in rectal cancer and assessed the usefulness of perfusion MRI-based pharmacokinetic parameters as potential biomarkers to predict the response to CRT in locally advanced rectal cancer [13].
In this study, this perfusion MRI data was analyzed. The data was obtained from 39 patients who were enrolled from September 2008 to February 2010, and each patient met the following criteria: clinical MR stage T3 or T4 (the tumor could be any N stage without evidence of distant metastases on other imaging techniques).
All enrolled patients were examined using MR imaging at three time points: 2-5 days before CRT (pre-CRT MRI), at the end of the 2nd week of CRT (early-CRT MRI), and 1-4 days before surgery (post-CRT MRI). The Ktrans (volume transfer constant) value was measured. It describes the transfer rate of the contrast agent from the blood plasma into the extravascular extracellular space (EES) by using Interactive Data Language (IDL; Research Systems, Boulder, Co, USA). Following surgery, a total of 19 patients did not show T-downstaging following CRT, while 20 patients showed T-downstaging, including 7 patients which had complete pathological remission (Table 1). Figure 1 shows the temporal changes of Ktrans value in all patients. Lim et al. [13] concluded that perfusion MR imaging of rectal cancer can be useful for assessing tumoural Ktrans changes as a result of CRT, and tumors with high pre-CRT Ktrans values tend to respond favorably to CRT, particularly in terms of downstaging criteria.

Distribution of responders and non-responders after surgery according to the downstaging standards
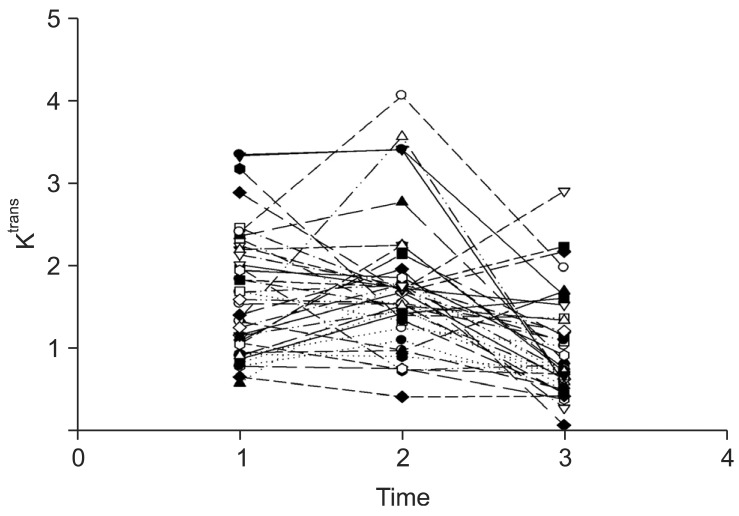
Temporal change in Ktrans by preoperative chemoradiotherapy in all patients.
2. Mixture of Expert and EM-Algorithm
In this subsection, we briefly review the ME architecture [4] and the EM algorithm [5]. Figure 2 shows a graphical representation of the ME in the expert network i = 2. This can be viewed as a tree-structured model. The ME model consists of i experts, which sit at the leaves of the tree. These experts maps the covariate space to output vector µi. It is assumed that different experts are solved in different local regions of the input space. Thus, this ME model uses the 'divide-and-conquer' principle, which addresses a complex tasks by dividing it into simpler subtasks.

A mixture of experts model.
The gating network receives the input vector x and identifies scalar outputs that are likely to approximate the partition of unity at each point in the input space. The output of the gating network is the probability gi which weighs the contributions of each expert network. Thus, the total output of the ME model is the convex weighted sum of all the output vectors produced by the expert networks [11].
All of the expert networks are linear with a single output nonlinearity which is referred to as 'generalized linear' [5,15]. The i-th expert network produces its output µi as a generalized linear function of the input x:
where Wi is a weight matrix, and function f(·) is a fixed continuous nonlinearity. Here, f(·) is generally chosen to be the logistic function or the identity function. These models are smoothed piecewise analogs of the corresponding generalized linear interactive modeling (GLIM) models [5]. The gating network is also a generalized linear function, and the i-th output of the gating network gi is the multinomial logit or softmax function of ξi [4]:

where e denotes the natural exponential,  denotes intermediate variables, and vi is a weight vector. The overall output µ of the ME architecture is calculated as,

the ME architecture can be given a probabilistic interpretation. The values of gating network gi are interpreted as the multinomial probabilities associated with the decision that terminates in a regressive process that maps x to y for an input-output pair (x, y). Once the decision has been made, resulting in a choice of regressive process i, output y is then taken from a probability density P(y|x, Wi), where Wi is the weight matrix of the i-th expert network in the model. Therefore, the total probability of observing y from x is given by mixture of the probabilities of generating y from the component densities which have multinomial probabilities:
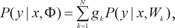
where Φ includes the expert network parameters and the gating network parameters. Given the total probability model, a learning algorithm for the ME architecture is considered as a maximum likelihood estimation problem. Jacobs et al. [4] as well as Jordan and Xu [16] proposed a learning algorithm for the ME architecture based on the EM framework, which is based on the idea of simplifying if only set of additional 'missing' variables.
Given an observed data set  , the EM algorithm is an iterative algorithm comprising two steps:
1) the expectation (E) step, which computes the posterior probabilities  (i = 1, ..., N), which can be interpreted as the probabilities P(i|xt, yt) and are given for the s-th epoch as,
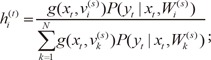
2) the maximization (M) step, which solves the following problems:
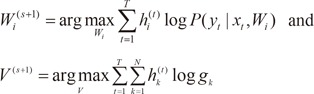
where V is the set of all the parameters in the gating network.
Therefore, the EM algorithm yields the following learning algorithm [3]:
1) For each data pair (xt, yt), compute the posterior probabilities
using the current values of the parameters.2) For each expert network i, solve the maximization problem in
 with observation
  and observation weights
  .
.3) For the gating network, solve the maximization problem in V(s+1) with observation
 .
.4) Iterate by using the updated parameter values.
3. Modified Mixture of Experts
As described in subsection 2, the ME model has two common approaches for selecting expert networks. For regression problems, the experts are linear. For binary classification problems, the experts are smoothed piecewise analogs of the corresponding GLIM models [5]. However, these models have constraints in that it is difficult to apply each expert network due to repeatedly measured data.
Therefore, our choice of the modified expert network is considered a linear mixed effect model for modeling purposes. For the repeated measurement problem, we consider the modified expert network as follows:
where β is the fixed effect of time, βi is random effect, εi~N(0, σ2) is the measured error. Parameter estimation in the modified ME model is a maximum likelihood learning problem, and the EM algorithm can be used to solve it.
III. Results
In this section, we report how we used the modified ME model to find subgroups with the Ktrans value in rectal cancer. Data was used as described by Lim et al. [13]. The Ktrans values of 39 patients who were scheduled for preoperative CRT were measured between September 2008 and February 2010. All patients were examined at three time points, and they were divided into responder/non-responder groups according to downstaging criteria. As seen in Figure 1, the overall Ktrans value decreased slightly.
We studied a modular architecture with k = 2 expert networks. That is, the ME comprised two local experts and a gating network. The output of each of the i-th experts was produced via a linear mixed effect model of the input. That is, µi = f(Wix) were linear mixed effect model with (x,θj), where θj is parameter vector. For the gating network, we have, which is gi(x,θ0) also a generalized linear function in the classical ME model, and it is used by the generic softmax function. This architecture is shown in Figure 3.
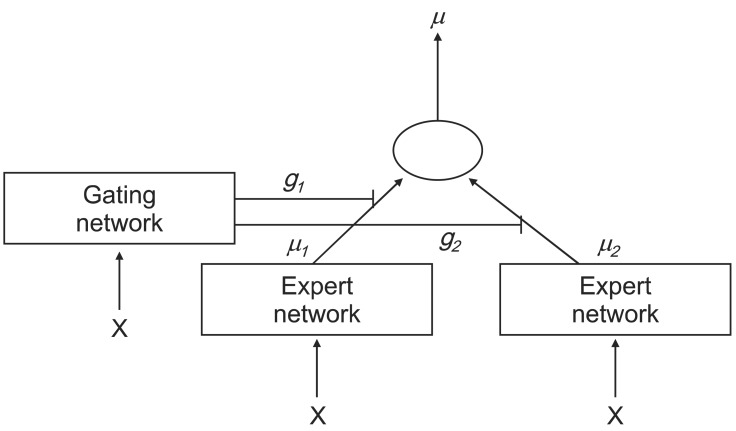
Configured mixture of experts structure for finding subgroups with Ktrans value in rectal cancer.
The initial values of the gating network, expert network, and variance were chosen randomly. All computations were performed by R-2.15.2 (software available at http://www.r-project.org).
Temporal changes in the Ktrans values of all patients are shown in Table 2. The p-values were calculated by repeated measurements using ANOVA and a two-sample t-test. At the end of the 2nd week of CRT, the mean Ktrans value of all patients was a little higher than that in the pre-CRT phase, but the difference was not statistically significant (p = 0.4846). In post-CRT phase, the Ktrans value showed a significant decrease (p < 0.0001).

Distribution of responders and non-responders after surgery according to the downstaging standards
The Ktrans values at each three time points showed a slight difference between the responders and non-responders group. The mean Ktrans value of the responder group was higher than that of the non-responder group except for the post-CRT phase (p = 0.6449).
The modified ME model with two experts was fitted to these data, resulting in the estimates (ĝ1,ĝ2) = (0.2545, 0.7455) and (β̂0,β̂1) = (3.4463,-0.6496) with expert 1, and (β̂0,β̂1) = (1,6740,-0.2116) with expert 2 (Table 3). Here, ĝ1 denotes the i-th gating network, β̂0 is the baseline value of each expert, and β̂1 is the time slope of each expert. As a result, we see that parameter of expert 1 is higher than that of expert 2. Figure 4 shows the evolution of the parameters for the first and second expert networks. The solid line represents the first parameter β̂0, and the dashed line shows the second parameter β̂1. This results shows that this modified ME model converged within 5-6 steps. Figure 5 shows the temporal changes of the Ktrans values of the estimated two experts. In particular, the horizontal axis gives the time point (pre/early/post-CRT), and the vertical axis gives the Ktrans value. These results along with Table 3 clearly show that expert 1 is characterized by more temporal change of the Ktrans value than expert 2.

Parameter estimation for the modified mixture of experts architecture in Ktrans data
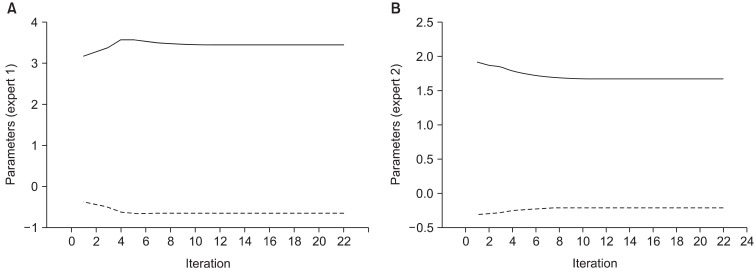
The performance of the modified mixture of experts model. (A) The evolution of the parameters for expert network 1 and (B) the evolution of the parameters for expert network 2.
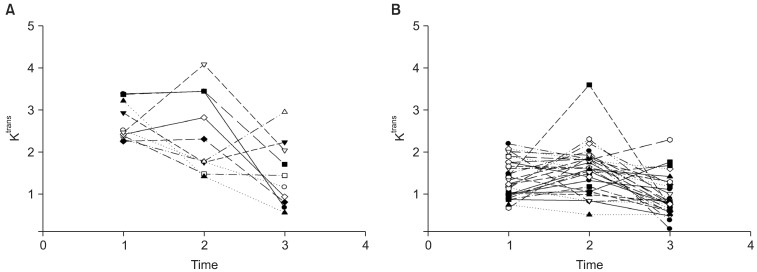
Temporal change in Ktrans by preoperative chemoradiotherapy in estimated expert 1 (A) and expert 2 (B).
A comparison of the estimated experts and responder/non-responder groups according to T-downstaging criteria is shown in Table 4. In expert 1, the responder group is much larger than the non-responder group. However, the responder group is smaller than the non-responder in expert 2. This show that expert 1 is more effectively treated responders compared with expert 2.
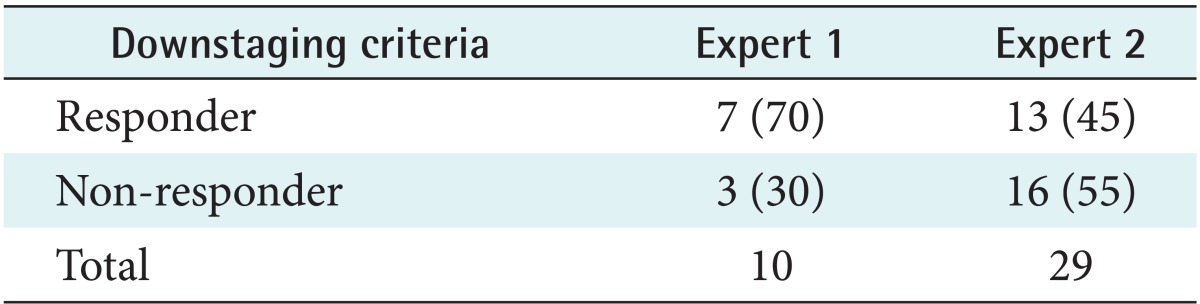
Distribution of 39 patients of responder/non-responder based on T-downstaging criteria over the two estimated experts using the proposed method
IV. Discussion
The purpose of the present research was to apply the modified ME model to find subgroups with respect to various time trend patterns. In the modified ME model, linear mixed effect models were considered to take into account time trends for repeatedly measured data. The EM algorithm was used to estimate the suggested model. To classify subgroups in perfusion MRI data, two local experts and a gating network were used in the configuration of the ME architecture.
The classification results and the values of statistical parameters were used to assess the performance of the proposed ME model. We also compared the estimated experts and responder/non-responder groups according to T-downstaging criteria. In conclusion, the advantage of using the proposed ME models lies in its flexibility and adaptability for repeatedly measured data, such as Ktrans value measured three times. The obtained results confirmed the validity of the classifiers for application in diagnostic decision support. The proposed model is expected to provide a robust method for subject classification without user intervention or bias. Future studies will be required to apply the nonlinear mixed effect model to repeatedly measured data. The number of experts was fixed to two groups (high risk/low risk) in this research, but we will be determined number of experts according to some criteria such as Akaike Information Criterion or Bayesian Information Criterion in the next study.
Acknowledgments
The author is grateful to Professor Joon Seok Lim of the Department of Radiology, Yonsei University Health System, Seoul, Korea, for providing valuable comments on this problem and data sets. This research was supported by the Basic Science Research Program through the National Research Foundation of Korea (NRF) funded by the Ministry of Education, Science and Technology (2011-0013877).
Notes
No potential conflict of interest relevant to this article was reported.