

I. Introduction
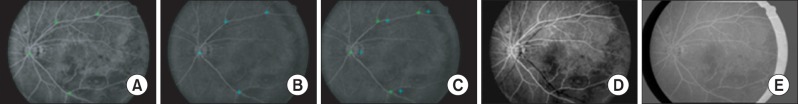
Fluorescein angiography (FAG) is an established dye tracing technique for examining retinal circulation [1]. It is useful for evaluating many disorders of the ocular fundus that affect the retina, such as diabetic retinopathy, vascular occlusions, and macular degeneration. The procedure involves first injecting a fluorescent dye into an arm vein, which appears in the blood vessels of the retina in 10-15 seconds on average. Then, as the dye passes through the retinal blood vessels, serial photographs are taken to examine retinal circulation and identify any circulation problems, such as swelling, leakage, or abnormal vessels, which the dye and its patterns will usually reveal.
Most previous studies on FAG-based diagnosis of retinal diseases have attempted to quantify retinal blood flow on the basis of several different circulation parameters. These have included blood flow velocity, arteriovenous passage time, mean circulation time (MCT), difference of arterial and venous times to maximum intensity, time to maximum intensity, and time to x% of maximum intensity. Among these, MCT, otherwise known as the mean transit time (MTT), is the most commonly used parameter. It was first defined by Hickam and Frayser [2] in their quantitative FAG studies. They used dye curves obtained by densitometric analysis of frames from FAG, which show the change in fluorescein concentration with time. MTT can be determined from such dye curves, as it expresses the average time spent by a tracer in the vascular bed or the time it takes for all blood within the vascular bed to be renewed. MTT is easily determined if the complete dye curves can be recorded. Sperber and Alm [3] developed an alternative technique for determining MTT based on an impulse-response analysis (MTTIR) from FAG. MTTIR allows analysis of badly defined dye curves and provides better reproducibility than the conventional extrapolation of the downslope of the dye.
The values of these parameters can be presented numerically and in the form of color maps to aid the diagnosis of various vascular diseases, such as stroke and heart disease [4,5,6]. For example, parametric imaging aids radiologists in stroke assessment by providing a color map of cerebral blood flow and other perfusion-related parameters from CT images of the brain. Parametric images represent values of reconstructed parameters for assumed tissue/activity models. This extends structural imaging towards functional imaging. Although considerable effort has been devoted to parametric imaging, there have been few methods proposed for parametric imaging using fundus FAG. In this study, a protocol for generating a functional parametric image of retinal circulation was developed to aid the diagnosis of retinal diseases using FAG.
II. Methods
FAG images were acquired using a fundus camera, were preprocessed to remove noise and text messages irrelevant to analysis, and were registered to reference images semi-automatically. At each region of interest (ROI) selected on retinal blood vessels, a time-intensity curve was constructed using a gamma-variate function. Perfusion parameters were extracted from the time-intensity curves using truncated singular value decomposition (TSVD) and presented as functional parametric images.
1. Image Acquisition
FAG was performed with a fundus camera (Canon CF-60UVi; Canon Inc., Tokyo, Japan). An eye with symptoms of decreased vision or visual-field disturbance and evidence of retinal vein occlusion on fundus examination was chosen. After flushing with 3 mL of normal saline to ensure adequate passage, 3 mL of 25% sodium fluorescein was administered to the antecubital vein. The optic disc was focused and centered in the 30o observational field during angiography recording. Digital images were taken at 2-3 seconds intervals during the first minute, 15-30 seconds intervals up to 3 minutes, and 1-minute intervals up to 5 minutes.
2. Preprocessing of FAG Images
The background in FAG images includes noisy pixels and textual information, such as patient information and the date and time of digitizing, which are unnecessary for subsequent analysis and waste processing time during analysis. Hence, FAG images were preprocessed to remove such irrelevant information by the application of a removal mask to each FAG image. The removal mask was created from a reference image, that is, the brightest image in a set of sequential images with all blood vessels completely filled with fluorescein dye. The same reference image was also used for the registration of FAG images. The steps for the preprocessing of FAG images are summarized as follows:
(1) Create a binary mask by applying fuzzy thresholding of Huang and Wang [7] to the reference image.
(2) Perform morphological opening on the binary mask using a circle kernel of size 5.
(3) Apply the final binary mask to the original FAG images.
3. Registration of Sequential FAG Images
The captured FAG images are not aligned due to eye movements during image acquisition. To trace the change in intensity over time at specified anatomical locations, sequential FAG images need to be registered prior to quantitative analysis. Automatic image registration is generally conducted using area-based or feature-based approaches [8]. In area-based approaches, the pixel intensities in two images are compared and matched using a similarity metric, such as mutual information and cross correlation. Feature-based approaches instead perform image registration using robust features, such as optic discs, blood vessels, and/or Y-features like bifurcations of retinal vasculature.
However, automation of FAG image registration is still problematic due to the characteristics of FAG images. The major issue relates to the nonlinear intensity differences between sequential FAG images caused by uneven illumination on the retinal surface and potential retinal diseases. Leakage or blockage of fluorescein in various phases of FAG due to pathologic conditions may cause severe changes in the appearance of the retina, such as obscure vasculature patterns. The performance of automatic image registration is also affected by low image contrast, which is a common attribute of images from the early arterial or late venous phases of the fluorescein sequence [9,10].
In this study, we formulated a semi-automatic method for robust and accurate image registration. The method registers all images in a given set to the reference image defined in the preprocessing step using control points selected manually [11]. Since retinal images were generated by projection of the retinal space onto the image plane, a projective transformation was used as a transformation model for image registration. The projective transformation was computed using four pairs of control points manually selected in the reference and moving images. The control points were selected at major arterial bifurcations that were clearly visible in all phases of FAG. To assist the manual selection of control points in low-contrast images, contrast-limited adaptive histogram equalization (CLAHE) [12] was applied to all images to enhance the local contrast of images. The steps for image registration are summarized as follows:
(1) Apply the CLAHE method of contrast enhancement to all FAG images.
(2) Select four control points at arterial bifurcations in each contrast-enhanced image.
(3) Compute the parameters of the projective transformation using four pairs of corresponding control points selected in the reference and moving images.
(4) Register moving images to the reference image using the computed projective transformation.
4. Parametric Imaging
Based on the indicator dilution theory for intravascular contrast agents, the time-intensity curve, CROI(t), of a fluorescein dye in the ROI was modeled using a convolution integral as follows: where RBF is the retinal blood flow-related parameter, CAIF(t) is the time-intensity curve of the arterial input function (AIF), and R(t) is the residue function which is the relative amount of the fluorescein dye in the ROI. Assuming an idealized case of perfusion where a unit area bolus of a fluorescein dye is instantaneously injected (i.e., R(0) = 1) and subsequently washed out by perfusion (i.e., R(Ōł×) = 0), RBF can be quantified by solving Eq. (1) through deconvolution between CAIF(t) and CROI(t).

Since the coexistence of re-circulated and remaining contrast agents affects the decreasing part of the time-intensity curve, CAIF(t) and CROI(t) need to be fitted to the gamma-variate function. The parameters of the gamma-variate function can be estimated using the Levenberg-Marquardt method for nonlinear regression.
Because R(t) is the solution to an ill-posed problem, noise in the data is magnified during the application of the least squares method to such an extent that the solution is of no practical value. A well-known approach to resolve such an issue is regularization, for which several methods have been proposed to stabilize the solution. Recently, Ostergaard [5] introduced a regularization method known as TSVD, which is an algebraic approach to solving Eq. (1) based on singular value decomposition (SVD) [13,14].
1) Estimation of the arterial input function
With all FAG images registered, an ROI was manually defined on the retinal artery near the optic disc (Figure 3A). The average pixel intensity of the ROI in each FAG image was quantified and plotted against the elapsed time (Figure 3B). With the average pixel intensities, the time-intensity curve of the AIF, CAIF(t), was modeled in the form of a gamma-variate function as follows: where t is the elapsed time after injection, K is a constant scale factor, AT is the arrival time of the contrast agent, IBase is the base intensity, and ╬▒ and ╬▓ are shape parameters that depend on the architecture of retinal vasculative and the blood flow, respectively. Here, IBase can be defined as the average pixel intensity in the ROI prior to the arrival of the contrast agent or a user defined value. As shown in Figure 3B, a representative set of time-intensity data points includes the effects due to the recirculation of the contrast agent.

A re-circulation starting point was defined as the first minimum point after the peak point. To eliminate the effect of recirculation, any data points collected after the re-circulation starting point were not used in the modeling. The curve fitting was performed using the Levenberg-Marquardt algorithm for nonlinear regression. The iteration was stopped when the difference between successive values of Žć2 was less than 0.01 and the value of Žć2 had not increased during the last 8 iterations.
2) Quantification of RBF and MTT with TSVD
Assuming that the functions CAIF(t) and R(t) in Eq. (1) are constant over a short period of time ╬öt. Eq. (1) is reduced to where RBFx is the blood flow-related parameter at pixel x, Cx(t) is the concentration of tracer in the venous output, Rx(t) is the residue function, and ti and N denote the time of the i-th frame and the total number of frames of FAG, respectively. Assuming an idealized case of perfusion, a unit bolus of the contrast agent is injected as an arterial input at the beginning (i.e., Rx(0) = 1), and it begins to leave the vascular network after a finite period (i.e., R drops to zero). If the product of RBFx and Rx(t) can be estimated, RBFx can be obtained at t = 0. Here, Cx(t) and CAIF(t) were estimated at N equally spaced time points t1, t2, ŌĆ”, tN with the time increment ╬öt. The convolution in Eq. (3) can then be formulated as a matrix equation: where
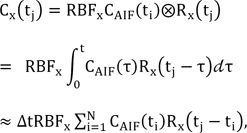
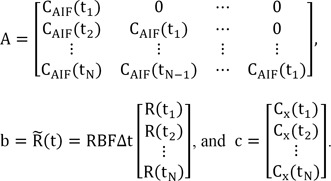
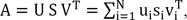
Note that matrix A is a Toeplitz matrix (i.e., it has constant diagonals, Aij = Ai-1,j-1 for all 1Ōēżi, jŌēżN). Using the standard SVD technique, matrix A can be decomposed to where the orthogonal matrices U and V consist of the left and right singular vectors, i.e., U = (u1, ŌĆ”, uN) and V = (v1, ŌĆ”, vN). Here, S = diag(s1, ŌĆ”, sN) is an N├ŚN diagonal matrix where the diagonal elements si are the corresponding nonnegative singular values of matrix A in non-increasing order, i.e., s1Ōēźs2ŌēźŌĆ”ŌēźsNŌēź0. With the inverse matrix A-1 and Eq. (3), matrix b, and consequently R(t), can be calculated as That is, Eq. (6) is used to solve b, which contains the elements of  (t). Estimates of RBFx can be obtained from the maximum of the scaled residue function (t) calculated from Eq. (6), and then MTT can be calculated from (t):
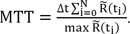
 (t). Estimates of RBFx can be obtained from the maximum of the scaled residue function (t) calculated from Eq. (6), and then MTT can be calculated from (t):

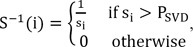
However, the linear solution of Eq. (6) is very sensitive to noise in A because the small singular values mainly represent the noise, and the reciprocal of the small singular value is a very large value, which amplifies the error. Using TSVD, the small singular values are eliminated to limit the effects of noise, and S-1, which represents a diagonal matrix that approximates the inverse matrix of S, can be expressed as for i = 0, 1, ŌĆ”, N. Here PSVD is the cut-off threshold, and it should be noted that the MTT values computed using this technique highly depend on the choice of PSVD; a large PSVD results in a smoother residue curve, with the sacrifice of less accurate (usually higher) MTT values, and a small PSVD will give more accurate MTT values, but the computed residue function will be less smooth. Usually, PSVD is set in the range of 5%-20% of the maximum singular value of S. In this paper, it is set at 10% of the maximum singular value of S.
III. Results
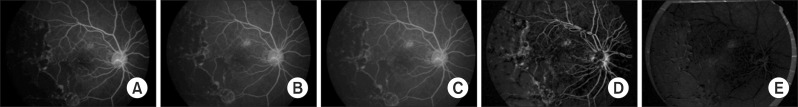
First, the proposed model removed the noisy background pixels from FAG images and computed the parameters of the transformation using control points selected from the enhanced images. The system registered moving images to the reference image using the computed transformation parameters. Figure 4 shows the registration results. Figure 4A-C show the reference, moving, and registered moving images, respectively. Figure 4D and E show the difference images between the reference image and the moving image, respectively, before and after registration. Image (Figure 4D) shows significant differences in the edge areas of blood vessels, while image (Figure 4E) shows very little difference.
After registering FAGs to the reference image, the AIF was estimated from the intensity changes within the selected ROIs. Figure 3A shows the rectangular ROI selected on the retinal artery in the vicinity of the optic disc, and Figure 3B shows the averaged intensities of the pixels inside the ROI plotted according to the time sequences. Analyzing the dot plot, we determined the 13th point (around 40 seconds) as the starting point of the recirculation phase. The AIF was estimated with the data up to 40 seconds by fitting the gamma-variate function. The estimated result of AIF is

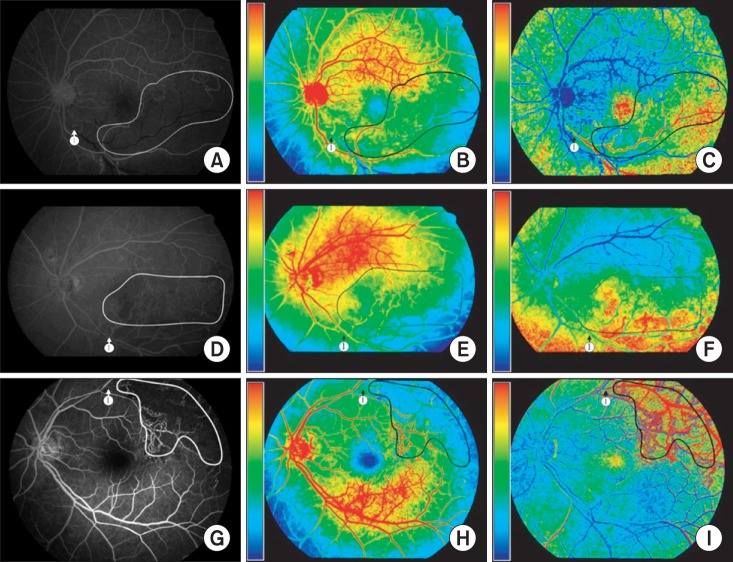
After the estimation of AIF, the parameters of RBF and MTT were computed using deconvolution analysis based on TSVD. Figure 5 show the RBF and MTT parametric images in FAGs from patients with branch retinal vein occlusion (BRVO). In Figure 5A-C, BRVO occurred at the crossing of the retinal artery and vein below the optic disk, and circulation of the retinal vein distal to the site of occlusion was blocked. With the blocked vein, areas of capillary nonperfusion were detected in the inferior-temporal quadrant of the optic disk. The areas of capillary nonperfusion were well demarcated in the BF and MTT images in sharp contrast to the normally perfused superior-temporal quadrant of the optic disk. These images not only identify areas of capillary nonperfusion, but also monitor changes in areas of capillary nonperfusion to aid the decision to apply initial or additional laser treatment. Similarly in Figure 5D-F, the branch retinal vein draining the inferior-temporal area was blocked, and areas of capillary nonperfusion were detected at the same location. In Figure 5G-I, the branch retinal vein draining the superior-temporal area was occluded, and areas of capillary nonperfusion were detected at the same location.
IV. Discussion
FAG is currently the most useful diagnostic modality for examining retinal circulation, and it is frequently used for the evaluation of patients with diabetic retinopathy, occlusive diseases, such as retinal venous and arterial occlusions, or wet macular degeneration. However, FAG has inherent limitations which hinder its usefulness to physicians. First, it requires special training to interpret the FAG without error, even for ophthalmologists. Second, because FAG provides only black and white images, it is hard to provide an objective diagnosis without interobserver variability. The clinical diagnosis of retinal circulatory diseases depends completely on the subjective evaluation of the ophthalmologist; hence, the objective method proposed in this study could enhance diagnostic accuracy and prevent inaccurate diagnosis that could occur due to lack of experience in interpreting FAG images. Third, FAG does not provide quantifying data of retinal blood circulation. An objective system quantifying retinal blood flow would also be useful in monitoring subtle changes within the retinal circulation to aid in the clinician's decision to apply treatment or observe conservatively without additional treatment.
In this study, a method for objectively evaluating retinal circulation by quantifying circulation-related parameters, such as MTT and BF, was proposed. Using this method, FAG images were preprocessed and registered semi-automatically. From a registered set of FAG images, the AIF was estimated using gamma-variate fitting. Then, the parameters were computed by deconvolution based on TSVD and presented as parametric color images. The color-coding system is helpful to interpret the status of retinal blood circulation, and it provides the quantifying data of retinal ischemia without interobserver variability. This system easily provides the status of retinal blood circulation both qualitatively and quantitatively. It also helps to standardize FAG interpretation, and it may contribute to network-based telemedicine systems in the future.
The major limitation of parametric images created by the proposed method is the false indication of retinal nonperfusion in regions near the edge of the fundus. This is due to the non-uniformity of illumination in FAGs caused by the eye geometry. The illumination in FAG images is usually high in the center region and decreases towards the peripheral regions of the fundus. In other words, the same concentration of fluorescein dye in different regions may show different pixel intensities due to uneven illumination. Many approaches for correcting the uneven illumination in the fundus use local contrast enhancement methods to equalize the non-uniformity of intensity [15,16,17]. These local contrast enhancement methods, however, are not appropriate because these methods improve the visibility of local details in images. To eliminate non-uniform illumination from angiogram images, Hipwell et al. [18] used a 'flood' image, which is the illumination mask of each digitized angiogram image. This image records the illumination when no negative is present, and it generally consists of a central 'white' (value 255) region which fades towards the periphery of the image due to the reduced light level. Each digitized image is then scaled by 255 and divided by this flood image. The centre of the image remains unchanged, while the periphery is amplified, correcting for the reduction in illumination. Although this method can reduce non-uniform illumination, it does not guarantee brightness consistency between successive images. Hence, the accuracy of the estimation of parameters for retinal circulation may be reduced due to the modification of intensities in each individual image. In this study, these methods were tested, but were found to be ineffective, or they negatively affected the outcome.
Another limitation of the proposed method is the potential error associated with manual selection of the control points at bifurcations of retinal blood vessels. Manual operation was adopted since automatic detection of control points may be inaccurate in FAG images which have too low contrast or show severe changes in the appearance of retinal vasculature due to pathologic conditions. Misaligned control points manually selected in sequential FAG images may decrease the accuracy of estimated parameters. This issue may be resolved by automatically relocating a manually selected control point to the center of vascular bifurcation using an intensity gradient map around the control point [19].
The robust performance of deconvolution is essential for the accurate estimation of perfusion parameters. Since the results of deconvolution are sensitive to noise, we conducted a deconvolution based on TSVD with a threshold value fixed at 10% of the maximum singular value. To further improve the accuracy of estimated perfusion parameters, the TSVD method may need to be combined with robust methods for selecting a truncation threshold, such as generalized cross validation and the L-curve criterion.
Despite the limitations of the current implementation, the method proposed in this study may play a major role in the quantification of retinal circulation. Compared to existing methods for the quantification of retinal circulation that compute parameters based only on the time-intensity curve of a fluorescein dye, this study incorporates an additional numerical deconvolution method to improve the accuracy of quantification. In conclusion, the proposed method in this study will be highly useful in evaluating the retinal condition of patients and diagnosing eye diseases.