Wave Detection in Acceleration Plethysmogram
Article information
Abstract
Objectives
Acceleration plethysmogram (APG) obtained from the second derivative of photoplethysmography (PPG) is used to predict risk factors for atherosclerosis with age. This technique is promising for early screening of atherosclerotic pathologies. However, extraction of the wave indices of APG signals measured from the fingertip is challenging. In this paper, the development of a wave detection algorithm including a preamplifier based on a microcontroller that can detect the a, b, c, and d wave indices is proposed.
Methods
The 4th order derivative of a PPG under real measurements of an APG waveform was introduced to clearly separate the components of the waveform, and to improve the rate of successful wave detection. A preamplifier with a Sallen-Key low pass filter and a wave detection algorithm with programmable gain control, mathematical differentials, and a digital IIR notch filter were designed.
Results
The frequency response of the digital IIR filter was evaluated, and a pulse train consisting of a specific area in which the wave indices existed was generated. The programmable gain control maintained a constant APG amplitude at the output for varying PPG amplitudes. For 164 subjects, the mean values and standard deviation of the a wave index corresponding to the magnitude of the APG signal were 1,106.45 and ±47.75, respectively.
Conclusions
We conclude that the proposed algorithm and preamplifier designed to extract the wave indices of an APG in real-time are useful for evaluating vascular aging in the cardiovascular system in a simple healthcare device.
I. Introduction
The second derivative of a photoplethysmography (PPG) signal, which is called the acceleration plethysmogram (APG), provides important information regarding arterial stiffness[1,2]. Increased stiffness is associated with most cardiovascular risk factors and established atherosclerosis. Therefore, a noninvasive technique has been developed and validated for evaluating arterial stiffness with the analysis of the APG waveform [3]. For wave analysis, the peak of each wave must be measured from the baseline, with the values above the baseline being positive and those under it being negative. It is important to correctly detect the height of each wave before evaluating vascular aging or screening for arteriosclerotic disease. To improve the wave detection rate, a variety of methods such as the knowledge-based detection algorithm, wavelet transform, and linear model comparison have been investigated [4,5,6,7]. However, there are still a lack of studies focusing on automatic detection for the a, b, c, and d waves in APG signals. Therefore, this investigation is aimed at developing a wave detection algorithm including a preamplifier based on a microcontroller. To validate the clinical reliability of the developed algorithm and preamplifier, a performance evaluation was conducted for 168 subjects [8]. The precise shapes of the PPG must be mathematically differentiated from one heartbeat to another to clarify the wave inflection providing information on the vascular status. The high-order derivative on-chip may contain uncertainty in the wave indices for every peak because the rate of change of the PPG with respect to time reflects the gradient of the curve. For discrete signals, the derivative exhibits a small finite change in time, resulting in missing peaks with undesired delay. Because of this uncertainty, high-order mathematical differentials cannot be used to precisely identify each wave of APG. To solve this issue, in this study, the low amplitude of a PPG signal was amplified on-chip and converted to a continuous signal using an analog filtering method off-chip. In addition, a wave detection algorithm was introduced with the design of a preamplifier based on a microcontroller (MSP430F6638; Texas Instruments, Dallas, TX, USA).
II. Methods
1. System Architecture
Figure 1 shows the system configuration, which was divided into two parts: one part inside the microcontroller (on-chip) and one part outside the microcontroller (off-chip). The on-chip part consisted of a digital filter, mathematical differentials, auto gain control, and a wave detection algorithm. The off-chip part consists of the 1st order active high pass filter (HPF) with preamplification, a Sallen-Key low pass filter, and an light emitting diode (LED) drive with a current controlled amplitude circuitry using the pulse width modulation (PWM). A digital infinite impulse response (IIR) notch filter was designed for the removal of 60 Hz interference from the power line. Mathematical differentials were determined to generate the APG, elicit inflection points on the APG, and stabilize the baseline. Auto gain control played an important role in maintaining a constant APG amplitude, and a wave detection algorithm was developed to determine the final wave indices of the APG by analyzing the outputs of four differentials. The transfer function for the 1st order HPF with fixed gain in Figure 2 was


System configuration based on a microcontroller. An analog to digital converter, digital to analog converter, and pulse width modulation (PWM) timer provided by the microcontroller were used to generate the photoplethysmography and to develop a wave detection algorithm. LED: light emitting diode, HPF: high pass filter, LPF: low pass filter.
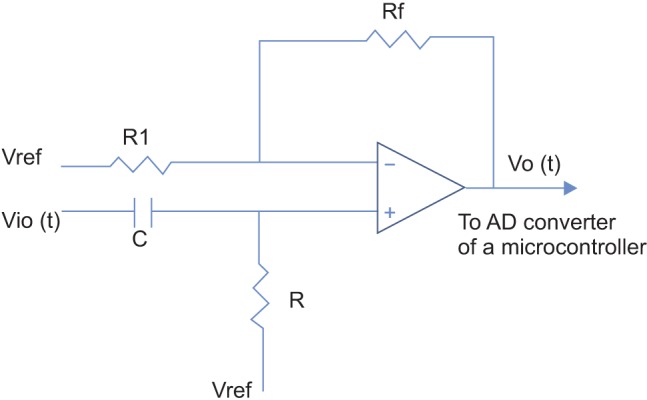
A 1st order high pass filter with a cutoff frequency of 0.31 Hz and a fixed gain of 511. AD converter: analog to digital converter.
where ω = 2πfc is the angular frequency formed by the elements of the positive input terminal. A high pass RC filter with a cutoff frequency (fc) of 0.31 Hz performed the DC rejection. The gain (G) of the system was calculated as the non-inverting amplifier using the following equation, resulting in approximately 511. G depended on ω, but is only weakly influenced because of the very low input frequency.

A two-pole Sallen-Key low pass filter was utilized off-chip to convert the discrete signal on-chip to a continuous signal, as shown by the basic schematic diagram in Figure 3. The structure included two resistors, R1 and R2, two capacitors, C1 and C2, and a nonphase-inverting amplifier of voltage gain, Gv. One advantage of this setup is its ability to operate with an amplifier gain of unity (Gv = 1). Additionally, Gv = 1 provided high linearity even when the applied input signal amplitude is relatively large. The transfer function (Equation (3)) and the equivalent function (Equation (4)) corresponding to passive RLC components are as follows.


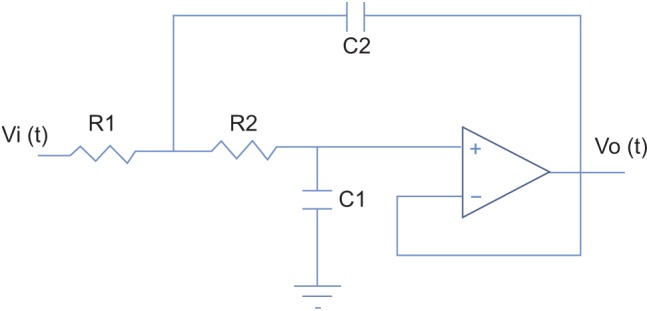
A 2nd order active Sallen-Key low pass filter with a gain of unity.
where s represents a Laplace operator, ζ is determined to be 0.7 as a critical damping parameter to avoid any oscillation when R1 = R2 and C1 = 2*C2, and ωo represents the natural frequency. The cutoff frequency (fc) of 28 Hz was determined from the following equation (Equation (5)). The choice of fc = 28 Hz is appropriate because most of the vascular information from the PPG is contained within such a band.

The 1st and 3rd derivatives of the PPG signal performed on-chip were applied to each 2nd order Sallen-Key low pass filter to produce a continuous signal for further derivative processing. Therefore, the 2nd and 4th derivatives could be smoothly determined on-chip without any loss of the inflection points in the PPG signal. A reference voltage (Vref = 1.65 V) in the preamplifier was needed, which was provided by a single power supply of 3.3 V.
2. Acceleration Plethysmogram
PPG signals are detected on the skin's surface using a fingertip optical sensor. For this purpose, noninvasive optical sensors consists of a pair of small, inexpensive LEDs-typically a red LED at approximately 660 nm and an IR LED at approximately 940-960 nm and a single, highly sensitive silicon photodetector. These wavelengths are absorbed when light is transmitted through the peripheral vascular bed. The magnitude of a PPG depends on the amount of blood ejected from the heart into the peripheral vascular bed with each cardiac cycle, the optical absorption of the blood, the composition and color of the skin and underlying tissues, and the wavelengths used to illuminate the blood [9,10]. PPG signals are often very small and typically contain unwanted noise as well as meaningful vascular information. It is important to detect the inflection point of a PPG waveform reflecting vascular aging during the cardiac cycle. Figure 4 shows a flowchart for converting an original PPG signal to an APG waveform for the wave detection algorithm. The 1st to 4th order derivative waves of the original PPG signal were determined to facilitate wave detection during the phase of the inflections. In particular, the pulse train generated by the result of the 4th order derivative determines the area corresponding to the inflection points. Each area in the high state and low state of the pulse train has a corresponding wave index. Gain control was performed by simultaneously adjusting both the 1st and 2nd derivative amplitudes, compared to a predetermined amplitude level. The a peak of the 2nd derivative was monitored in real-time, and when the a peak was higher or lower than a predetermined level, the output of the 1st derivative was adjusted in the on-chip software to maintain a constant APG amplitude. Figure 5 shows the wave contour of a PPG signal, its first derivative, and its second derivative wave (APG). The PPG waveform consists of one systolic wave and one diastolic wave, whereas the APG waveform consists of four systolic waves (a, b, c, and d waves) and one diastolic wave (e wave) [6]. The a, b, c, d, and e waves correspond to early systolic positive wave, early systolic negative wave, late systolic reincreasing wave, late systolic redecreasing wave, and early diastolic positive wave, respectively [11].

Flowchart of the wave detection algorithm, which consisted of two stages: gain control regulating the output peak of the 1st derivative when the APG amplitude is higher or lower than a predetermined level and a pulse train determining the areas in which the wave indices existed based on the 4th derivative analysis. PPG: photoplethysmography, APG: acceleration plethysmogram.

Fingertip photoplethysmogram signal measurement; (top) fingertip photoplethysmogram, and (middle) first derivative wave and (bottom) second derivative wave of the photoplethysmogram.
3. LED Drive and Photo-Detector
Figure 6 shows the initial driver for the excitation of the red LED with a PNP transistor, as well as the RC filter with a buffer on the receiver. The duty cycle of PWM for every 1 ms is derived from the microcontroller and controls the diode current (Id) to prevent saturation of the PPG signals. The off-duty cycle in which current flowed ranged from 6% to 20%, resulting in 94% to 80% of an on-duty cycle corresponding to current flow due to the PNP transistor. A high input impedance with the RC filter in the positive input terminal of the operational amplifier (opamp) was proposed. The RC filter provided a continuous time signal by smoothing the excitation pulse detected by the photodiode and achieved a low pass cutoff frequency of 15.9 kHz, as determined by choosing appropriate R and C values. These values depend on the maximal duty cycle and excitation frequency to provide adequate continuity of the signal. Therefore, care should be taken in choosing the R and C values. One shortcoming with this filter was its passive RC configuration, which necessitated a buffer in its opamp to provide proper loading for the next stage.
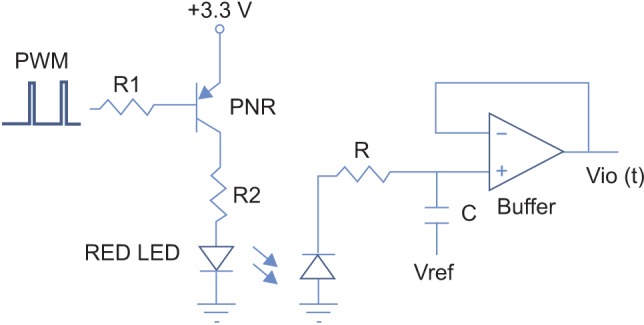
PWM LED drive using a PNP transistor for current control, an RC filter, and a buffer on the receiver. PWM: pulse width modulation, LED: light emitting diode.
III. Results
1. Digital Filtering
A digital IIR notch filter was applied to remove 60 Hz from the PPG signal at a sampling frequency of 1,000 Hz. Power line interference can arise in the preamplifier during its operation due to the presence of a power line, which primarily uses 60 Hz except in Europe and Japan. The interference arising from these lines mainly affected the PPG signal. The advantages of IIR filters include a similar analog filter counterpart and better performance than a finite impulse response (FIR) filter for the same order; however, the disadvantages include sensitivity to filter coefficients. The IIR coefficients of the 2nd order Butterworth filter were calculated using MATLAB (MathWorks Inc., Natick, MA, USA). The frequency and phase responses of the filter are shown in Figure 7. The filter achieved a desired sharpness of response with -80 dB at 60 Hz. Figure 8 shows a comparison of a PPG signal before and after application of the IIR notch filter on-chip.
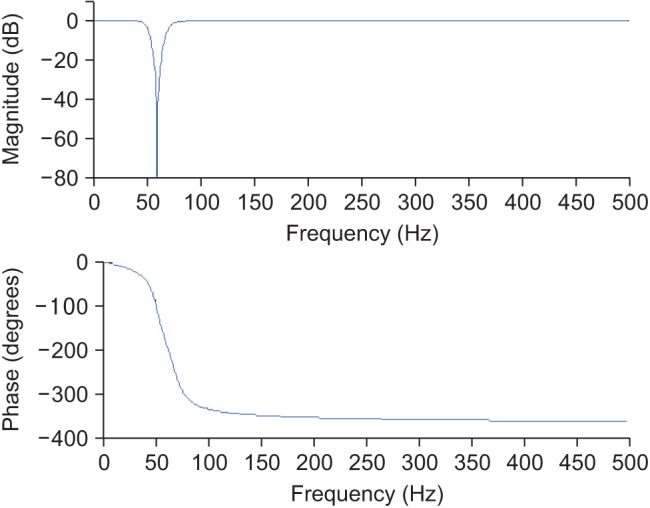
Magnitude response (top) and phase response (bottom) of the IIR 60 Hz notch filter.

Two beats photoplethysmography (PPG) signal with 60 Hz power line interference (top) and the IIR filtered PPG (bottom).
2. Wave Detection Algorithm
The red LED was operated during the on-duty cycle (80%-94%) of the PWM and its pulse power consumption was set to approximately 8 mA. As the tip of the index finger was placed onto the sensor, the preamplifier was excited, after which the input voltage range of the AD converter on-chip was automatically adjusted to control the gain of the PPG signal. The settling time for optimal APG generation was approximately 6 seconds, which was adequate because the detection algorithm of the wave indices started after 8 seconds. The distinguishing features of the APG signal were analyzed using the a, b, c, and d wave indices to predict the vascular status. Figure 9 shows an APG waveform and the pulse train processed on-chip to demonstrate the consistency of the amplitude and the positions of the b, c, and d wave indices. The gain control algorithm maintained a constant APG amplitude for the a wave. However, the amplitude changed by an average of 10% from person to person and from finger to finger, as shown in Table 1. In a previous study [8], the PPGs for 168 subjects with a mean ± standard deviation age of 58.1 ± 12.6 years ranging from 22 to 86 years in age, were measured using a PPG device (TAS9 VIEW; IEMBIO Co. Ltd., Chuncheon, Korea) for fingers. A PPG recording was obtained for a duration of 20 to 60 seconds, and the APG signal was simultaneously obtained. The box-and-whisker plot in Figure 10 displays a graphical statistical summary of the fluctuation of the a peak. The central box represents the values from the lower to upper quartile (25% to 75%). The middle line represents the median, and the horizontal line extends from the minimum to the maximum value. No outside values were observed, defined as a value that is smaller than the lower quartile minus 1.5 times the interquartile range or larger than the upper quartile plus 1.5 times the interquartile range. For the a wave index (a peak), the arithmetic mean and standard deviation were 1,106.45 and ±47.75, respectively. The statistical characteristics of the measured a peak are listed in Table 1. The wave detection algorithm used the pulse train to improve the successful detection rate. The pulse train was generated when the slope of the 3rd order derivative of the PPG signal, which is the 4th order derivative, was higher than a predetermined threshold (20 mV). Consequently, the area of interest in which the a, b, c, and d wave indices existed was determined as shown in Figure 9 (top). The S area represents the interval to the rising edge of the first pulse after the detection of the a wave index (a peak), which corresponds to the discovery of the minimum of the b wave index (b peak). The A area represents the interval between the rising edge and the falling edge in the same first pulse, which corresponds to the discovery of the maximum of the c wave index (c peak). The B area represents the interval between the falling edge and the rising edge of the second pulse, which corresponds to the discovery of the minimum of the d wave index (d peak). Figure 9 (bottom) demonstrates the local minima and maxima of the b, c, and d wave indices in the APG signal, and the a wave index (a peak) was found from the global maximum.

Acceleration plethysmogram (APG) signal and its pulse train. The S, A, and B areas of the pulse train correspond to the b, c, and d wave indices, respectively.
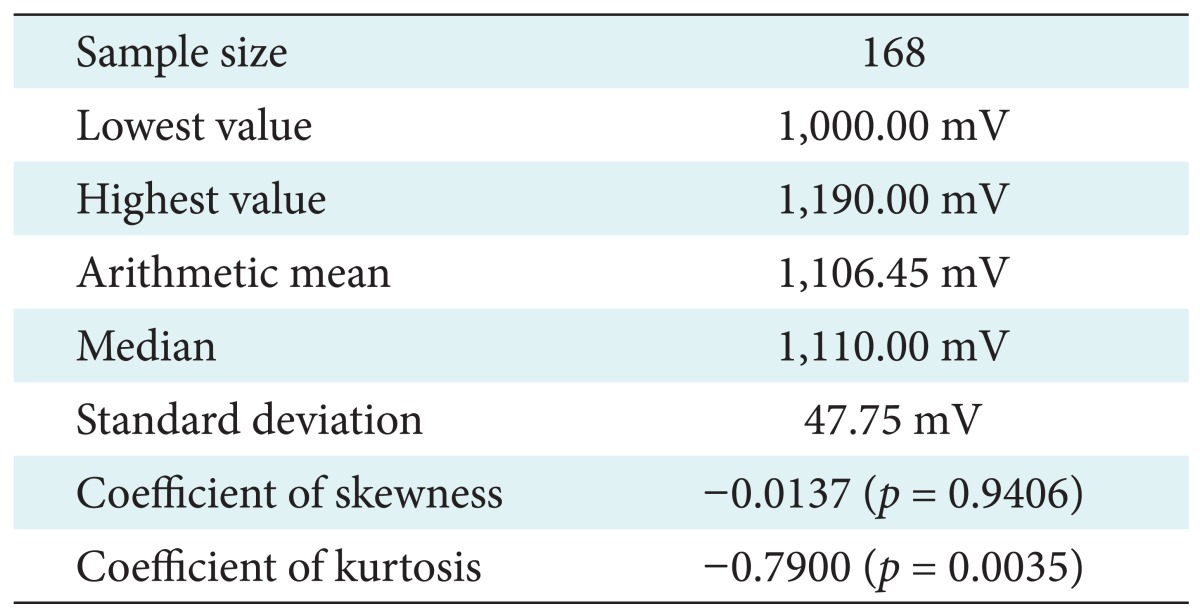
Summary statistics of the a peak

A box-and-whisker plot summarizing all of the a peaks.
IV. Discussion
For the proposed preamplifier and algorithm, no detection errors were found, even in the very low amplitude peaks of the original PPG signals and their non-stationary waves. We produced stationary APG signals to improve the detection rate of all of the wave indices (the a, b, c, and d wave peaks). The application of a two-pole Sallen-Key low pass filter off-chip for the 1st and 3rd order derivatives would allow the accurate, computationally simple algorithm to be used for real-time healthcare applications. In a clinical test with 168 subjects [8], the arterial stiffness index corresponding to the detected wave indices was found using the proposed detection wave algorithm. However, detection errors arose from the APG signals collected in a noisy environment with movement noise, extremely low amplitudes of less than 10 mV, and heart rates higher than 120 bpm. The PPG signals were sampled at a high rate (at least 500 Hz) to capture the b, c, and d wave indices after finding the derivative. The stationary APG signals were evaluated in terms of the mean value and standard deviation of the a wave index, instead of the b, c, or d wave indices, because the a wave index reflects the magnitude of the APG waveform. A digital IIR notch filter on-chip could be applied to medical instrumentation systems to eliminate unwanted narrowband interference with a known frequency, which could remove any interference from a 60 Hz power line. In addition, auto gain control could maintain the amplitude of the APG signal. In future work, the proposed algorithm should be verified in a study of unhealthy subjects such as those with arrhythmia and hyperlipidemia, in which the PPG signals change significantly according to the patient's health status.
Acknowledgments
This work was supported by the Hallym University Research Fund (No. HRF-G-2013-4).
Notes
Conflict of Interest: No potential conflict of interest relevant to this article was reported.