Automatic Four-Chamber Segmentation Using Level-Set Method and Split Energy Function
Article information
Abstract
Objectives
In this paper, we present an automatic method to segment four chambers by extracting a whole heart, separating the left and right sides of the heart, and spliting the atrium and ventricle regions from each heart in cardiac computed tomography angiography (CTA) efficiently.
Methods
We smooth the images by applying filters to remove noise. Next, the volume of interest is detected by using k-means clustering. In this step, the whole heart is coarsely extracted, and it is used for seed volumes in the next step. Then, we detect seed volumes using a geometric analysis based on anatomical information and separate the left and right heart regions with the power watershed algorithm. Finally, we refine the left and right sides of the heart using the level-set method, and extract the atrium and ventricle from the left and right heart regions using the split energy function.
Results
We tested the proposed heart segmentation method using 20 clinical scan datasets which were acquired from various patients. To validate the proposed heart segmentation method, we evaluated its accuracy in segmenting four chambers based on four error evaluation metrics. The average values of differences between the manual and automatic segmentations were less than 3.3%, approximately.
Conclusions
The proposed method extracts the four chambers of the heart accurately, demonstrating that this approach can assist the cardiologist.
I. Introduction
Computed tomography (CT) is an imaging procedure that uses X-ray technology to produce tomographic images of specific objects. To produce CT volume of data, the patient is placed inside a tube. This tube emits X-rays toward the center of the cylinder. The X-rays pass through the body, and the intensity is measured on the other side. Then, reconstruction is performed to actually obtain a three-dimensional (3D) image. CT distinguishes bones better than organic tissues. The muscles and cavities of specific organs are not well differentiated, both appearing in similar gray tones on the CT scan.
The heart is a muscular organ about the size of a closed fist that functions as the body's circulatory pump. It takes in deoxygenated blood through the veins and delivers it to the lungs for oxygenation before pumping it into the various arteries, which provide oxygen and nutrients to body tissues by transporting the blood throughout the body. The heart is located in the thoracic cavity medial to the lungs and posterior to the sternum.
Computed tomography angiography (CTA), magnetic resonance imaging (MRI), and single-photon-emission computed tomography (SPECT) are widely used, non-invasive cardiac imaging modalities. Compared with other modalities, CTA can provide more detailed anatomic information of the heart chambers, vessels, and coronary arteries due to its higher spatial resolution [1]. Therefore, CTA is widely used in image segmentation [2] because it presents more detailed anatomic information of organs. Cardiac CTA is commonly employed for cardiac diagnosis. The disorders of the blood vessels of the heart often cause cardiovascular diseases [3], and heart segmentation from CTA has been used to detect them.
Several methods for automatic heart segmentation have been proposed. Rousseau and Bourgault [4] presented a heart segmentation method that uses an iterative Chan-Vese algorithm [5]. They used L1 fidelity term for computational efficiency instead of L2 fidelity which is a classic term. However, this approach extracted only the whole heart. Van Assen et al. [6] proposed an automatic segmentation method using a 3D active shape model in cardiac MRI. In that method, relative gray-level differences instead of absolute gray values are used for the classification of the 3D regions of interest. However, this method requires further generalization of the fuzzy inference system [7], and it segments only the LV and myocardium. Mitchell et al. [8] developed a model-based segmentation method using a 3D active appearance model. This method does not require any interactive user input of cardiac MRI and echocardiographic temporal image sequences. This method does require a number of training data sets from manually traced segmentation results. Ecabert et al. [9] proposed automatic segmentation of four chambers using a statistical geometry model and training meshes from cardiac CTA images. This method requires well-defined training data sets, and it takes too much time and effort to generate a template mesh. Funka-Lea et al. [10] developed a method to automatically isolate the outer boundary of the entire heart using balloon expansion and the graph-cut technique. This approach extracts only the whole heart, not four chambers. Grady et al. [11] evaluated three techniques, graph cuts, isoperimetric minimization, and random walks for the segmentation of four chambers. However, these methods extract four chambers with the input of seed points for each chamber, and a lot of seed points are required for accurate segmentation results.
This paper presents a method that automatically extracts four chambers by extracting the whole heart, separating the left and right sides of the heart, and splitting the atrium and ventricle regions in cardiac CTA efficiently. First, we smooth the images by applying filters to remove noise. The heart regions in cardiac CTA are inhomogeneous due to the irregular characteristics of angiography, making segmentation more difficult. Therefore, the process of image smoothing is necessary for more accurate segmentation of the heart. Second, the volume of interest (VOI) of the heart is detected using k-means clustering [12]. In this step, we utilize the intensity information of the image to extract the whole heart coarsely, and it is used for seed volumes in the next step. Third, we detect seed volumes using a geometric analysis based on anatomical information and separate the left and right sides of the heart with power watershed. Because the left and right sides of the heart have no distinct separator, it is difficult to split the left and right regions from the whole heart. To separate the heart into the left and right regions, we exploit power watershed [13] which is powerful to extract a region from an object that has weak edges or no edge. Finally, we refine the left and right sides of the heart using Malladi's level-set method [5] for more accurate segmentation, and we extract the atrium and ventricle from the left and right sides of the heart using the split energy function based on the shape and intensity of the heart. This function allows the heart to be robustly divided into chambers even in the case of having a weak edge.
The remainder of this paper is organized as follows. The next section describes the proposed method of automatic segmentation of four chambers in CTA. This procedure consists of four processing steps. Section III presents the results of the proposed method obtained using a clinical dataset. In Section IV, we summarize and discuss the results.
II. Methods
1. Pre-processing
First, we smooth the input CTA. In general, there is much noise in cardiac CTA, and it may be unclear. Therefore, image smoothing is essential to segment the heart region. Although there are many methods of image smoothing, we use Gaussian filtering [14] because the heart has inhomogeneous regions that nearly becomes homogeneous by applying Gaussian filter. Then, we use anisotropic diffusion filtering [1516], which minimizes total variation (TV), to preserve the edge while smoothing the original image and preserve finer detailed structures in images. The equation of anisotropic diffusion filter is expressed as
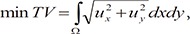 (1)
(1)2. Segmentation of Whole Heart
This step extracts the whole heart, including the left and right heart regions using k-means clustering to eliminate cardiac muscles outside the chambers of the heart. k-means clustering [12] is a method to partition a number of observations into k clusters in which each item of data belongs to the cluster with the nearest mean. It is based on minimization of a formal objective function, and it is the method that is most widely used and studied. Given a set of n data points in real d-dimensional space, Rd and an integer k, the problem is to determine a set of k points in Rd, called centers, so as to minimize the mean squared distance from each data point to its nearest center. This clustering type falls into the general category of variance-based clustering. Also, we expand the heart region by comparing the mean CT values of all clusters, because each chamber generally has a higher CT value than the cardiac muscle. Thus, the clusters, which have lower mean intensity than the threshold value of 220 HU, are removed as cardiac muscles, and the other clusters are merged.
3. Detection of Seed Volumes of Left and Right Heart Regions
To split the left and right sides of the heart, we extract the seed volumes of the two regions from the whole heart volume automatically. First, we find the parts of the left ventricle in the lower axial slices by using 2D connected component labeling slice-by-slice on the binary mask result of the whole heart acquired from the previous step. Then, we detect the parts of the right ventricle below the left ventricle. The right ventricle is located on the left part, and the left ventricle is located on the right part, relatively. The result of this step is used for the initial data of next step.
4. Separation of Left and Right Heart Regions
In this step, we split the heart into the left and the right regions from the seed volumes of the previous step. It is hard to divide the heart into the left and the right regions automatically because there is ambiguity in the boundaries or difference between them. Therefore, we exploit power watershed [13].
A power watershed [13] is a segmentation algorithm used to solve an energy minimization problem based on graph theory. In graph-based image segmentation, an edge weight is assigned to encode nodal similarity such that edges with high weights are considered to be strongly connected, and edges with low weights are regarded as weakly connected or nearly disconnected nodes. One common equation for generating weights from image intensities is expressed as
For image segmentation in two classes, given foreground FO and background BA seeds, the energy model of the power watershed is given by
 (4)
(4)
5. Fine Segmentation of Left and Right Heart Regions Using Level-Set Method
In this step, we segment the left and right sides of the heart accurately using the previous rough segmentation results with Malladi's level-set method [5]. We use the 3D surface and the cross-sectional curve, which are called the level-set function ϕ and the zero level-set, respectively, to extract the boundary of heart. All points that lie in the zero level-set x(t) have a zero level-set function value. Therefore, the following equation holds:
Taking the time derivative of both sides by applying the chain rule,
Function F represents the speed moving in the direction of the normal vector away from the curve; therefore, x'(t) · n = F, where  . When ϕ(x,t = 0) is given, the evolution equation for ϕ can be derived as
Therefore, the evolving boundary Γ(t), according to the time and speed function F, is calculated as
Malladi's level-set method is adopted in this paper for level-set propagation. The speed function is formed by combining the curvature speed component, which is inversely proportional to the curvature of the zero level-set curve, with the propagation speed component, Fprop, which is the intensity value of the speed image as follows:
 , the curvature K is calculated as the divergence of the unit normal vector:
 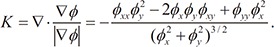 (10)
(10)The initial heart boundary acquired in the previous step is placed as the initial contour of the level-set method, which evolves according to Equation (9). The refined heart segmentation is achieved after level-set propagation. When one contour lies completely inside the other contour, we select the outermost contour, which leads to the same effect of hole filling.
6. Detection of Atrium and Ventricle from Left and Right Heart Region
In this step, we detect the atrium and ventricle from the left and the right heart regions using the split energy function. Since it is difficult to identify valves in a cardiac CTA, we find the separation plane approximately located in a valve. To find the separation plane, we first detect the rough location of the plane that separates the right side of the heart. It is easy to search for a separation point of the right side of heart because there are intermediate slices where RV and RA are separated. We examine the slices to determine whether the right side of the heart is separated or not using 2D connected component analysis. After the separation point of the right side of the heart is detected, we detect the separation point of the left side of the heart by calculating an orthogonal projection point onto the line, orienting the first principal axis, which lies on the first coordinate and has the greatest variance by the projection of the data, and passing through the center of the left side of the heart.
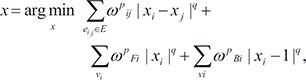
Although the separation points are detected, they are only approximated candidates since only some of them are the exact points of the separation plane of the left and right sides of the heart. Therefore, we accurately detect the separation planes of the left and right sides of the heart by devising and minimizing a split energy function. We propose a split energy function as follows:
where Esep is the separation energy function, p is a voxel position, and θ and φ are the angles with the second and third principal axis, respectively. Here, ωarea and ωint are weights (ωarea + ωint = 1), and Earea is the energy term of the area, defined as
 (12)
(12)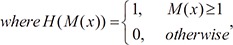
where M(x) is the mask volume of the left or right side of the heart, and ΩM is a plane that passes through point p with its normal vector oriented toward the angles, θ and φ. Here, Eint is the energy term of the intensity, defined as
 (13)
(13)III. Results
We tested the proposed heart segmentation method using an Intel Core2 Quad desktop system with a 3.4-GHz processor and 16 GB of main memory. We implement our method using Microsoft Visual Studio 2008 without the help of other open-source libraries. We prepared 20 clinical scan datasets, each acquired from a different patient. All the datasets were obtained using a cardiac CT scanner by Siemens. The number of images per scan ranged from 183 to 285. Each image had a matrix size of 512 × 512. The voxel size was 0.36 × 0.36 × 0.70 mm. We extracted the iso-surface using the marching cube algorithm [18] and checked the computational time for each step.
Figure 1A and 1B show the automatically segmented four chambers superimposed on axial CT images obtained from the first, second, and third datasets. Figure 1C shows the 3D surface rendering results of four-chamber segmentation. LV, LA, RV, and RA are accurately segmented in both the 2D and 3D views.
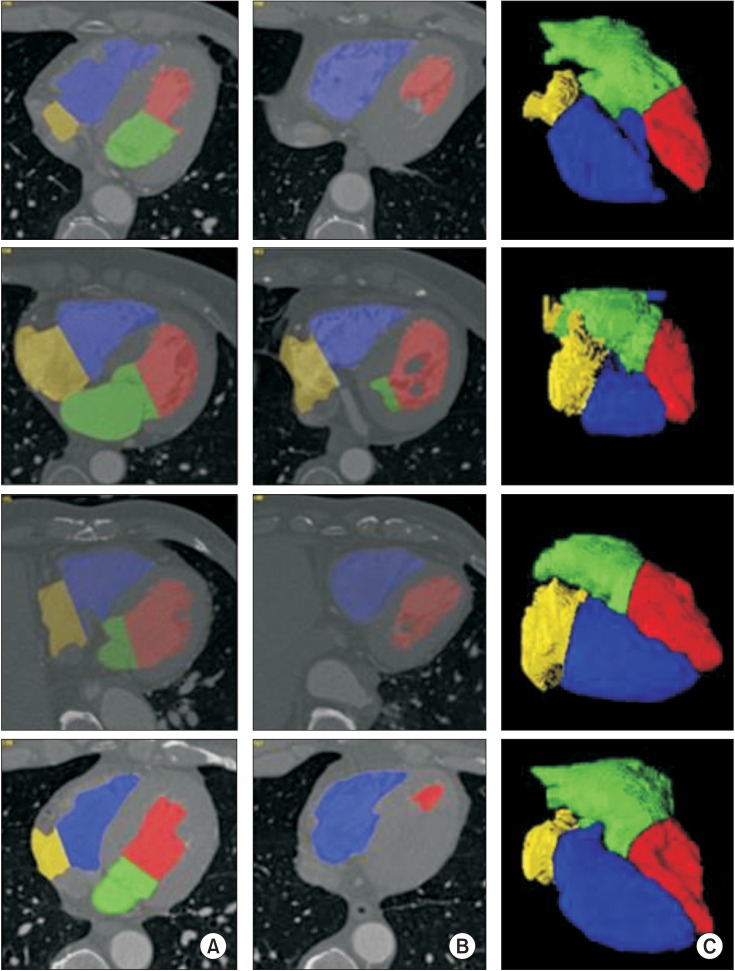
Result of four-chamber segmentation: left vectricle (red area), left atrium (green area), right vectricle (blue area), and right atrium (yellow area). (A) Superimposed image in the upper axial computed tomography (CT) slice. (B) Superimposed image in the lower axial CT slice. (C) The 3D surface rendering image.
To validate the results of the proposed heart segmentation method, we requested a cardiologist with 10 years of clinical experience to segment the left and right heart regions manually for each dataset. The cardiologist manually drew the boundary of the left and right heart regions in axial image slices. In this way, we obtained two manually segmented regions to serve as the ground-truth for the accuracy assessment of the proposed method.
Among the sequential processing steps in the proposed method, we evaluated the accuracy of the proposed method to segment each object including the left and right heart regions based on the following four evaluation metrics:
 (14)
(14) (15)
(15) (16)
(16)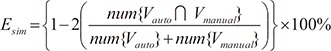 (17)
(17)Table 1 summarizes the segmentation errors of our method for 20 datasets. Each value is the rate of mean ± standard deviation of all the datasets. In all of the datasets, Esim ranged from 3.14% to 4.04%. The average value of Esim was 3.43% ± 0.41% for all the datasets, indicating that the average difference between manual and automatic segmentation was less than 3.3%, approximately.
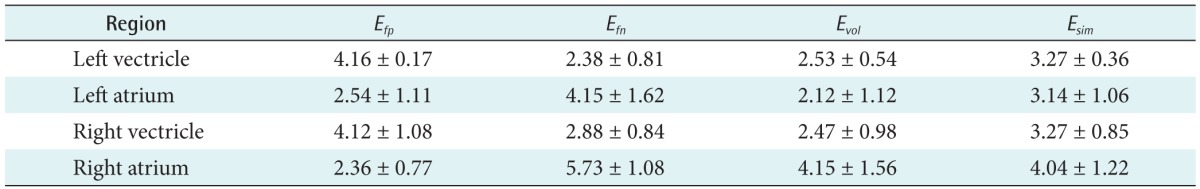
Results of accuracy assessment of proposed method (unit: %)
We compared the segmentation accuracy of the proposed method with that of CVM [20] by measuring Esim in (9). The average value of Esim for CVM was 12.74% ± 7.40% for all the datasets, respectively. Specifically, some regions in the RV and RA were not included using the CVM. However, these were accurately segmented using the proposed method. Our proposed method exhibited the most accurate segmentation results with the lowest value of Esim.
Table 2 summarizes the computational time for the evaluation of the performance of the proposed method; we measured the total processing time. The processing time, averaged over multiple tests for all the datasets, was 62.76 ± 1.09 seconds. It took 3.97 ± 0.21 seconds for pre-processing, 3.24 ± 0.28 seconds for the segmentation of the whole heart, 18.82 ± 1.68 seconds for the separation of the left and right sides of the heart, and 23.45 ± 1.42 seconds for the fine segmentation of the left and right sides of the heart and 2.82 ± 1.87 seconds for the detection of the atrium and ventricle from the left and right heart regions.
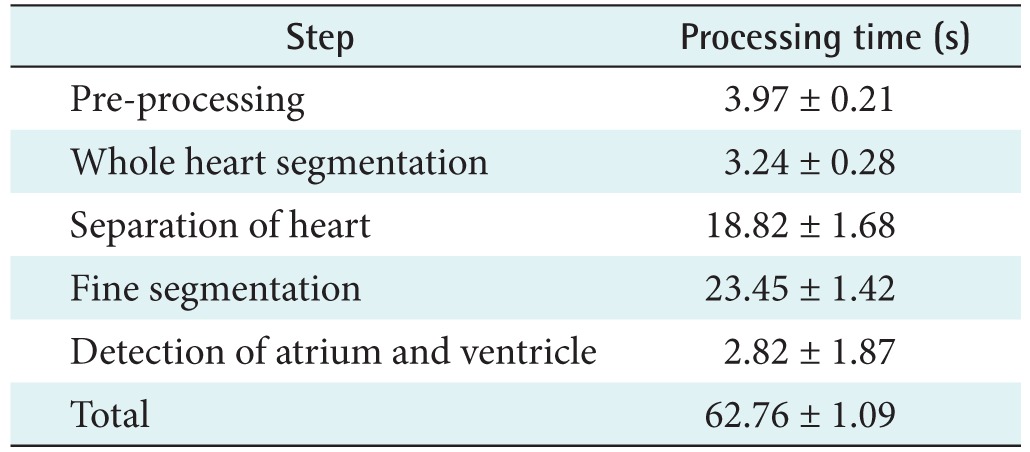
Results of processing time of proposed method
IV. Discussion
In this paper, we propose an automatic method to segment four chambers by extracting the whole heart, separating the left and right heart regions, and splitting the atrium and ventricle regions from each side of the heart in cardiac CTA efficiently. First, we smooth the images by applying filtering to remove noise, namely Gaussian and anisotropic diffusion filtering. These types of filtering reduce image noise without removing important parts, such as edges or features. Second, the VOI of the heart is detected using k-means clustering. In this step, we utilize the intensity information of the image to extract the whole heart coarsely, and it is used for seed volumes in the next step. Third, we detect seed volumes using a geometric analysis based on anatomical information and separate the left and right heart regions with the power watershed algorithm. Because the left and right heart regions have no distinct separator, it is difficult to split the left and right regions from the whole heart. To separate the heart into the left and right regions, we exploit the power watershed algorithm. Finally, we refine the left and right sides of the heart using Malladi's level-set method for more accurate segmentation, and we extract the atrium and ventricle from the left and right heart regions using split energy. This function allows the heart to be robustly divided into chambers even in the case of having a weak edge.
We are planning to improve this method to operate robustly even when the CTA has poor contrast. Other image information, such as curvature, or the texture of the heart shape would be helpful to detect the missing part of the heart. We will devise a more robust energy model of the level-set method, which uses not only region-based information but also edge-based information and the split energy function.
Acknowledgments
This research was supported by the Ministry of Trade, Industry and Energy (MOTIE), Korea, through the Education Program for Creative and Industrial Convergence (Grant No. N0000717).
Notes
Conflict of Interest: No potential conflict of interest relevant to this article was reported.