Texture Analysis of Supraspinatus Ultrasound Image for Computer Aided Diagnostic System
Article information
Abstract
Objectives
In this paper, we proposed an algorithm for recognizing a rotator cuff supraspinatus tendon tear using a texture analysis based on a histogram, gray level co-occurrence matrix (GLCM), and gray level run length matrix (GLRLM).
Methods
First, we applied a total of 57 features (5 first order descriptors, 40 GLCM features, and 12 GLRLM features) to each rotator cuff region of interest. Our results show that first order statistics (mean, skewness, entropy, energy, smoothness), GLCM (correlation, contrast, energy, entropy, difference entropy, homogeneity, maximum probability, sum average, sum entropy), and GLRLM features are helpful to distinguish a normal supraspinatus tendon and an abnormal supraspinatus tendon. The statistical significance of these features is verified using a t-test. The support vector machine classification showed accuracy using feature combinations. Support Vector Machine offers good performance with a small amount of training data. Sensitivity, specificity, and accuracy are used to evaluate performance of a classification test.
Results
From the results, first order statics features and GLCM and GLRLM features afford 95%, 85%, and 100% accuracy, respectively. First order statistics and GLCM and GLRLM features in combination provided 100% accuracy. Combinations that include GLRLM features had high accuracy. GLRLM features were confirmed as highly accurate features for classified normal and abnormal.
Conclusions
This algorithm will be helpful to diagnose supraspinatus tendon tear on ultrasound images.
I. Introduction
With today's aging society, elderly patients with rotator cuff disease are increasing in prevalence. Rotator cuff tear is a common shoulder ailment. It is caused by overuse or improper use rather than a simple rupture trauma. The rotator cuff is made up of four muscles: supraspinatus, infraspinatus, subscapularis, and teres minor. It is important in shoulder movements and stability. Rotator cuff tear is diagnosed in patients over 50 years of age and is a common chronic degenerative disease. In many cases, rotator cuff tear diseases are not match in symptoms. With an aging society and a greater emphasis on healthy life, rotator cuff tear patients are actively demanding rotator cuff tear treatment. Clinical physicians usually observe the injury symptoms to make a diagnosis. Generally, they diagnose disease through ultrasound exams. Ultrasonography is a simple and noninvasive test that can be performed in real time at low cost.
However, the rotator cuff disease diagnosis accuracy rate is close to 80% based on clinical physician observation without clinical history data [1]. It is thus important to develop a computer aided diagnosis system to increase the accuracy of clinical diagnosis using ultrasonography.
There have been many studies to increase the diagnosis accuracy. Chen et al. [2] used texture analysis methods to classify ultrasonic images into different disease groups of normal, tendon inflammation, calcific tendonitis, and tendon tear. However, the proposed classification of accuracy achieves 84%. Horng et al. [3] proposed a computer diagnosis system to assist radiologists in classifying rotator cuff lesions. They presented methods to classify tendon inflammation, calcific tendonitis, and tear using a texture analysis. As a result, the proposed system achieved an accuracy of 86%.
In this study, we propose a rotator cuff supraspinatus tendon tear detection algorithm using Support Vector Machine (SVM), which provides good performance with a small amount of training data. The methodology used in this article includes three main stages: feature extraction, statistical analysis, and classification. In the feature extraction stages, three texture analysis methods are computed: first order statistics, a gray level co-occurrence matrix (GLCM), and a gray level run length matrix (GLRLM). In the statistical stage, we verified statistical significance using a t-test. In the classification stage, the SVM classification demonstrated accuracy using feature combinations. It is used to divide the normal rotator cuff and abnormal rotator cuff based on cross validation. Finally, sensitivity, specificity, and accuracy are used to evaluate performance.
II. Methods
1. Data
In this study, we used 20 normal supraspinatus tendon ultrasound images and 20 abnormal supraspinatus tendon ultrasound images. The supraspinatus is a relatively small muscle of the upper back that runs from the supraspinatus fossa superior of the scapula [4]. It is one of the four rotator cuff muscles. We considered an abnormal supraspinatus tendon, specifically a tear of the tendon. It is known to increase in frequency with age and overuse or improper use. The abnormal ultrasound images have low intensity and unclear boundaries. Also, they have focal increased echogenicity, focal thinning, and diffuse increased echogenicity [5]. Regions of interest (ROI) were extracted from diagnostic area of each section. All images used in the proposed algorithm have been developed based on MATLAB R2014a (MathWorks Inc., Natick, MA, USA).
2. Texture Analysis
1) First order statistics
Texture is a surface property that describes the visual patterns and information on the structural arrangement of the surface. Quantitative methods such as statistical methods, structural methods, and Fourier spectrum analysis can be used to recognize and classify texture. Among them, texture analysis is frequently used to identify statistical properties using a histogram. The first order statistics measure does not consider the pixel neighbor relationship. Basic statistics such as variance are measured from the original image values. In this study, we used 5 parameters to describe the characteristics based on a histogram (Table 1).

Mathematical description of the first order statistics features
2) Gray level co-occurrence matrix
The GLCM was first demonstrated by Haralick and Shanmugam [6] in the 1970s and is of the recognized statistical tools for extracting texture information from images. The GLCM was applied to reveal the texture characteristics of the ultrasound image. It appears pair of gray-level frequency in an original image. The co-occurrence matrix G(i, j) calculates the co-occurrence of the pixels with the values i, j. The GLCM matrix is considered in the 0°, 45°, 90°, 135° directions. In this study, we used 10 parameters to describe the characteristics and considered all directions (Table 2).

Mathematical description of the GLCM features
3) Gray level run length matrix
The GLRLM method is a method of extracting higher order statistical texture features described by Galloway [7] in 1975. A run length matrix P is defined as follows: each element P(i, j) represents the number of runs with pixels of gray level intensity equal to i and length of run equal to j along a specific orientation. The GLRLM matrix is considered in the 0°, 45°, 90°, 135° directions. In this study, we used low gray level run emphasis, high gray level run emphasis, and gray level non-uniformity parameters to describe the characteristics and consider all directions (Table 3).
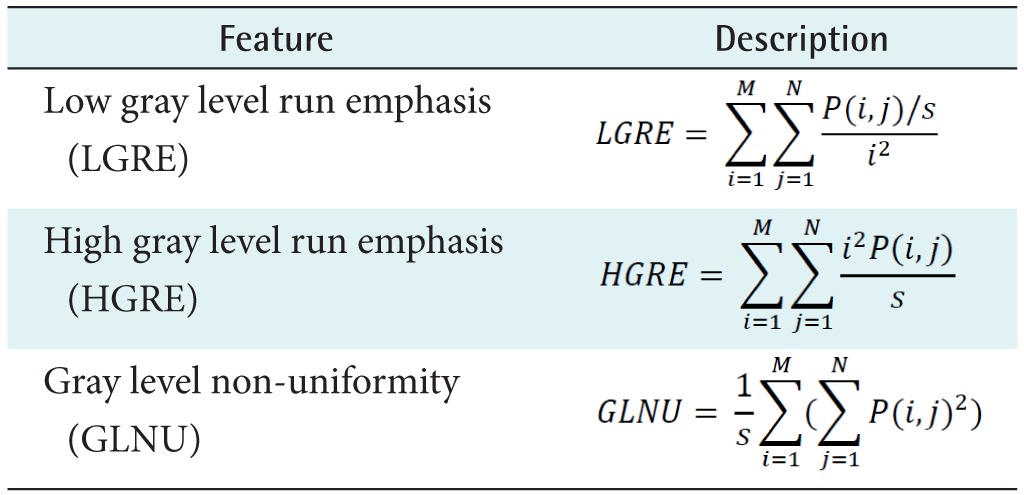
Mathematical description of the GLRLM features
3. Statistical Analysis and Classification
After feature computation, we verified statistical significance using a t-test. A t-test is commonly applied when the test statistics follow a normal distribution [8]. In each of the normal and abnormal comparisons, a t-test (p < 0.05) was carried out for five first order statistics, 40 GLCM features, and 12 GLRLM features. In this study, we used a SVM to classify texture features. SVM classification constructs a hyperplane that best separates the data into normal and abnormal [9]. The hyperplane provides the optimum separation boundary to maximize the separation of the object. We selected a polynomial kernel with high accuracy through experiments. It represents the similarity of vectors in a feature space over polynomials of the original variables, allowing learning of a nonlinear model. Classification and performance are then estimated by one-fold cross-validation. The cross validation technique helps to ensure that useful texture features are found. Sensitivity, specificity, and accuracy are used to evaluate performance.
III. Results
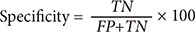
Texture features are extracted by first order statistics, GLCM, and GLRLM. We then confirmed statistical significance through a t-test. A t-test is used to compare the values of texture features to differentiate normal and abnormal tendons. The extracted texture features are classified using SVM classification. This was used for accurate detection performance. To evaluate detection, sensitivity, specificity, and accuracy were used [10].
TP: true positive
FN: false negative
TN: true negative
FP: false positive


Results of normal and abnormal using first order statistics are presented in Table 4 and showed the greatest difference from the mean feature (p < 0.0001) and the lowest difference from the smoothness feature (p < 0.0001). Features extracted from the first order statistics matrix were confirmed to have statistical significance.
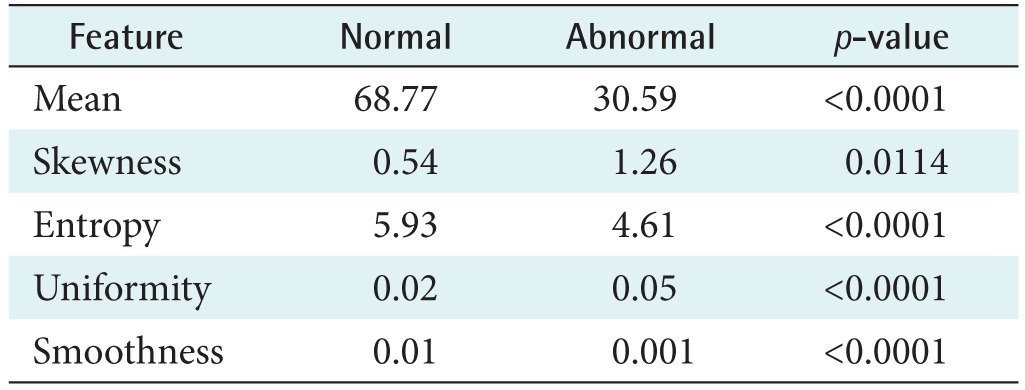
Results of normal and abnormal using first order statistics
Results of the GLRLM for distinguishing normal and abnormal tendons are presented in Table 5. Both low gray level run emphasis and gray level non-uniformity were higher in the normal group compared to the abnormal group. The gray level non-uniformity shows the greatest difference in the normal group. Table 6 shows the results of the GLCM for the normal and abnormal tendons. Those were considered for four directions: 0°, 45°, 90°, 135°. It also showed significant differences in the sum average feature. There are no differences in the difference variance feature (direction 45°, 90°, 135°). For combined features, the results are provided in Table 7. We used six combinations for classification input. The results of classification and performance are estimated by a one-fold cross-validation. The cross-validation technique helps to ensure that useful texture features are found. Feature combinations are classified by SVM classification with a polynomial kernel. As a result, GLCM features had low accuracy of 85%. GLRLM features had high accuracy and sensitivity (accuracy 100%, sensitivity 100%). First order statistics and GLCM features in combination provide 90% accuracy. Combinations that include GLRLM features had high accuracy. As a result, GLRLM features were confirmed as highly accurate features for classification of normal and abnormal.
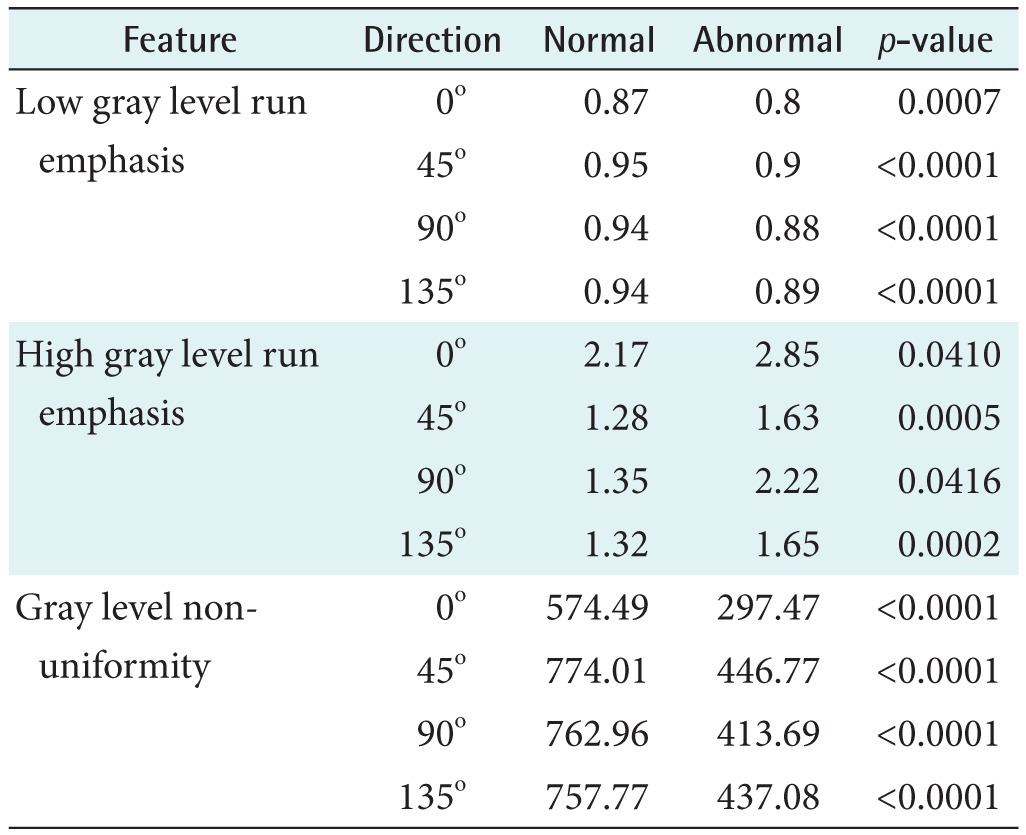
Results of normal and abnormal using GLRLM
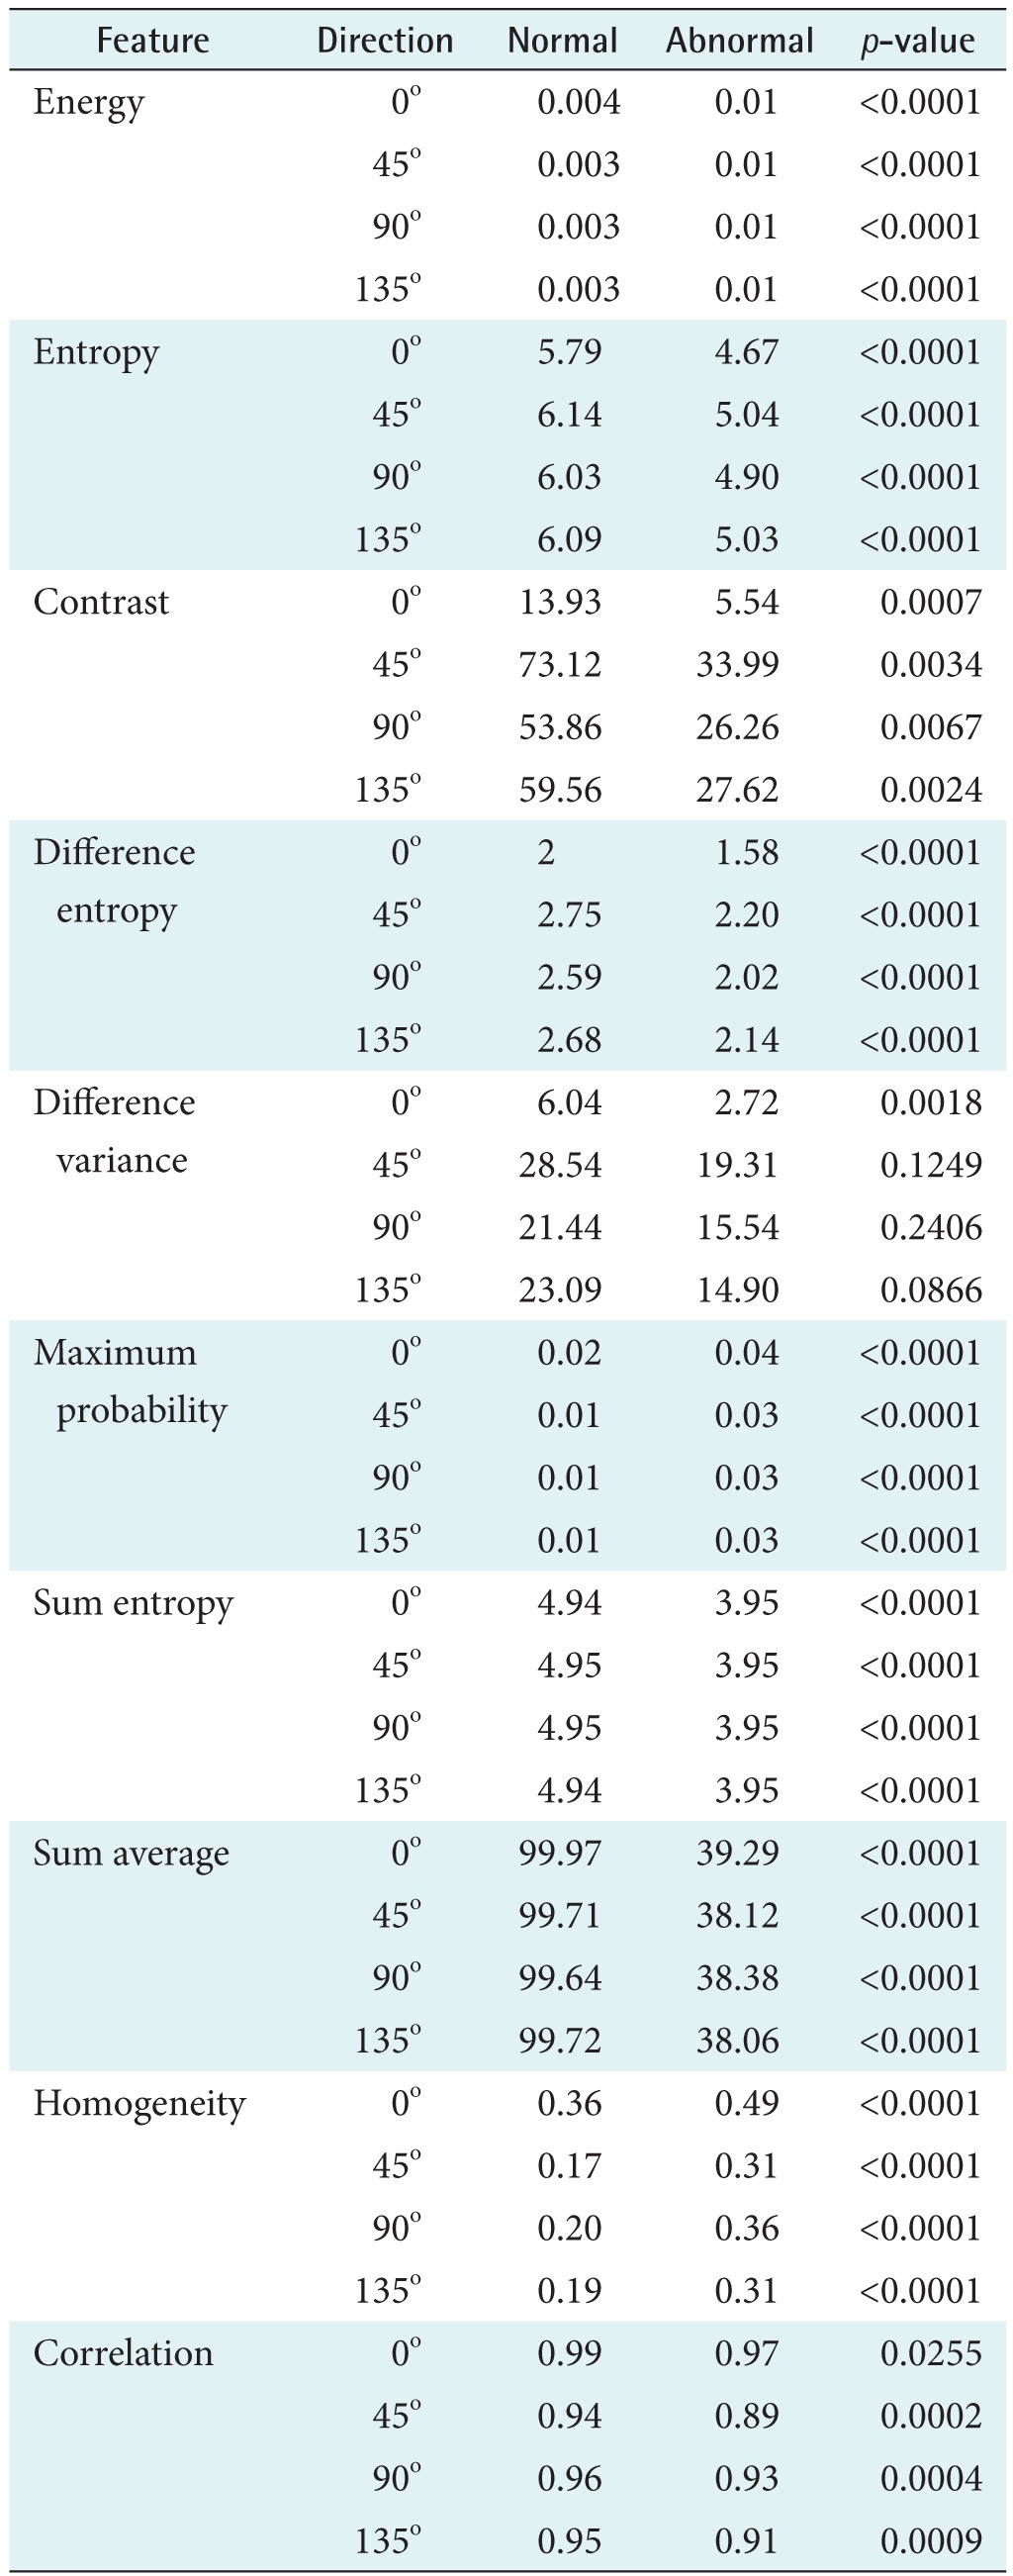
Results of normal and abnormal using GLCM
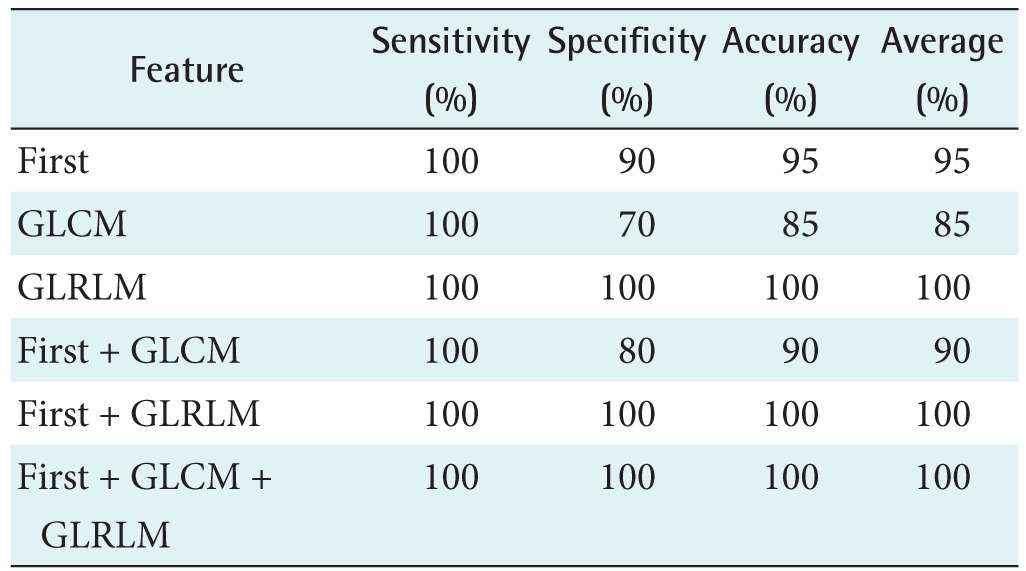
Results of supraspinatus tendon tear detection using proposed algorithm
IV. Discussion
In this study, we developed a quantitative ultrasound texture analysis methodology to accurately differentiate normal and abnormal in patients with rotator cuff supraspinatus tendon tear disease. Rotator cuff tear is a very common shoulder disease [11]. It is caused by overuse or improper use rather than a simple rupture trauma. We propose a rotator cuff supraspinatus tendon tear detection algorithm using a SVM, which gives good performance with a small amount of training data. The methodology used in this article includes three main stages: feature extraction, statistical analysis, and classification. In the feature extraction stages, three texture analysis methods are employed: first order statistics, GLCM, and GLRLM. In the statistical stage, we verified the statistical significance using a t-test. In the final disease classification, the SVM is used to classify normal and abnormal tendons. One-fold cross-validation was applied to ensure that useful texture features are found. The algorithm uses a linear kernel, polynomial kernel, radial basis function kernel, and sigmoid kernel. The polynomial kernel that has the most accurate classification rate is selected through experiments. The results show that the proposed algorithm provides good performance with fast learning time and high accuracy compared to existing approaches. GLRLM features afforded high accuracy. In addition, combinations that include GLRLM features offered high accuracy. GLRLM features were confirmed as highly accurate features for classification of normal and abnormal. It is also possible to utilize a variety of input feature extraction studies.
Acknowledgments
This work was supported by the R&D Program of the Ministry of Trade, Industry and Energy/Korea Evaluation Institute of Industrial Technology (Grant No. MOTIE/KEIT 10048528, Development of ICT based Wireless Ultrasound Solution for Point-of-Care Applications).
Notes
Conflict of Interest: No potential conflict of interest relevant to this article was reported.