New Aging Index Using Signal Features of Both Photoplethysmograms and Acceleration Plethysmograms
Article information
Abstract
Objectives
Acceleration plethysmograms (APGs) are obtained by taking the second derivative of photoplethysmograms (PPGs) and are noninvasive circulatory signals related to risk factors for atherosclerosis with age. There has been growing interest in the development of mobile devices to collect and analyze PPG single features for ambulatory health monitoring. The present study aimed to extract a new feature from the morphologies of APG and PPG signals to classify the dominant indices related to the pulsatile volume of blood in tissue according to age.
Methods
Ten APG and 14 PPG indices were simultaneously extracted. All indices were compared via Pearson correlation coefficients (r) and a regression analysis. We introduced a combined index extracted from both the PPG and APG indices defined as the inflection point area plus the d_peak (IPAD). The participants included 93 healthy adults aged 36–86 years with a mean ± standard deviation age of 57.43 ± 11.99 years.
Results
The d_peak and age index for the APG indices were significantly correlated with age (r = −0.408, p < 0.0001 and r = 0.296, p = 0.0039, respectively). Only the A1 time for PPG indices was moderately correlated with age (r = −0.247, p = 0.017). The stiffness index, including individual height information, was not related to age (r = −0.031, p = 0.7713). However, the combined IPAD index was significantly more correlated with age (r = 0.56, p < 0.001) than the other indices.
Conclusions
The proposed index outperformed the other 24 indices for evaluating vascular aging. We suggest that the IPAD is a significant factor related to the clinical information embedded in the PPG waveform.
I. Introduction
Photoplethysmograms (PPGs) are noninvasive, optical measurements that are used to determine the relative blood volume in tissue as a function of time. In particular, the analysis of fingertip PPG signals has been an important tool for evaluating vascular health by analyzing pulse wave components. To obtain PPG signals, light passing through tissue is modulated by each cardiac cycle of the subject and by the respiration and movement of the subject, which reflect variations in blood perfusion. However, the distortion of PPGs by motion artifacts is a significant barrier to the efficient use of PPG waveforms for real-time, continuous state-of-health monitoring. An optimal effective algorithm for motion artifact removal remains a significant issue for the development of vascular monitoring tools to detect the presence of atherosclerotic disorders. Many PPG studies have focused on motion artifact techniques, such as wavelet analysis, decomposition techniques, and adaptive filtering [1]. Such techniques are still unsuitable for robust continuous monitoring in which clear signals are required for the clinical diagnosis of certain diseases. Although the complete removal of motion and noise artifacts is impossible, there has been a recent growing interest in investigating specific waveform features related to vascular health [2345]. However, studies focused on identifying the effective indices for both PPG and APG waveform features are lacking. Additionally, there is limited reported data describing how age affects the peripheral pulse, which leads to uncertainty in establishing normal ranges for comparison with risk groups.
Based on a PPG pulse contour analysis, the vascular status of 72 subjects, and ultimately the severity of the underlying cardiovascular aging, was predicted [3]. The analysis showed that there was a linear relationship between the pulse contour and age of the 72 individuals. An age index, which indicates vascular age, is thus proposed based on the slope of the best fit line for a given individual. The variations in PPG morphology with age for a sample of erectile dysfunction subjects were previously investigated [4]. The researchers found that age was an important factor that affects the contour of PPG signals, which accelerates the disappearance of the dicrotic notch and inflection point of PPGs. In addition, the potential information embedded in the PPG waveform signal has been investigated by analyzing characteristic features of the PPG waveform and PPG indices for evaluating diagnoses [5]. Most indices have been based on the second derivative of the finger PPG, which seems to provide more information than the first derivative of the PPG. The first derivative of the PPG can be used to more accurately calculate the augmentation index and the large artery stiffness index. A recent study reported a detailed morphological analysis of the PPG signals of patients with Takayasu's arteritis disease to assess chronic inflammatory disease [6]. Morphological parameters included the peak-to-peak time, the crest time, the reflection index, the maximum systolic slope, the maximum diastolic slope, the pulse height, and the area under pulse.
In this study, a morphological analysis of both PPG and APG signals was performed to investigate the effective indices influenced by vascular status with age. Fourteen PPG and ten APG indices were analyzed to identify which indices were most informative. Our investigation focused on time domain features to propose the most suitable aging index from both APG and PPG signal features.
II. Methods
1. Data Collection
In this study, PPG datasets of 93 healthy individuals were recorded from the fingertip using TAS9 VIEW (or Canopy9 RSA, IEMBIO Co. Ltd., Chuncheon, Korea). Measurements were taken for 20 seconds at a sampling rate of 1 kHz while the participants were seated at rest. APG signals were obtained by double differentiating the PPG signal. In the PPG and APG signal feature extraction algorithm, 10 APG and 14 PPG indices based on the peripheral signals were simultaneously obtained: a_peak, b_peak, c_peak, d_peak, e_peak, age index, c_position, d_position, bc_slope, and bd_slope for APGs and area A1, area A2, A1_time, A2_time, crest time, delta time, early systolic peak, late systolic peak, inflection point area, reflection index, relative crest time, relative delta time, stiffness index, and systolic amplitude or PPGs. All of the subjects provided written informed consent before participating in the investigation. They exhibited normal blood pressure, i.e., <150 mmHg systolic or <90 mmHg diastolic, regardless of any drug administration. The participants were normotensive (mean systolic blood pressure, 123.10 mmHg; range, 110–148 mmHg) and had no known cardiovascular, neurological, or respiratory disease. Prior to the experiment, the physical characteristics of the subjects were acquired. Physical data were measured for reference and are summarized in Table 1. Figure 1 shows the age group distribution.

Participants' information

Age group distribution.
2. Statistical Analysis
We applied two statistical methods to evaluate the relationships between the 25 total indices and age, including the combined index of the PPG and APG features, defined as the inflection point area plus the d_peak (IPAD). The methods included calculation of the Pearson correlation coefficients (r) and a scatter plot regression analysis using the MedCalc program (MedCalc Software, Ostend, Belgium), which is considered a useful tool for the statistical analysis of medical data. A 95% confidence interval for the correlation coefficient (r) was calculated, and regression was performed to assess the independent association between age and each feature. Statistical significance was defined as p < 0.05. Scatter plots were generated to confirm the linear relationship according to the correlation coefficients.
3. Photoplethysmography
The PPG is a remarkably simple device consisting of a light source (LED) and a light detector (photo diode). The detector was placed directly across from the light source for plethysmography transmission from the fingertip. The plethysmographic waveform displayed in Figure 2 is a filtered signal based on the red signal (approximately 660 nm). This wavelength is absorbed when light is transmitted through the peripheral vascular bed. The magnitude of the PPG signal depends on the amount of blood ejected from the heart into the peripheral vascular bed with each cardiac cycle, the optical absorption of the blood, the composition and color of the skin and underlying tissues, and the wavelengths used to illuminate the blood. Because PPG signals are often very small and typically contain unwanted noise together with the meaningful vascular information, it is important to detect the inflection point of the PPG waveform reflecting vascular aging during the cardiac cycle. The pulsatile component, or the AC (alternating current) portion of the signal, is displayed by removing the static component, or the DC (direct current) portion of the signal, representing the absorption of light by surrounding tissue by means of a high-pass filter. The PPG waveform is regulated by an auto-gain algorithm designed to maximize the size of the waveform [7]. One of the most useful plethysmographic features is the waveform amplitude. Amplitude changes are obtained by turning off the auto-gain because the amplitude of the plethysmograph signal is directly proportional to the vascular distensibility [8]. If the vascular compliance is low during episodes of increased sympathetic tone, PPG amplitude is also low. However, PPG amplitude is decreased during a significant increase in arterial blood pressure due to increased sympathetic tone. The pulse distorts the arterial wall, and the distortion travels at a speed determined by the stiffness or elasticity of the wall. Softer arteries have slower return waves with longer peak-to-peak times. The reverse is true for harder arteries. A mathematical equation can be used to determine the stiffness index (SI) of the arteries based on the distance/timing of these two peaks. Regarding the SI, large arterial stiffness is highly age-related and is a good biomarker of aging [9]. The time between the systolic and diastolic peak points, or the delta time (DT), is related to the time taken for the pressure wave to propagate from the heart to the periphery and back. The crest time (CT) is calculated as the time from the foot of the PPG waveform to its peak:
 (1)
(1)
Photoplethysmogram (PPG) signal features. ESP: early systolic peak, LSP: late systolic peak, DT: delta time, CT: crest time, AT: area time.
The reflection index (RI) has been shown to be a noninvasive indicator for vascular assessments [10]. RI can be calculated as
 (2)
(2)The augmentation index (AI) is defined as the ratio of late systolic peak (LSP) to early systolic peak (ESP) as follows [11]:
 (3)
(3)Dividing the pulse area into two areas at the dicrotic notch, area A1 and area A2, has been associated with vascular healthiness [12]. The ratio of the two areas is shown in Figure 2. This ratio is called the inflection point area (IPA) ratio and is defined as
 (4)
(4)The relative CT (RCT) and the relative DT (RDT) are defined as
 (5)
(5) (6)
(6)4. Acceleration Plethysmogram
The second derivative was applied to the filtered PPG to analyze the APG waveform, which is more commonly analyzed than the PPG waveform itself. This waveform is called the acceleration plethysmogram because it is an indicator of the acceleration of the blood in the finger. As shown in Figure 3, the APG waveform includes four systolic waves and one diastolic wave, namely, wave_a (early systolic positive wave), wave_b (early systolic negative wave), wave_c (late systolic re-increasing wave), wave_d (late systolic redecreasing wave) and wave_e (early diastolic positive wave), representing the dicrotic notch. In APG analyses related to age, the ratios of the height of each wave to that of the wave_a (b/a, c/a, d/a, and e/a) are typically used for wave analyses [13]. Other authors have demonstrated that the b/a ratio and the three other ratios (the c/a ratio, the d/a ratio, and the e/a ratio) reflect increased arterial stiffness and decreased arterial stiffness, respectively [14]. Additionally, they found that the (b-c-d-e)/a, defined as the aging index, increases with age and may be useful for evaluating vascular aging and for screening for arteriosclerotic diseases. Recent investigations have also evaluated the usefulness of APG and compared data on blood pressure, serum biochemistry, and the aortic calcification index in chronic kidney disease patients [15]. It has been reported that the APG aging index and the aortic calcification index increase with aging and that the aging index is significantly correlated with the aortic calcification index. In this study, the detection of waves in the APG signals was used to accurately measure heart rate. The bc_slope and the bd_slope were calculated as shown in Figure 3.
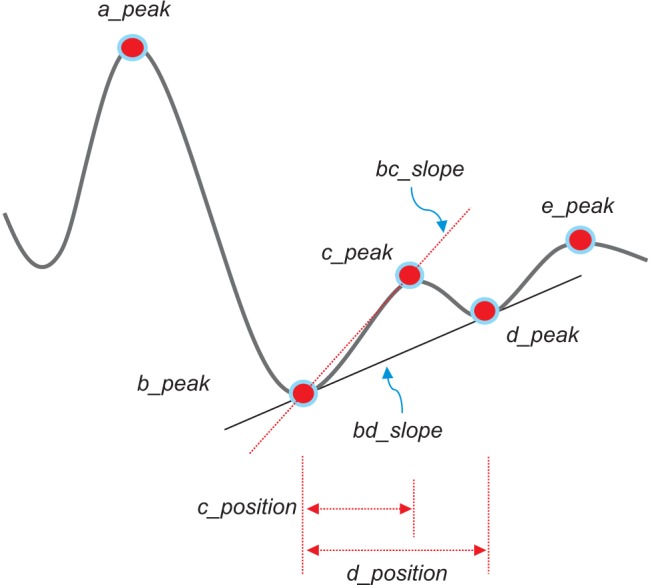
Acceleration plethysmogram signal features.
III. Results
1. Preprocessing Circuit
The circuit topology used in this study is shown in Figure 4. For an operational voltage of 3.3 V (Vcc), a 64-Ω resistor between the LED and Vcc in series was used to create an LED bias of 32 mA. In the next stage, the high-pass filter was a simple first-order RC (register-capacitor) circuit with a lower frequency bound of (2*pi*R0*C0)−1. The low-pass filter was also implemented as an active filter to facilitate amplification. The high-pass filter had a cut-off of (2*pi*R2*C2)−1 and a gain of (R1+R2)/R1. To increase the effectiveness of the bandpass filter, a Sallen-Key bandpass filter was implemented [7]. The transfer function (TF) of the circuit shown in Figure 4 is expressed as
 (7)
(7)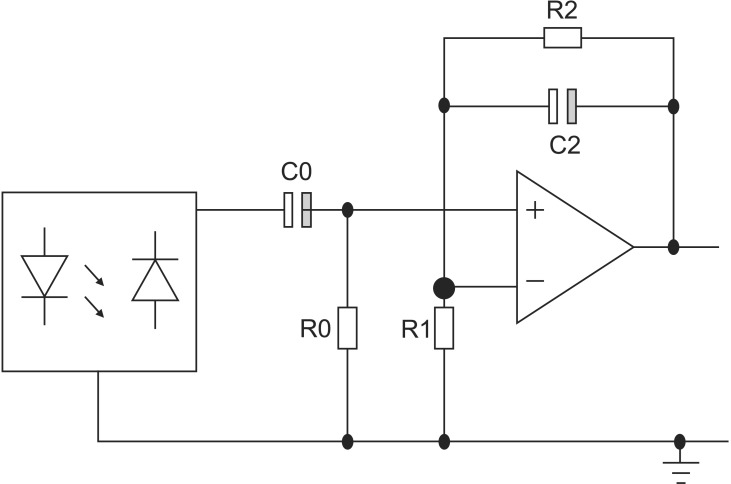
Circuit topology of the preamplifier.
PPG signals, obtained with a preprocessing circuit of this TF, showed detailed changes of pulsatile blood volume including dicrotic notches. The APG waveform enabled a more accurate recognition of inflection points from such PPG signals.
2. Association between Age and APG Indices
A linear regression analysis was performed to examine the relationship between physical age and APG indices among all subjects. The APG-related parameters are shown in Table 2. The slope between age (x-axis) and the other indices (yaxis) was analyzed for data correlation. The correlation coefficient of the d_peak among the ten APG indices was the highest, showing that there is moderate association between the d_peak and age. As seen in Figure 5A, the scatter plot of a negative linear relationship shows a somewhat linear trend, although the trend is not clear. The e_peak with a correlation coefficient of r = 0.140 (p = 0.1794) is not associated with age. The age index has a correlation coefficient of r = 0.296 (p = 0.0390), indicating that there is not a statistically strong relationship with age. Figure 5B shows that the age index does not necessarily represent a strong association with age. Takazawa et al. [14] demonstrated that the second derivative of the wave aging index increased with age (r = 0.80, p < 0.001). The index of vascular age increases as age increases, reflecting age-related thickening of the vascular vessel. The c_peak and d_position were correlated with age, with coefficients of r = −0.288 (p = 0.0052) and r = −0.276 (p = 0.0075), respectively. The correlation coefficient between the bd_slope and age (r = −0.265, p = 0.0103) was smaller than that of the c_peak and the d_position. The bc_slope-related correlation coefficient was r = −0.135 (p = 0.1974).

Relationship between acceleration plethysmogram indices and age
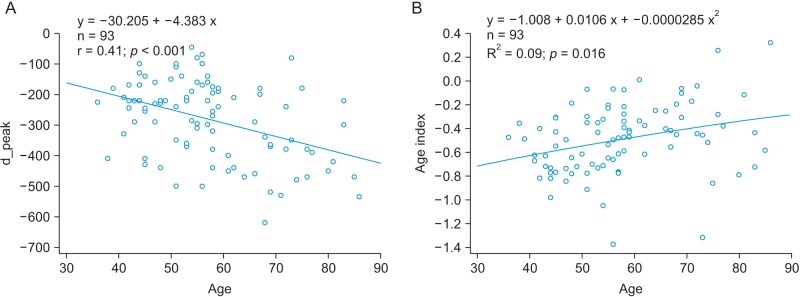
(A) The relationship between the peak and age and (B) the relationship between the age index and age.
3. Association between the Age and PPG Indices
Figure 6A shows the relationship between age and the IPA (r = −0.345, p = 0.0007). The PPG-related parameters are shown in Table 3. The correlation was stronger than the correlation between age and the APG age index (r = 0.296, p = 0.0039). The correlation of the late systolic peak with age corresponded to the next highest r value (r = −0.327, p = 0.0014), as shown in Figure 6B. In addition, age was correlated with the reflection index (r = 0.325, p = 0.0015), the A2 area (r = −0.329, p = 0.0013), and the A1_time (r = −0.247, p = 0.017). Millasseau et al. [9] showed that the SI increases with age because the time delay between the systolic and diastolic peaks decreases with age as a consequence of increased large artery stiffness. However, in this study, the SI and age exhibited negligible correlation (r = −0.031, p = 0.7713).

(A) The relationship between age and inflection point area (IPA) and (B) the relationship between age and the age index.
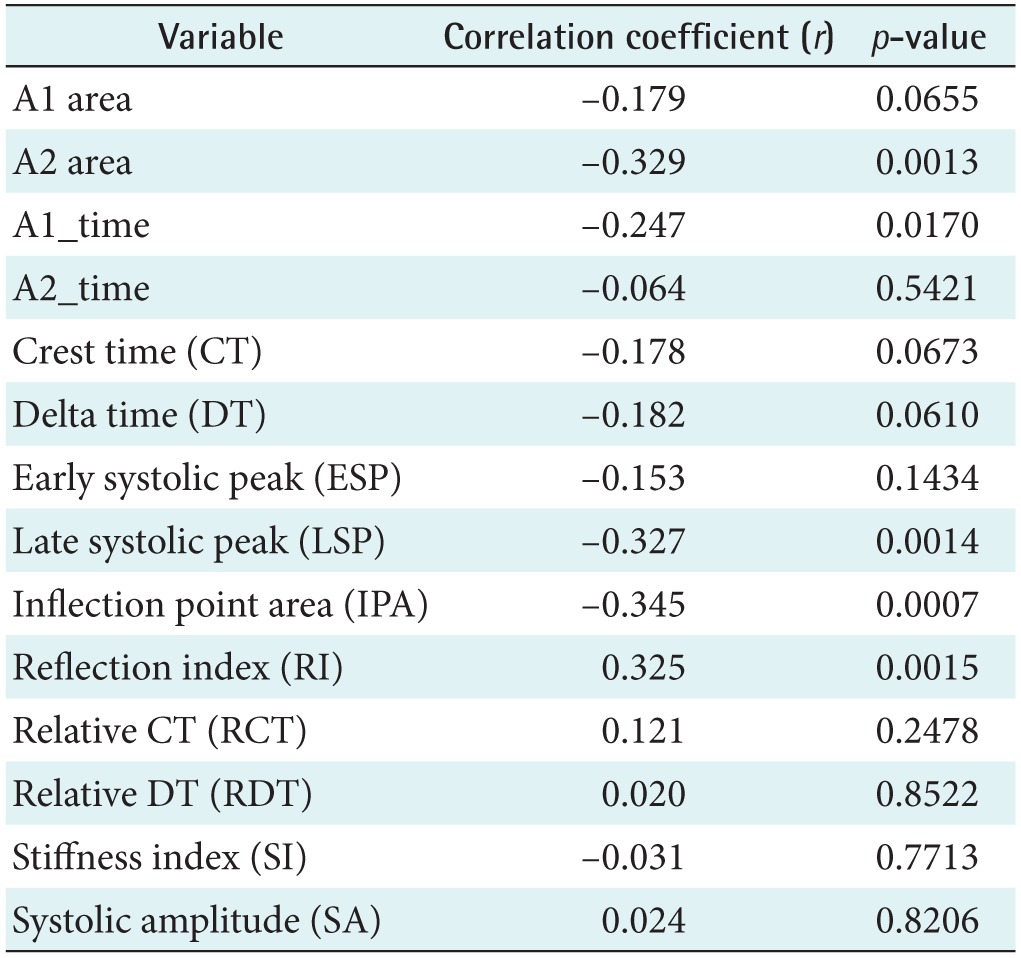
Relationship between photoplethysmogram indices and age
4. Association between the Age and the IPAD Index
We analyzed the combined APG and PPG index, which corresponded to the highest correlation coefficient. The IPA from the PPG signals and the d_peak from the APG signals were combined and were the IPAD. The correlation coefficient of the IPAD was r = 0.56 (p < 0.001). Figure 7 shows that there was good correlation between age and the IPAD.

The relationship between age and the inflection point area plus the d_peak (IPAD).
IV. Discussion
The present study proposed a new index to evaluate vascular age. The results led us to the following conclusions: (1) the proposed index demonstrates good correlation with age, and this correlation is as high as that between the brachial-ankle pulse wave velocity (baPWV) and age [16]; (2) the IPAD index is higher than the individual indices from the two signals (PPG and APG), and it decreases more with advancing age, following a negative linear relationship. This study showed that the IPAD index can quantitatively assess the PPG morphological changes that occur due to aging, although artifacts have been recognized as an obstacle to the use of PPG for diagnosis, as noise can limit its practical implementation and vascular health monitoring applications. Therefore, the IPAD index may be a clinically useful indicator of vascular aging. In addition, it may be a useful marker of peripheral stiffening due to the close correlation with baPWV. Tomiyama et al. [17] demonstrated that vascular health must be evaluated considering age, gender, and blood pressure by baPWV measurements. It is well known that the values of the aging index and the SI are influenced by aging, and it was shown that baPWV was significantly higher in an older group than in a younger group [18]. However, the present study showed that the vascular aging calculation of the proposed index is superior to that of the age index. Thus, the proposed index may be a useful marker for the assessment of vascular age. This suggests that the proposed index may reflect both arteriosclerosis and pulse wave velocity. In the future, a prospective follow-up study must be performed to validate the usefulness of the proposed index.
Acknowledgments
This work was supported by the Hallym University Research Fund (No. HRF-G-2013-4).
Notes
Conflict of Interest: No potential conflict of interest relevant to this article was reported.