Bayesian Network Model to Evaluate the Effectiveness of Continuous Positive Airway Pressure Treatment of Sleep Apnea
Article information
Abstract
Objectives
The association between obstructive sleep apnea (OSA) and mortality or serious cardiovascular events over a long period of time is not clearly understood. The aim of this observational study was to estimate the clinical effectiveness of continuous positive airway pressure (CPAP) treatment on an outcome variable combining mortality, acute myocardial infarction (AMI), and cerebrovascular insult (CVI) during a follow-up period of 15.5 years (186 ± 58 months).
Methods
The data set consisted of 978 patients with an apnea-hypopnea index (AHI) ≥5.0. One-third had used CPAP treatment. For the first time, a data-driven causal Bayesian network (DDBN) and a hypothesis-driven causal Bayesian network (HDBN) were used to investigate the effectiveness of CPAP.
Results
In the DDBN, coronary heart disease (CHD), congestive heart failure (CHF), and diuretic use were directly associated with the outcome variable. Sleep apnea parameters and CPAP treatment had no direct association with the outcome variable. In the HDBN, CPAP treatment showed an average improvement of 5.3 percentage points in the outcome. The greatest improvement was seen in patients aged ≤55 years. The effect of CPAP treatment was weaker in older patients (>55 years) and in patients with CHD. In CHF patients, CPAP treatment was associated with an increased risk of mortality, AMI, or CVI.
Conclusions
The effectiveness of CPAP is modest in younger patients. Long-term effectiveness is limited in older patients and in patients with heart disease (CHD or CHF).
I. Introduction
Obstructive sleep apnea (OSA) is a common nocturnal breathing disorder affecting about 8% of the Finnish adult population [1]. Several studies have reported an association between OSA and increased mortality [23]. OSA has been shown to increase the risk of stroke or death from any cause [4].
Continuous positive airway pressure (CPAP) is a standard treatment for OSA [5]. CPAP treatment, for example, is shown to improve results in Epworth sleepiness scale questionnaires, quality of life, and subjective sleepiness [6].
The aim of this study was to assess the clinical effectiveness of CPAP treatment on an outcome variable combining all-cause mortality, acute non-fatal myocardial infarction (AMI), and non-fatal cerebrovascular insult (CVI) during a follow-up period (186 ± 58 months). This analysis was done using a default hypothesis that CPAP has an effect on the mentioned combined outcome. This combined outcome was chosen because all-cause mortality, stroke, and coronary heart disease are the most important clinical consequences of OSA [7].
In this study, a Bayesian network model was chosen as a tool for analysis. The Bayesian network approach affords certain advantages over standard frequentist methods in analyzing data collected in real practice. For example, Bayesian network analysis provides a transparent representation of relationships between system variables using different sources of data. It can handle complicated data sets with missing data, outliers, and nonlinear relationships, and the results of the analysis can be presented in a visual form that is easy to interpret [891011]. The visual form uses directed acyclic graph (DAG), from which direct and indirect effects, common causes and effects can be discovered and mathematically expressed [12].
II. Methods
1. Novel Sleep Apnea Parameters
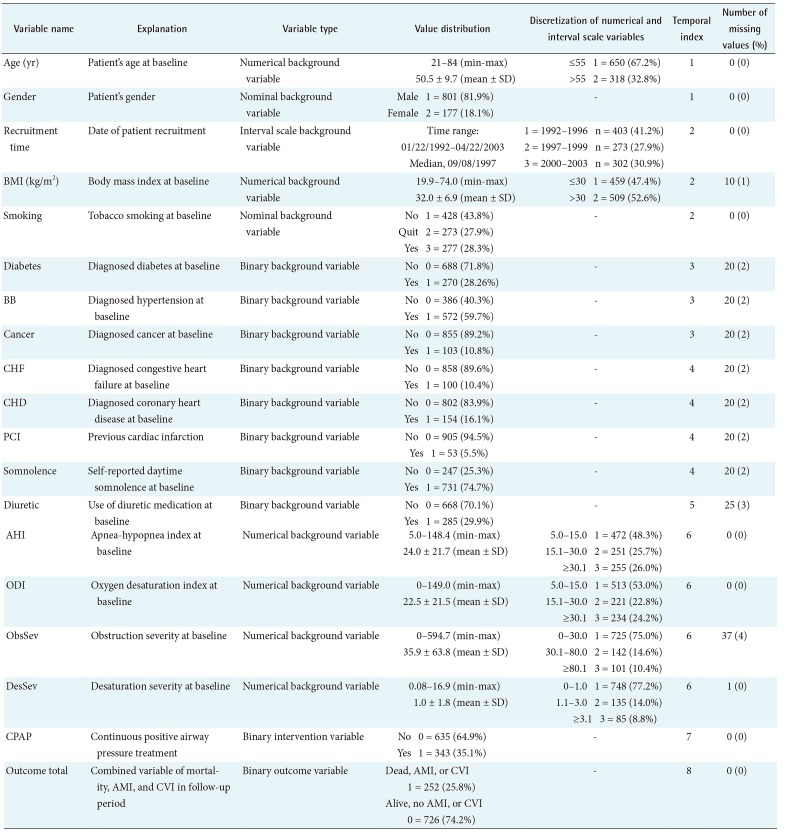
Diagnosis of OSA is based on daytime symptoms (e.g., daytime sleepiness) and an apnea-hypopnea index (AHI) or an oxygen desaturation index (ODI) [13]. We previously introduced novel desaturation severity (DesSev) and obstruction severity (ObsSev) parameters that account for the severity aspect of individual apnea, hypopnea, and desaturation events [1415]. The definitions of the novel parameters are presented in Table 1.
2. Patients
The database used in this study consisted of 2,037 consecutive patients referred for night polygraphy in the Department of Clinical Neurophysiology at Kuopio University Hospital (a large referral hospital in Eastern Finland) between 1992 and 2003. The original data set consisted of 119 variables, e.g., variables from polygraph recordings, treatments, and medications. There were 984 subjects omitted from the study from the study due to having an AHI lower than 5.0. In addition, 51 subjects were removed due to several missing values, and 24 subjects were removed due to having oral device treatment, leaving 978 patients for the analysis.
All the recordings were registered using a custom-made ambulatory device, Unisalkku [2141516], and they were reanalyzed using standard respiratory rules developed by the American Academy of Sleep Medicine (AASM) [13], as in our previous studies [141516171819].
In the present study, the follow-up time was defined as the time between the polygraph recording and death, AMI, or CVI; for the rest of the patients, it was the time between the polygraph recording and June 2014. Causes of death were acquired from Statistics Finland (Helsinki, Finland) in June 2014, and information about diseases, morbidities, and treatments was collected from the patients' medical records at Kuopio University Hospital. The subpopulations of the data set have been used previously [141516171819]. More detailed information about data collection and measurements is available in previous papers.
3. Bayesian Network Analysis
The statistical analysis was performed with Bayesian networks by using the BayesiaLab 5.3.3 tool [20]. A Bayesian network can be described as a DAG. It determines the factorization of a joint probability distribution over the variables (nodes of the DAG), where the factorization is defined as directed arcs of the DAG. A Bayesian network structure (i.e., a DAG) is constructed either manually or with machine learning based on observational data, for example, by a domain expert. We introduce a third alternative for structural learning—enabled by the tool we used—called expert-assisted machine learning, where the expert sets restrictions for the structural learning algorithm. Of the two main structural learning alternatives, constraint-based search and score-based learning [21], we applied the latter method. The search algorithm was Taboo [22], and the scoring method was two-stage minimum description length (MDL) [23].
A trade-off exists in MDL between the model's complexity and the model's fit to the data. The optimum model is one in which MDL (Model|Data) is at its minimum; in other words, simple model structures are preferred. The tool we used also offered the possibility to weigh the complexity part with a structural coefficient (SC) for situations in which the default value (SC = 1) does not produce credible results from the structural learning according to the experts' prior knowledge or research data. The structural coefficient is discussed more in Kekolahti et al. [24].
The objective in expert-assisted machine learning is to produce a Bayesian network in which arc directions correspond to causal assumptions of the data-generating model. In other words, when an arc exists from variable A to B, variable A is the cause of variable B, but if no arc exists, no direct causal relationship exists between them. Expert-assisted machine learning was used in the study in two ways, which are summarized below.
(1) A causal DAG is consistent with the research data. This structure is called a data-driven causal Bayesian network (DDBN). The restrictions set for the learning are the following. First, temporal indexes (relative temporal order between variables in the research data) are defined for variables that, based on the learning algorithm, can construct a structure in which the time-wise arc direction is from the older to the newer variable. Thus, situations in which a newer variable points to an older variable are blocked. Second, the number of variables can be limited in the model if they do not form any kind of dependency with other variables or if the variables are not relevant to the study. Third, the learning algorithm is informed that the learned arc direction between two variables is prohibited if the direction proposed by the Taboo algorithm does not make logical sense. In this case, two other alternatives, namely, the arc is missing and an opposite arc direction, are still allowed. This phase also contains discretization of the numerical values into meaningful intervals [25].
(2) A causal DAG is consistent with the hypothesis regarding the research question. We call this structure, simply, a hypothesis-driven causal Bayesian network (HDBN). The restrictions set for the learning are as follows. First, temporal indexes are defined for the variables. Second, variables can be excluded from the model if they do not form any kinds of dependency with other variables or if the variables are not relevant to the study. For example, the Markov blanket can be used for this phase. Third, the SC is adjusted if its default value does not produce credible structures according to the hypothesis, and the numerical values are discretized into meaningful intervals. Fourth, based on the hypothesis and prior knowledge, an arc is drawn manually and fixed between two variables to indicate their causal relation if the learning does not produce it automatically. Fifth, the learning algorithm is informed that the learned arc direction between two variables is prohibited if the direction does not make logical sense. In this case, two other alternatives, namely, the arc is missing and the arc direction is opposite, are still allowed.
Figure 1 describes the two expert-assisted learning processes, DDBN and HDBN, used in the study. Once the structural learning has been completed, parameter learning focuses on how the variables quantitatively relate to each other. For each variable in a DAG, conditional probability tables are estimated with the maximum likelihood method from the frequencies observed in the research data. This information is used to define the causal strength between two variables as information gain, i.e., as Kullback–Leibler divergence (DKL). It provides a natural method for this study to compare distributions of two connected variables [26]. That is to say, we estimate the strength of a specific arc as DKL in the context of the entire DAG. What if this arc were removed but all the others remained? Furthermore, direct effect (DE) is calculated between each variable and the outcome variable to compare the causal strength of the variables on the outcome variable. DE is based on Jouffe's proprietary likelihood matching algorithm [12], and it estimates the causal dependency between two variables by measuring the impact of a conditional mean of each state of variable A on the mean of variable B (outcome variable) with Kullback's minimum cross-entropy method MinxEnt [27] and by keeping the values of all other variables fixed. DE is especially suitable for situations where the dependency between two variables is linear.
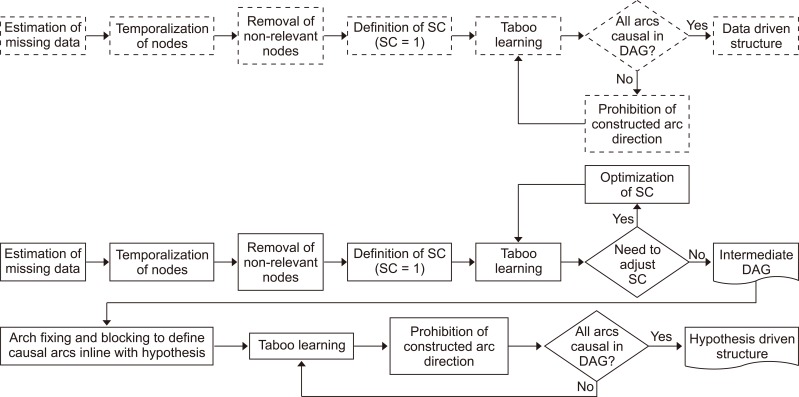
Process used to construct a hypothesis-driven (solid line) and a data-driven structure (dotted line). SC: structural coefficient, DAG: directed acyclic graph.
The research data contained 3.02% missing data (total data before excluding variables), whose type was missing at random (MAR). To maintain the number of samples, samples with missing data were kept, and the missing data were estimated by using a structural equation model (EM) algorithm [28].
The number of variables was reduced from 119 to 19 using an augmented Markov blanket algorithm. In this preliminary analysis, the SC value was set to 0.6 to find all potentially affecting variables. Variables connected to the variable Outcome total were included in the analysis. Sleep apnea parameters and CPAP treatment were selected by using a local SC value of 0.4 for them.
The discretization of the numerical variables was performed manually by using two alternative methods: (1) a decision tree algorithm, setting the variable Outcome total as the target, or (2) clinically commonly used thresholds (when using a decision tree algorithm was not possible). The discretized values as well as the total data set are presented in Table 2.
A temporal index (TI) was assigned to each variable to indicate the relative temporal order between variables, as seen in Table 2. To do this, the variables were divided into eight time categories according to knowledge about the variables' appearance. Thus, the variable age had a TI = 1 (oldest known measured value), and Outcome total had a TI = 8 (last measurement at the end of the follow-up period), for instance.
Arcs between the nodes indicate causality fulfilling the temporality criterion (newer variable cannot point to older variable as a function of time). However, arcs between variables having the same TI show no causality. For example, arcs between sleep apnea parameters like DesSev→AHI do not indicate causality because both variables were measured at the same time and they have the same TI value. Expert opinion was used to determine causality in a case with an obvious wrong direction of the arc. As an example, an arc direction of CHD→Diabetes was manually forbidden, but the opposite direction and no arc were allowed.
In the next step, the modeling process was changed from a DDBN to an HDBN. According to the default hypothesis, CPAP was considered to have a DE on Outcome total, even though this hypothesis was not supported by the DDBN. The model was simplified by limiting the number of variables to include only the most prominent ones (nine variables). The variable Diuretic was dropped because it was considered to be a marker, not a causal factor for Outcome total.
In the HDBN approach, an arc was manually added from variable CPAP to Outcome total. In the inference phase (i.e., when the constructed model was used), the variable CPAP was set to be an intervention. In this way, real causal dependencies between CPAP and the outcome variable could be identified when this model was purged of unwanted associational backdoor paths between them [12].
Figures 2, 3, 4 were drawn with DAGitty software [29].

Data-driven model of factors associated with target variable Outcome total. Nodes are presented in temporal index order, with parent nodes at the top and child nodes at the bottom. Other variables were dropped from the analysis. Blue node with vertical bar indicates outcome variable; green node with triangle, exposure variable; green nodes, ancestors of exposure variable; red nodes, common ancestors of both exposure and outcome; blue nodes, ancestors of outcome; green arrow, causal path; red arrow, biasing path; and black arrows, other connections.
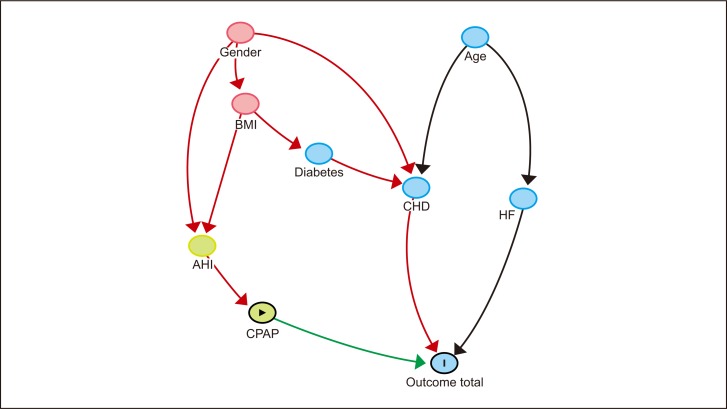
Simplified hypothesis-driven model with target variable Outcome total. Nodes are presented in temporal index order, with parent nodes at the top and child nodes at the bottom. According to the hypothesis, an arc from CPAP to Outcome total is added and fixed to the model. Blue node with vertical bar indicates outcome variable; green node with triangle, exposure variable; red nodes, common ancestors of both exposure and outcome; blue nodes, ancestors of outcome; green arrow, causal path; and black arrows, other connections.
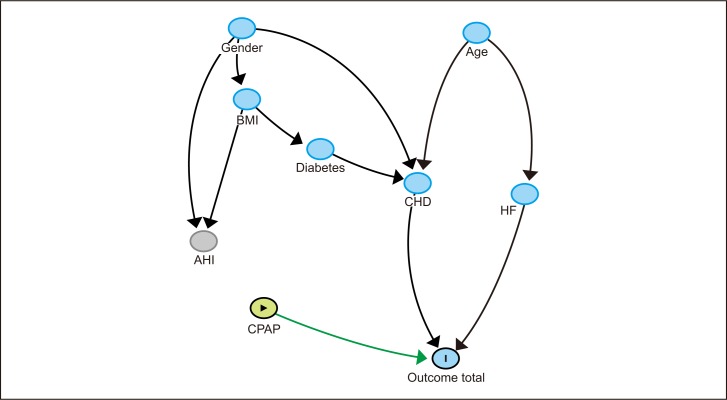
Simplified hypothesis-driven model with target variable Outcome total. According to the hypothesis, CPAP was set to an intervention mode and separated from associative paths. Blue node with vertical bar indicates outcome variable; yellow node with triangle, exposure variable; yellow nodes, ancestors of exposure variable; blue nodes, ancestors of outcome; green arrow, causal path; and black arrows, other connections.
The Research Ethics Committee of the Hospital District of Northern Savo, Kuopio, Finland approved the protocol, and all the subjects gave written informed consent (No. 127/2004 and 14/2013).
III. Results
The variables with values, distributions, discretizations, temporal indices, and number of missing data are presented in Table 2.
The mean length of the follow-up period was 186 months (standard deviation 58 months, variation 0–276 months). During the follow-up period, altogether 185 patients died (18.9%), of which 154 were men and 31 were women. In addition, 55 men (8.5%) and 12 women (8.2%) had AMI, CVI, or both during the follow-up period.
A total of 252 patients died or had AMI, CVI, or both during the follow-up period. The 209 men (26.12%) and 43 women (24.3%) comprised 25.8% of all patients. Of the patients, 343 (35.1%) had used CPAP treatment for at least 6 months or had continued CPAP at the end of the follow-up.
The DDBN model made by the Taboo algorithm (SC = 1) for the outcome variable Outcome total is presented in Figure 2. In the DDBN model, variables CHD, Diuretic, and CHF were causally associated with the outcome. No causal association between sleep apnea parameters or CPAP and the outcome variable was seen. Instead, there was a path between CPAP and Outcome total consisting of associational dependencies. There was a weak association between AHI and Outcome total due to common causes BMI and Gender.
The variable Recruitment time was included in the DDBN model (Figure 2) because the patient recruitment period was long (11 years), and Recruitment time was considered a potential source of bias. There was an association between Recruitment time and the variable CHF, indicating that congestive heart failure was a more common finding in patients before the year 2000 than after. However, there was no DE between Recruitment time and Outcome total.
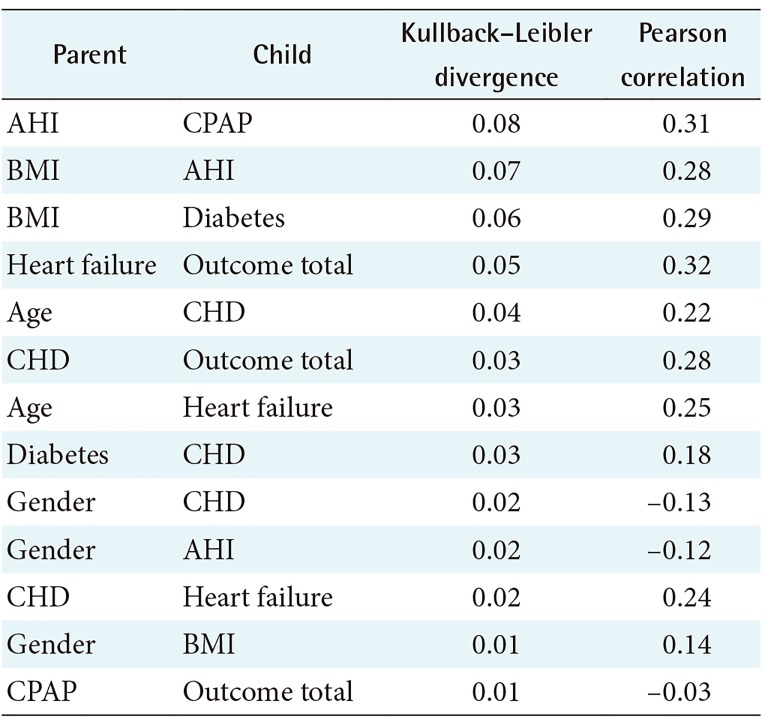
The relationship analysis of the DDBN model with Kullback–Leibler divergence and Pearson correlation is presented in Table 3. Sleep apnea parameters were strongly associated with each other (for example, AHI→ODI had the strongest association).
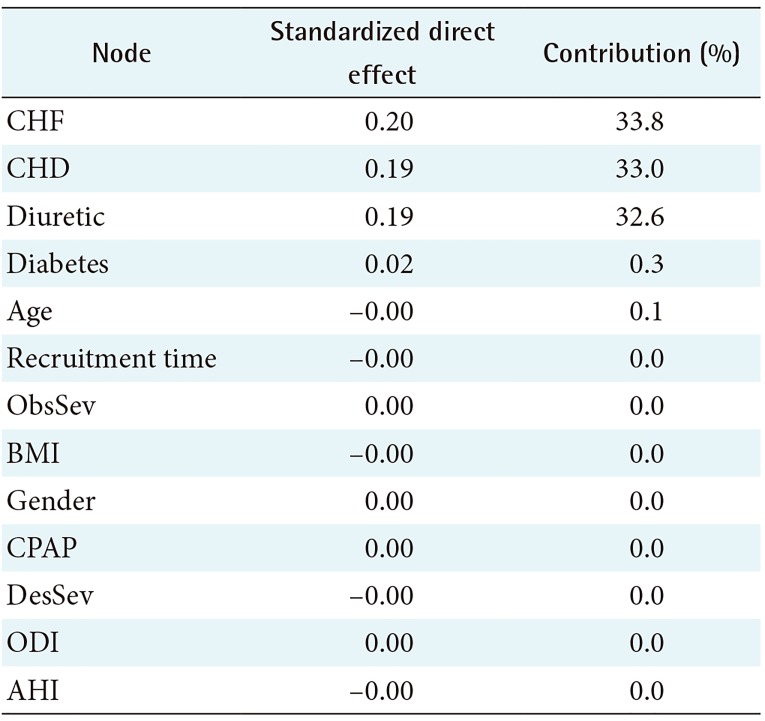
Analysis of DE on the target outcome variable Outcome total is presented in Table 4. Variables CHF, CHD, and Diuretic have strong direct effects on Outcome total. Sleep apnea parameters and CPAP have only a minimal DE on the target. In other words, based on the DDBN approach, there is no causal relationship between CPAP and the outcome variable.
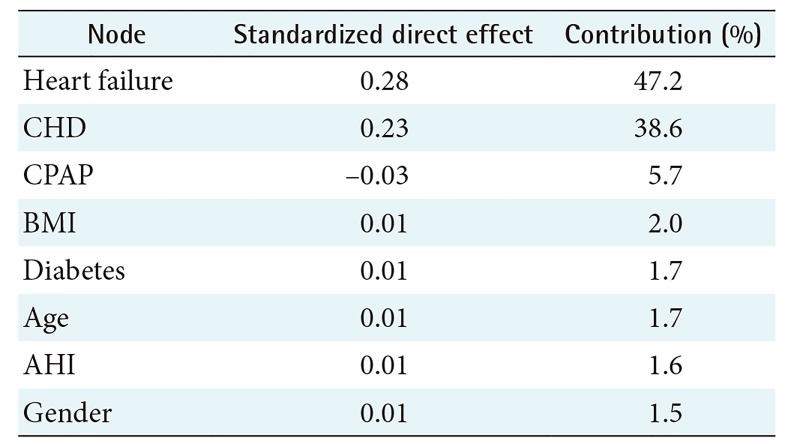
The HDBN model is presented in Figure 3. The relationship analysis of this model is presented in Table 5, and direct effects on the target are presented in Table 6. In this model several paths from CPAP to the target were found; only one path is causal, i.e., the direct link from CPAP to Outcome total. All other paths from CPAP to Outcome total are associated with BMI or Gender as a common cause.
The HDBN model with the variable CPAP set as an intervention is presented in Figure 4. When CPAP is an intervention, this intervention variable is separated from all non-causal associations. This model was fixed independently for each value of the variables, and the results are presented in Table 7. In general, CPAP treatment showed a 5.3 percentage points improvement in Outcome total in comparison with no treatment. The most improvement was seen in patients aged 55 years or less (8.4% improvement with CPAP in comparison with no treatment). In patients with CHF, CPAP treatment showed a 10.2% increase in risk of mortality, AMI, or CVI (HDBN models number 16–17 in Table 7).
IV. Discussion
This analysis is, as far as we know, the first study in which an expert-assisted Taboo learning process with MDL scoring and causal Bayesian networks have been used to estimate clinical effectiveness. No causal query can be answered from data alone, without causal information that lies outside the data. Therefore, expert knowledge is required to complement the analysis [12]. This knowledge was exploited in the study in multiple ways, e.g., defining the known temporality between the variables, blocking non-relevant links from a causal point of view, and adding causal links based on the default hypothesis. But are the discovered dependences really causal in the sense in which it is defined in [12] as docalculus-equation? The implemented causal analysis follows the guidelines in [30]. Therefore, we can claim that, within the observed variables, the dependences are causal. However, due to weak dependences between multiple variables, causal dependences similarly are weak. Therefore, this has led to some differences between data-driven and hypothesis-driven networks when MDL scoring has been used.
This analysis used patient data obtained from a large referral hospital. We consider the data, which included information about diagnosis of sleep apnea as well as deaths and serious complications, to be very reliable and almost free from information bias.
To avoid modeling biases, several alternative versions were used for discretization and temporal indices, and expert knowledge was used to set arcs and variables for the final analysis. An analysis for mortality alone was also done. The differences between the models were minor.
In a study by Kendzerska et al. [31], the following factors were prognostic factors for cardiovascular disease in sleep apnea patients: time spent with oxygen saturation, sleep time, awakenings, periodic leg movements, heart rate, and daytime sleepiness. In our study, the same factors were not associated with the combined outcome. In our study, all-cause mortality was 18.9%, which is line with the results of Marshall et al., [32] who found 20-year all-cause mortality to be 19.4%.
In the DDBN, no direct association between sleep apnea parameters or CPAP treatment and the outcome variable was found. A weak non-causal association between AHI and Outcome total can explain the results reported by Rich et al. [3]. BMI was clearly a common cause for both CPAP treatment (and for all the variables in the path from BMI to CPAP) and Outcome total.
In this study, the follow-up time was long, at an average of 15.5 years. The weak effect of sleep apnea parameters and CPAP treatment on the outcome variable might be explained by the long follow-up period. According to Meinow et al. [33], health-related indicators are unstable, and their effect is strongest in a 1–2-year follow-up. In a longer follow-up, all health-related factors become weaker predictors of mortality.
In the HDBN, a long-term beneficial effect of CPAP treatment was found. This effect was generally a 5.3 percentage points improvement in the risk of death, AMI, or CVI. This result suggests that the dependency between CPAP and Outcome total consists of a causal dependency and spurious associational dependencies enabled by BMI and Gender as common causes. This result can be compared with the study by Jennum et al. [34] who found that CPAP therapy is associated with reduced all-cause mortality in males, but not significantly in females.
Besides the long follow-up, our results differ from analyses done using conventional methods in two other ways. First, our study aimed to estimate clinical effectiveness, which differs from efficacy measurement in randomized trials. Secondly, most conventional methods in sleep apnea research using observational data are unable to distinguish direct effects from associational effects.
In addition, in patients with CHF, an increased risk of death, AMI, or CVI was seen when CPAP was used. This result is opposite to the findings of previous studies [3536], which indicated a beneficial effect of CPAP on CHD and CHF. This result suggests that an unknown factor exists that mediates the association between CPAP and CHF. The result can be compared to those of some studies that have shown a detrimental effect of CPAP in CHF patients [373839]. The divergence between DDBN and HDBN may be due to differences between subgroups.
We consider that the methodology used in this study gives a realistic view of treatment effectiveness. Bayesian methods also have potential value in analyzing similar problems in other contexts. The prognosis of OSA and the effectiveness of CPAP can be estimated on an individual level using prognostic factors in patients' demographic factors, comorbidity, and the results of sleep polygraphs. The effectiveness of CPAP is seen in patients without other diseases, but in more severely ill patients, the prognosis is determined by the underlying diseases. CPAP is an effective treatment that loses its effectiveness in patients with serious cardiovascular disease.
Notes
Conflict of Interest: OPR is a shareholder in Wisane Ltd., a company producing analyses in health care. The other authors have no conflicts of interest.


