Simple Wearable Device to Reduce Stress When Delivering a Speech without Pre-training
Article information

Abstract
Objectives
There are many occasions in modern life when people must deliver presentations in front of audiences. Most people feel nervous before and while giving a speech. If there were a simple way to ease their stress, speakers would be able to perform better and their quality of life would improve. Consequently, this study aimed to alleviate the stress of speakers giving speeches by regulating breathing using a simple device.
Methods
To achieve this goal, a popular device, the Apple Watch, was chosen. Twenty-eight participants were divided into two groups: the Breathe app group and the non-Breathe app group. The Breathe app group regulated their breathing using the Breathe app installed on an Apple Watch before speech preparation. The non-Breathe app group listened to an explanation of the experiment so that they could not undertake their own stress-easing strategies. Participants prepared speeches about themselves and delivered them in front of the researcher.
Results
The Breathe app exercise eased stress during the exercise itself and the preparation phase of the speech task based on participants’ cardiac activity. However, stress was not alleviated during speech delivery.
Conclusions
Based on the experimental setting and results of this study, together with the findings of previous studies, introducing pre-training sessions and performing stress-easing tasks before and/or during a speech, such as sending vibrations to participants’ wearable devices, might be an effective way to reduce stress when delivering speeches immediately after the breath-regulating task.
I. Introduction
In the course of modern life, there are many occasions when people feel nervous. Examples include giving a presentation in front of an audience, playing live music, or taking an entrance examination. In some cases, people become too nervous to perform well. Yerkes and Dodson [1] described the relationship between stress and performance for the first time in 1908 and found that people tended to perform at their best when the degree of stress was neither too large nor too small. Managing one’s stress can lead to the best possible performance.
Anxiety also negatively affects human performance [2]. There are two types of anxiety: state anxiety and trait anxiety. State anxiety indicates how people feel at a certain moment, whereas trait anxiety indicates how people feel in their everyday lives. The Spielberger State-Trait Anxiety Inventory (STAI Form Y) [3] evaluates each type of anxiety using two independent inventories: STAI Form Y-1 (State Anxiety Scale) and Y-2 (Trait Anxiety Scale).
Many methods can be used to alleviate stress. They can be categorized into two groups: those that require training and those that do not. Examples of the former are relaxing one’s muscles gradually [4], meditation [5], and deep breathing [6]. An example of the latter is listening to classical music [7,8]. A disadvantage of methods that require training is that those who fail to train well may not benefit from the effects of these strategies. Anyone should be able to relax and alleviate stress easily using a common device.
Wearable devices have rapidly gained popularity in recent years. In particular, the Apple Watch (Apple Inc., Cupertino, CA, USA) is the most popular of such devices, with a market share of 55.5% in the wearable device market in the first quarter of 2020 [9]. Apple Watches can be found at most electronics shops and via online retailers at reasonable prices. One study involving Apple Watches that recruited 400,000 participants found that the watch could detect atrial fibrillation [10]. The Apple Watch’s functions have been confirmed through research. Apple Watches were found to be the most accurate device for measuring energy expenditure, steps, heart rate (HR), and distance in a study that compared functions between the Apple Watch, Fitbit Surge, and Actigraph [11]. Other studies have found that the Apple Watch was the highest-performing device in terms of HR error and the correlation coefficient with the reference device, allowing it to be considered the gold-standard device [12–14]. Moreover, the Apple Watch comes installed with a breathing regulation application called the Breathe app.
Some studies have examined the effectiveness of various features of wearable devices. For example, one study found that slow haptic feedback produced by the BoostMeUp app, an original application installed on an Apple Watch, when combined with Polar H7 (Polar, Kempele, Finland), reduced anxiety and increased heart rate variability (HRV) in wearers, which enabled participants to perform better on mathematical tests. Conversely, fast haptic feedback had the opposite effect [15]. Another study found that slow heartbeat-like vibrations produced by a wearable device reduced wearers’ subjective anxiety during speech tasks [16,17].
Giving a presentation in front of people is a necessary skill for various social activities. Nevertheless, high stress can prevent people from performing well. If speakers could alleviate stress easily and conveniently, their performances would improve, yielding benefits for both presenters and audience members. As described in the previous paragraph, earlier studies have proven that wearable devices can help to reduce subjective anxiety during speech preparation and speech delivery [16,17]. Nonetheless, in those studies, no changes were observed in terms of physiological parameters such as HR and HRV for alleviating stress. The studies also used devices that were not widespread. The objective of this study was to examine the effectiveness of the Breathe app, which is included with the Apple Watch—a popular, easy-to-use, and highly functional device—to physiologically and subjectively alleviate stress while giving speeches without pre-training. This study investigated whether breathing regulation using the Apple Watch decreased stress during speech delivery or speech preparation and examined whether the Breathe app was an effective tool for stress relief—with potential implications for performance improvement—during or before a presentation.
II. Methods
1. Participants
For this study, 28 people were recruited using an on-campus bulletin board system. The sample size was the maximum number of participants that we could recruit at our university campus during a certain period. Participants received a JPY 1,000 prepaid card as a reward for their participation and ranged in age from 18 to 40 years old, with a mean age of 22.79 ± 4.12 years. Of the 28 participants, eight were men and 20 were women. Before the experiment, it was confirmed that none had any cardiovascular disease that might affect their HR measurements, and none had ever hyperventilated or collapsed due to stress.
This study was approved by the Ethics Committee of Okayama University (Approval No. R1909-003; Registration No. UMIN000037759). All participants provided written informed consent. For participants under 20 years old, consent was obtained from a legal guardian.
2. Experimental Design
Participants were divided randomly into two groups—the Breathe app group and the non-Breathe app group—using the permuted block method with a block size of 9 (Table 1). Each group was assigned a series of tasks to complete in 10 minutes before they prepared to give a speech.

Participants’ sex and age distribution in each group
1) Breathe app group
Participants performed two 5-minute breath regulation cycles. This entailed regulating the timing of one’s inhalations and exhalations and taking deep breaths according to the movement of an animated graphic shown on the Apple Watch Breathe app and the vibration transmitted to the wrist. The rate of movement and the rate at which the device vibrated was set at six times per minute, since that is when most people achieve their highest HRV [18].
2) Non-Breathe app group
To prevent participants from relaxing using strategies other than the Breathe app, they were asked to listen to an explanation of the study for 10 minutes before preparing to speak. The researcher showed slides on a monitor and explained the purpose, content, and necessity of the presentation.
3. Procedure
This study’s protocol (Figure 1) was based on the Trier Social Stress Test [19]. All participants wore a mobile, single-lead electrocardiograph (duranta; ZAIKEN Co. Ltd., Tokyo, Japan). First, they rested for 5 minutes. To ease their stress, “Air on the G String,” composed by Johann Sebastian Bach, was played as background music. Next, they completed a State-Trait Anxiety Inventory-S (STAI-S) questionnaire. They then performed the assigned tasks for 10 minutes. Next, they were moved to a second room where lighting, a video camera, and a microphone were prepared. Participants stood in front of the camera and were told the following: (1) their speech would be videotaped and rated in real-time by four evaluators in another room based on their speaking style, their use of language, and the contents of the speech; (2) their voice would be recorded, and its frequency would be analyzed; (3) their speech would be rated; and (4) they had to finish their speeches within 5 minutes. They were also given a speech topic. Next, they returned to the first room and were given 10 minutes to prepare the speech. Once they had prepared, they returned to the second room and delivered the speech for 5 minutes. They were asked to continue speaking if they finished delivering their speech early. After the speech was over, they completed the STAI-S questionnaire for a second time. They then returned to the first room and were asked not to talk about the content of the experiment with others. They received a JPY 1,000 prepaid card as a reward for participation. The researcher accompanied them each time they moved to another room.
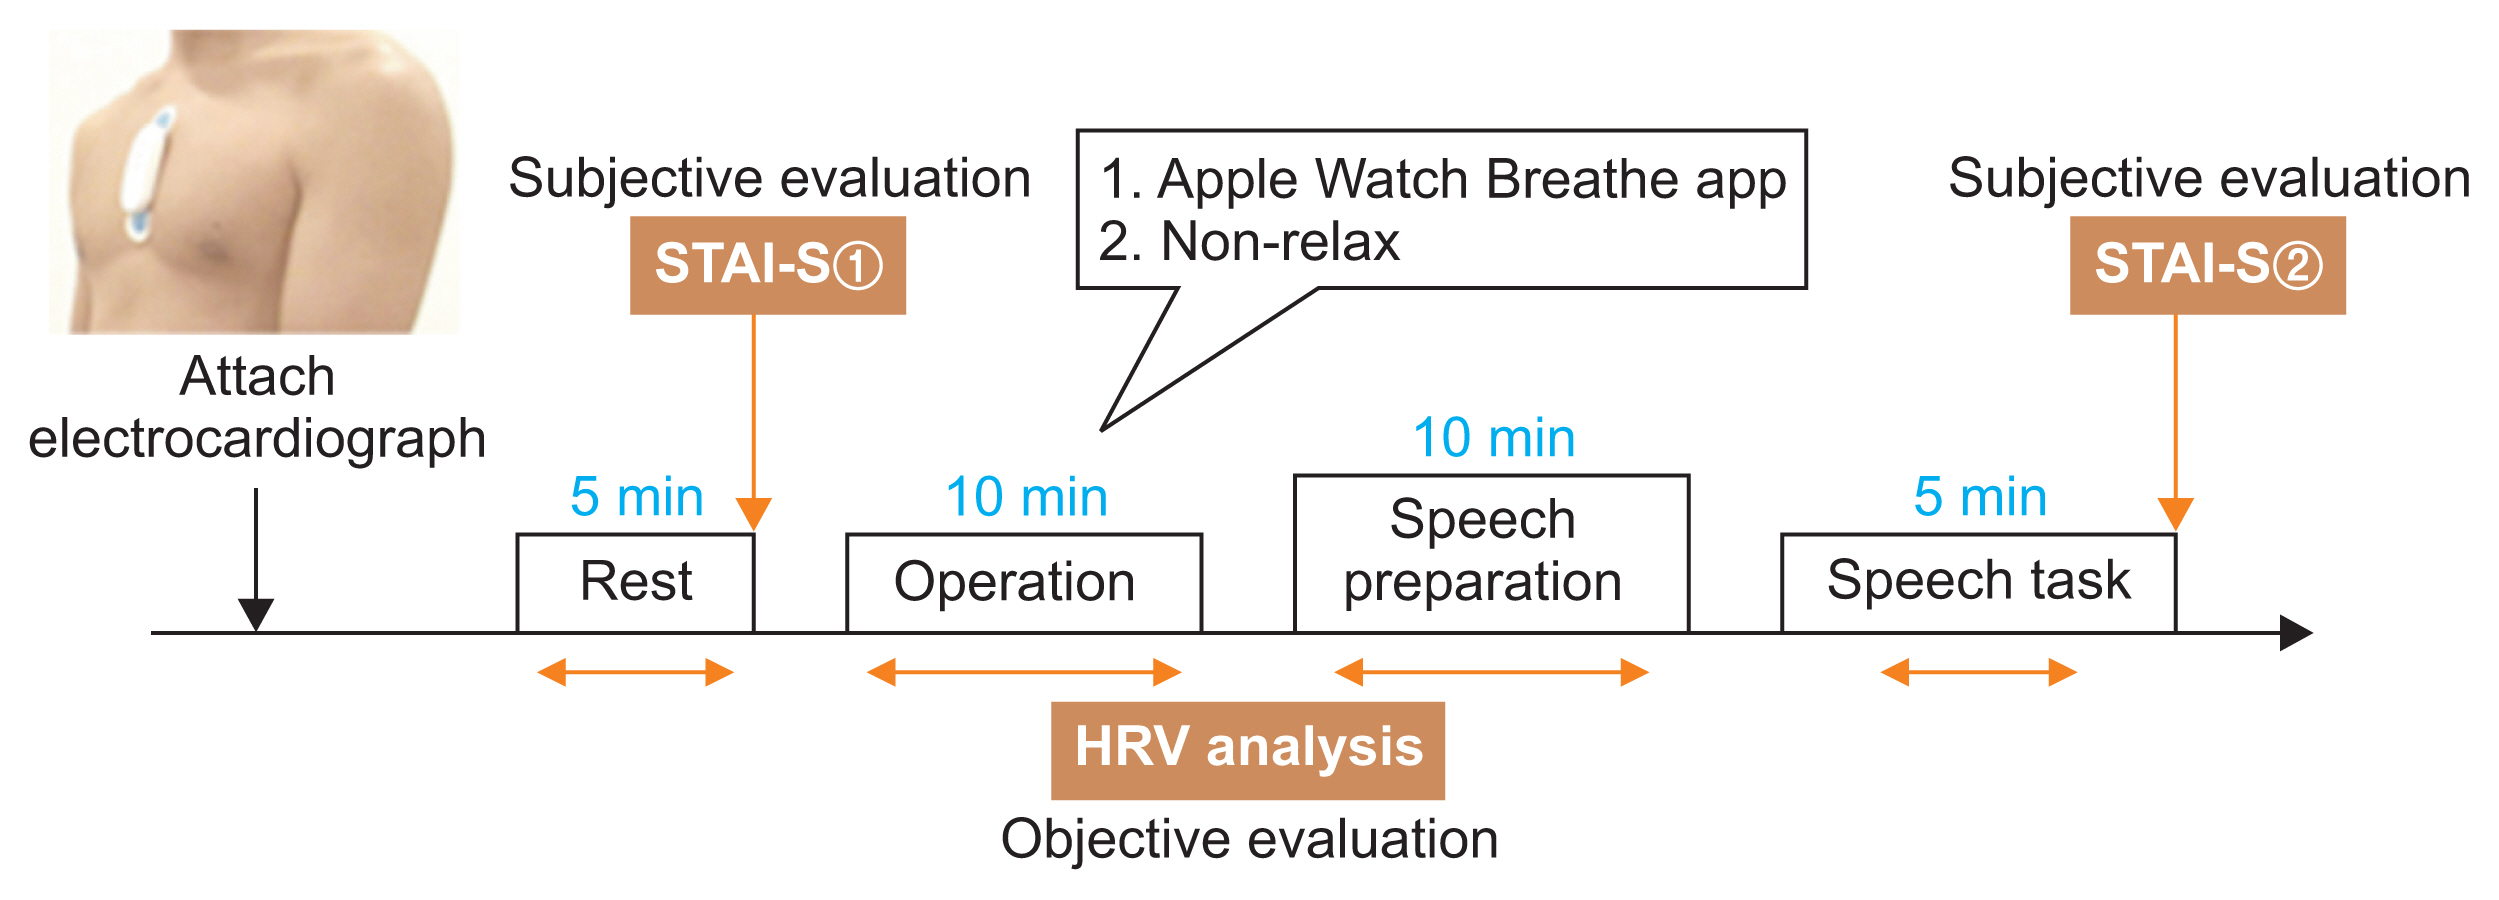
Study protocol. After attachment of the electrocardiograph, the participants took a 5-minute rest, performed their assigned task for 10 minutes, prepared a speech for 10 minutes, and delivered a speech for 5 minutes. State-Trait Anxiety Inventory (STAI-S) questionnaires were used to subjectively evaluate stress during rest and speech delivery. Heart rate variability (HRV) analysis was conducted to provide an objective, physiological measure of stress.
4. Acute Stress Task
Participants performed a speech task as their acute stress task. During their 5-minute speeches, participants were instructed to talk about (1) themselves, (2) sales points, and (3) how to become like their ideal role model. The order in which these speech topics were discussed and for what duration were determined by the participants. This speech topic was designed by the authors to be difficult to answer since a simple topic might not induce enough stress for the purposes of the study.
5. Objective Evaluation
The time series of the RR interval, the root mean square of successive differences (rMSSD), and HR were determined using an electrocardiograph. Its sampling rate was 160 Hz and the electrode types used were bipolar leads. The power of the low-frequency (LF) component and the high-frequency (HF) component were also calculated to obtain the LF/HF ratio.
Text files of the electrocardiogram data were extracted from the electrocardiograph and were recorded in LabChart version 8 (ADInstruments, Dunedin, New Zealand). HRV-related variables such as HR, the LF/HF ratio, and rMSSD were calculated using the LabChart Pro algorithm (HRV module version 2.0.3). The Welch method was used to perform power spectral density analysis. Ectopic beats were removed when calculating HRV.
According to the international guidelines for HRV analysis, at least 2 minutes of recording is needed to accurately measure the LF component, and a sampling rate of 200 Hz or higher is needed to decrease errors [20]. Although the sampling rate of this study (160 Hz) did not satisfy this standard, the recording duration of this study (5 minutes and 10 minutes) did.
6. Subjective Evaluation
Participants completed the STAI-Form JYZ questionnaires [3], which is a version of the STAI questionnaire adapted into Japanese [21], to evaluate the participants’ state anxiety. The lowest possible score was 20 and the highest was 80. In this study, only state anxiety was used to evaluate transient emotional changes after speech delivery.
7. Statistical Analysis
The Dunnett test was performed to determine the validity of the speech task. The unpaired t-test was used to investigate the validity of the stress-relieving operation and its effects on the degree of nervousness during speech delivery or speech preparation. The paired t-test was used to compare HR of the Breathe app group at rest with that during the stress-relieving operation and STAI-S scores of the non-Breathe app group at rest with those after the speech delivery. All statistical analyses were conducted using GraphPad Prism7 software (GraphPad Software Inc., San Diego, CA, USA). All statistical tests were two-sided; p-values of less than 0.05 were considered to indicate statistical significance.
Whether the speech task induced stress was examined using HR, LF/HF readings, and STAI-S scores. The effectiveness of the Breathe app at reducing stress was assessed by measuring rMSSD and comparing it between the Breathe app and non-Breathe app groups. Since the LF/HF ratio is affected by deep breathing [22], this indicator was determined to be unsuitable for evaluating stress reduction as the participants practiced breathing regulation. Since the rMSSD is largely not affected by deep breathing [23], it was used instead to evaluate stress.
III. Results
1. Validation
1) Validation of the speech task
Whether the speech task induced stress was examined using the Dunnett test. During speech preparation and delivery, the non-Breathe app group showed higher levels of perceived stress, had significantly higher HRs (rest vs. preparation, p < 0.001; rest vs. speech, p < 0.001), LF/HF (rest vs. preparation, p < 0.001; rest vs. speech, p = 0.0032), and STAI-S scores (rest vs. speech, t = 6.833, p < 0.001) compared to the corresponding values during rest (Figure 2). Therefore, the speech task succeeded in inducing stress. Each value is shown in Table 2.
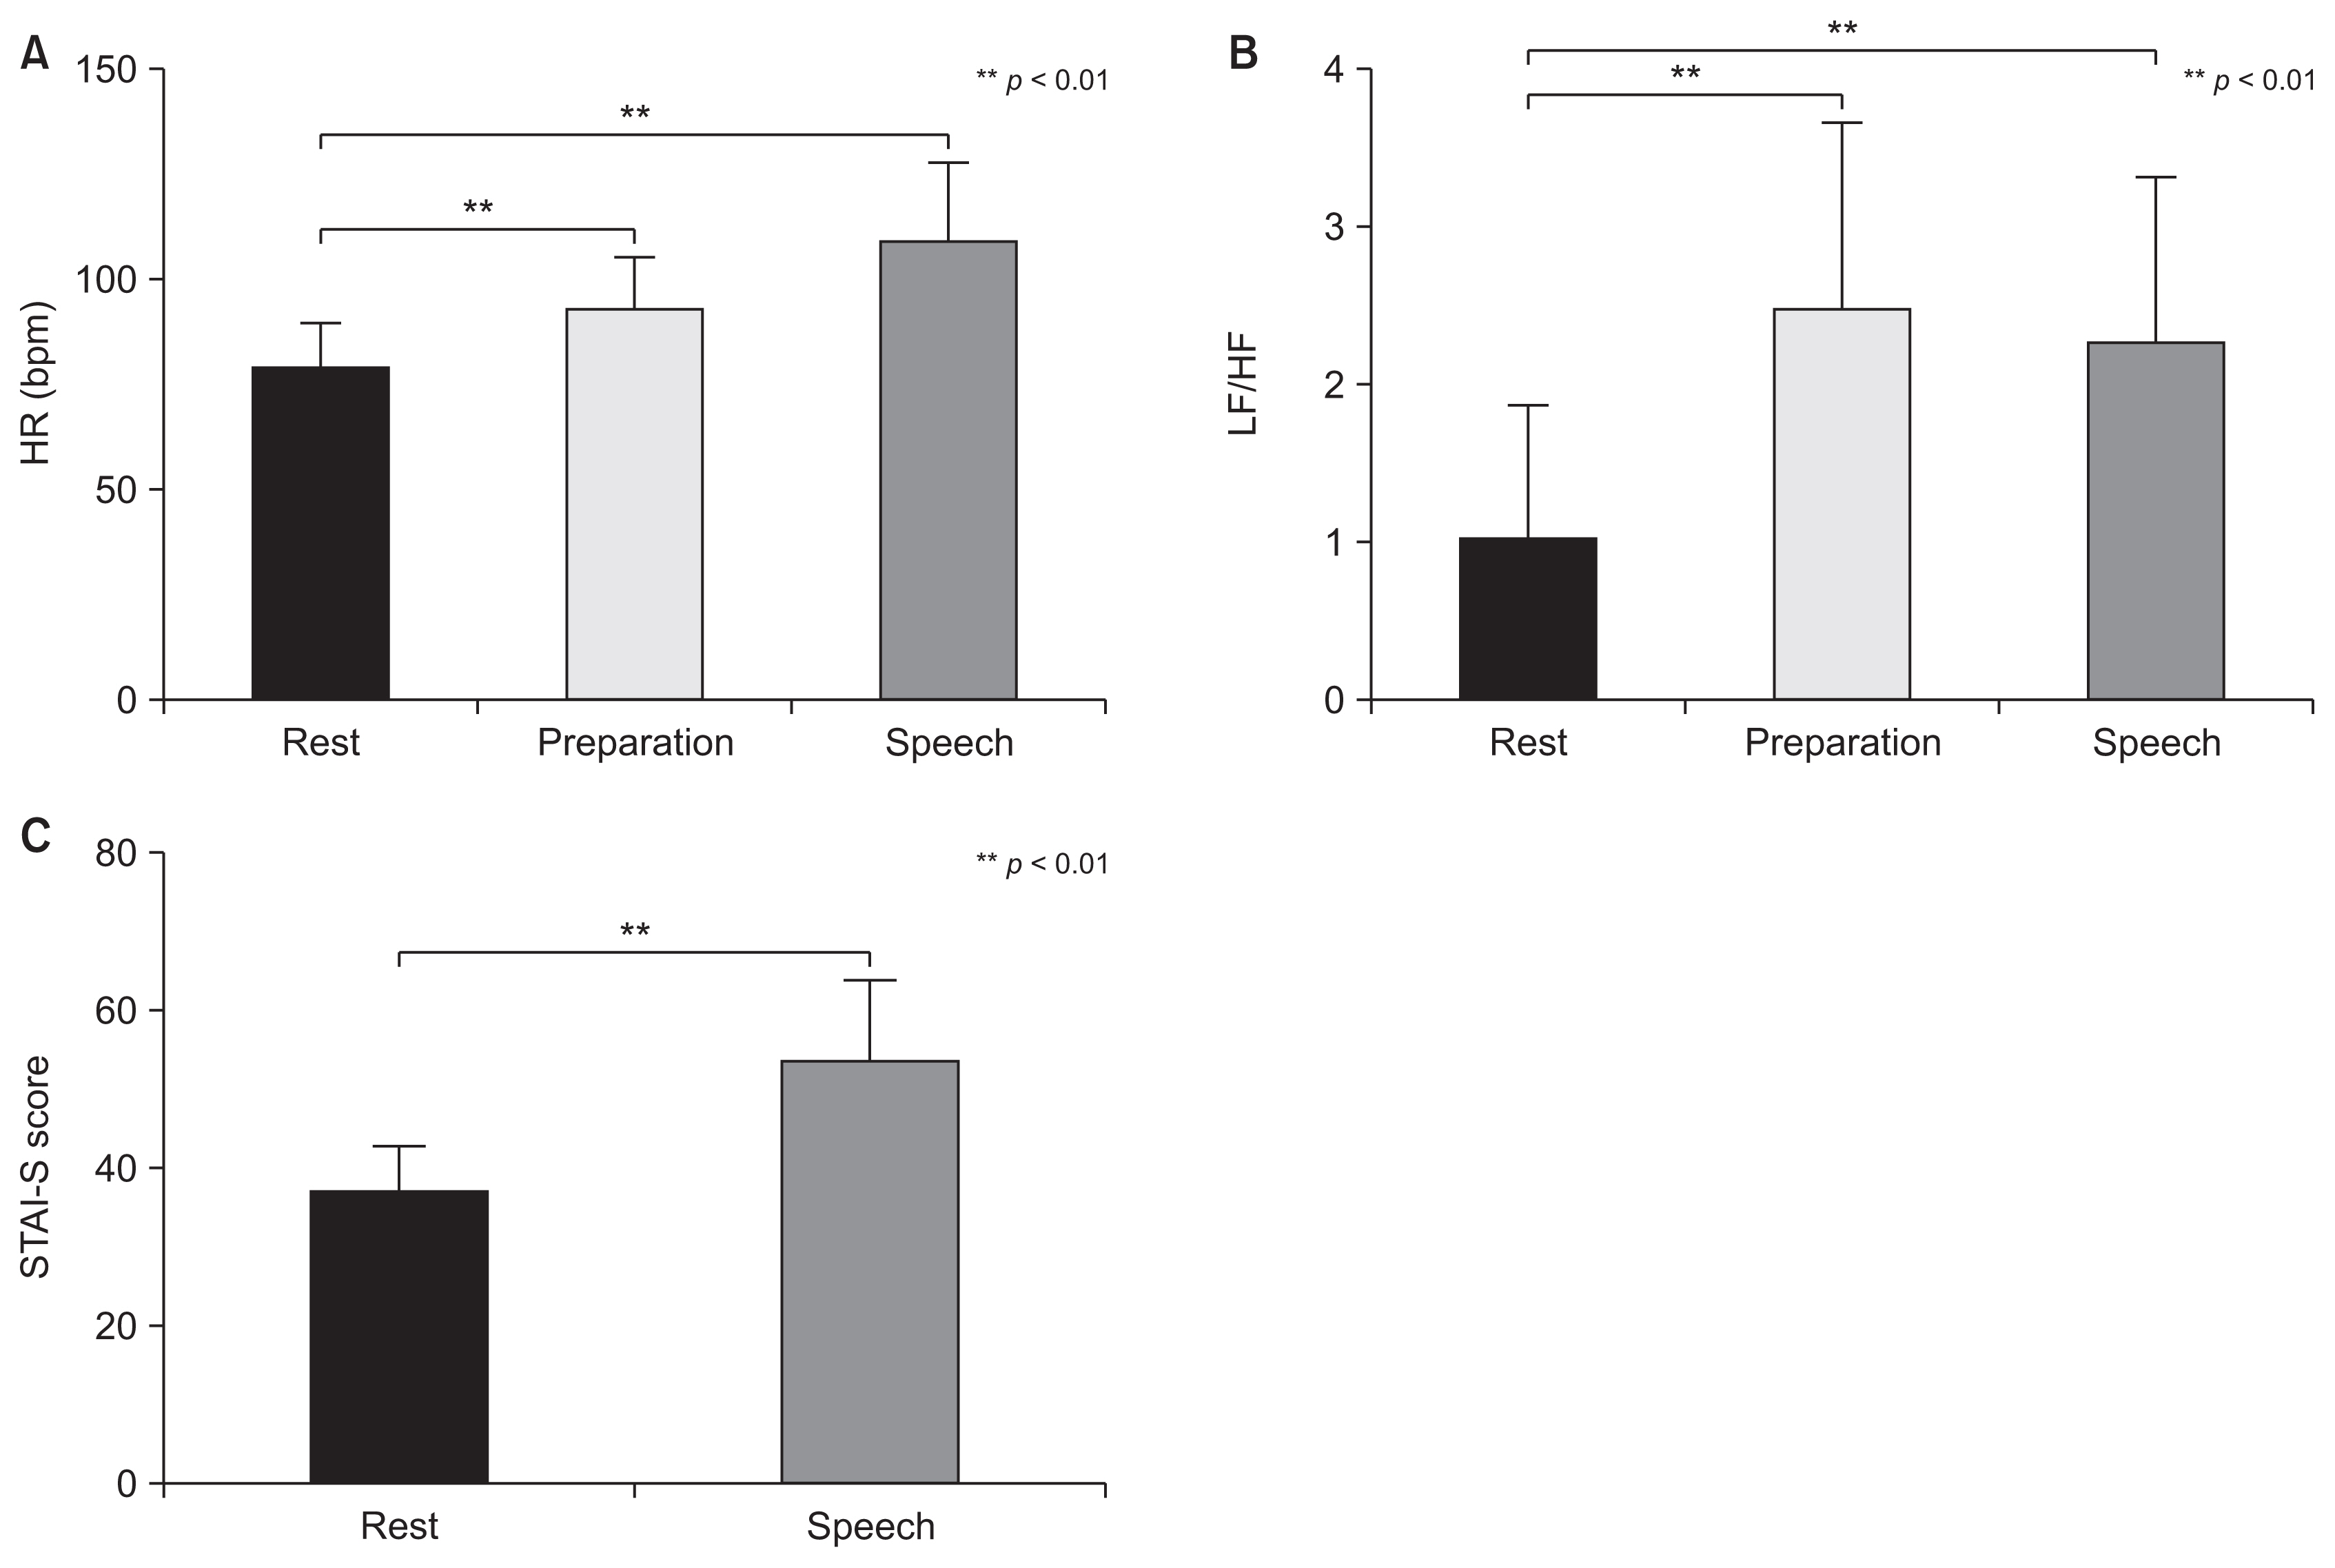
Differences in state anxiety of the non-Breathe app group shown in HRV and STAI-S scores, comparing the rest step to the speech preparation step and the rest step to the speech delivery step. The mean and standard deviation for HRV measures and STAI-S scores are shown on the graphs. (A) Participants from the non-Breathe app group had increased HRs during speech preparation and delivery compared to during the rest step (Dunnett test, p < 0.01). (B) Participants from the non-Breathe app group had increased LF/HF ratio during the speech preparation and delivery steps compared to during the rest step (Dunnett test, p < 0.01). (C) Participants from the non-Breathe app group had increased STAI-S scores after the speech delivery step compared to during the rest step (paired t-test, p < 0.01). STAI-S: State-Trait Anxiety Inventory (state anxiety), HRV: heart rate variability, HR: heart rate, HF: absolute power of high frequencies, LF: absolute power of low frequencies.

Mean values and standard deviations for STAI-S and HRV analyses
2) Validation of the stress-easing task
The effectiveness of the Apple Watch Breathe app at easing stress in comparison to the non-Breathe app group was assessed using the unpaired t-test and paired t-test. While participants used the app, lower levels of perceived stress and significantly higher rMSSD (non-Breathe app vs. Apple Watch, p = 0.0046) were measured than in the non-Breathe app group (Figure 3). This result leads us to conclude that the participants were more relaxed during the stress-easing task.
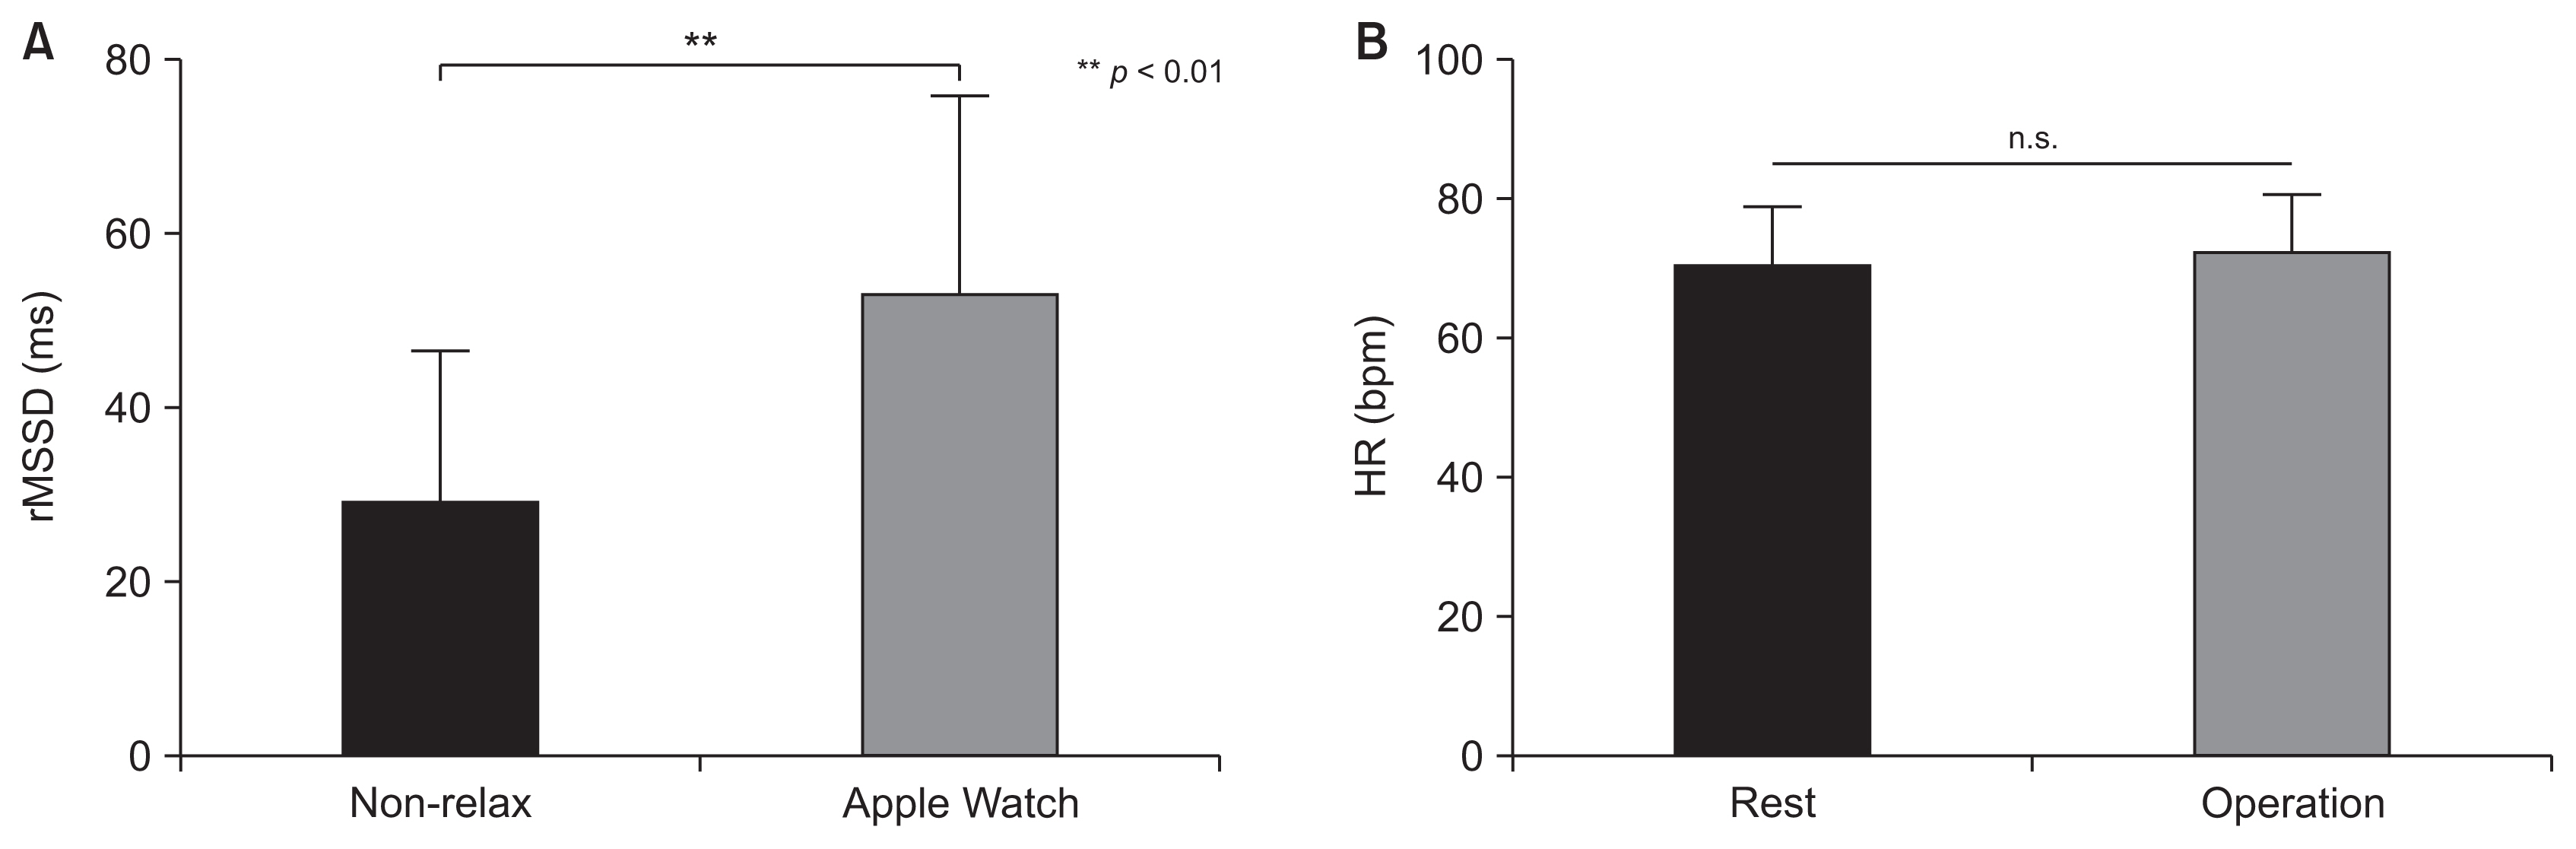
A) Differences in rMSSD during the breath-regulating task between the Breathe app group and non-Breathe app group. The mean and standard deviation for rMSSD are shown on the graph. Participants in the Breathe app group showed an increase in rMSSD compared to those in the non-Breathe app group (unpaired t-test, p < 0.05). (B) Differences in state anxiety of the Breathe app group measured in HR, comparing the rest step to the breath-regulating task step. Both steps showed similar HRs (paired t-test). rMSSD: root mean square of successive differences, HR: heart rate.
Furthermore, participants’ average HRs during the task were compared to their average HRs during the rest period to confirm that the relaxing effect of the Breathe app was sufficient. If the relaxation task was successful, then the average HR would be expected to decrease. However, no significant decrease in participants’ HRs was observed (HR: rest vs. operation, p = 0.0852) (Figure 3), which suggests that the relaxing effect of the Breathe app was insufficient.
2. Effectiveness of the Stress-Easing Task
1) Stress during speech delivery
To verify the stress-easing effect of the Breathe app on participants’ HR, LF/HF ratio, rMSSD, and STAI-S scores during speech delivery, results were compared using the unpaired t-test between the Breathe app and the non-Breathe app group. No significant differences were found (HR: non-Breathe app vs. Breathe app, p = 0.2790; LF/HF ratio: non-Breathe app vs. Breathe app, p = 0.1392; STAI-S: non-Breathe app vs. Breathe app, p = 0.9101; rMSSD: non-Breathe app vs. Breathe app, p = 0.7871), which suggests that the stress-easing effect of the Breathe app did not last into the speech delivery (Figure 4).
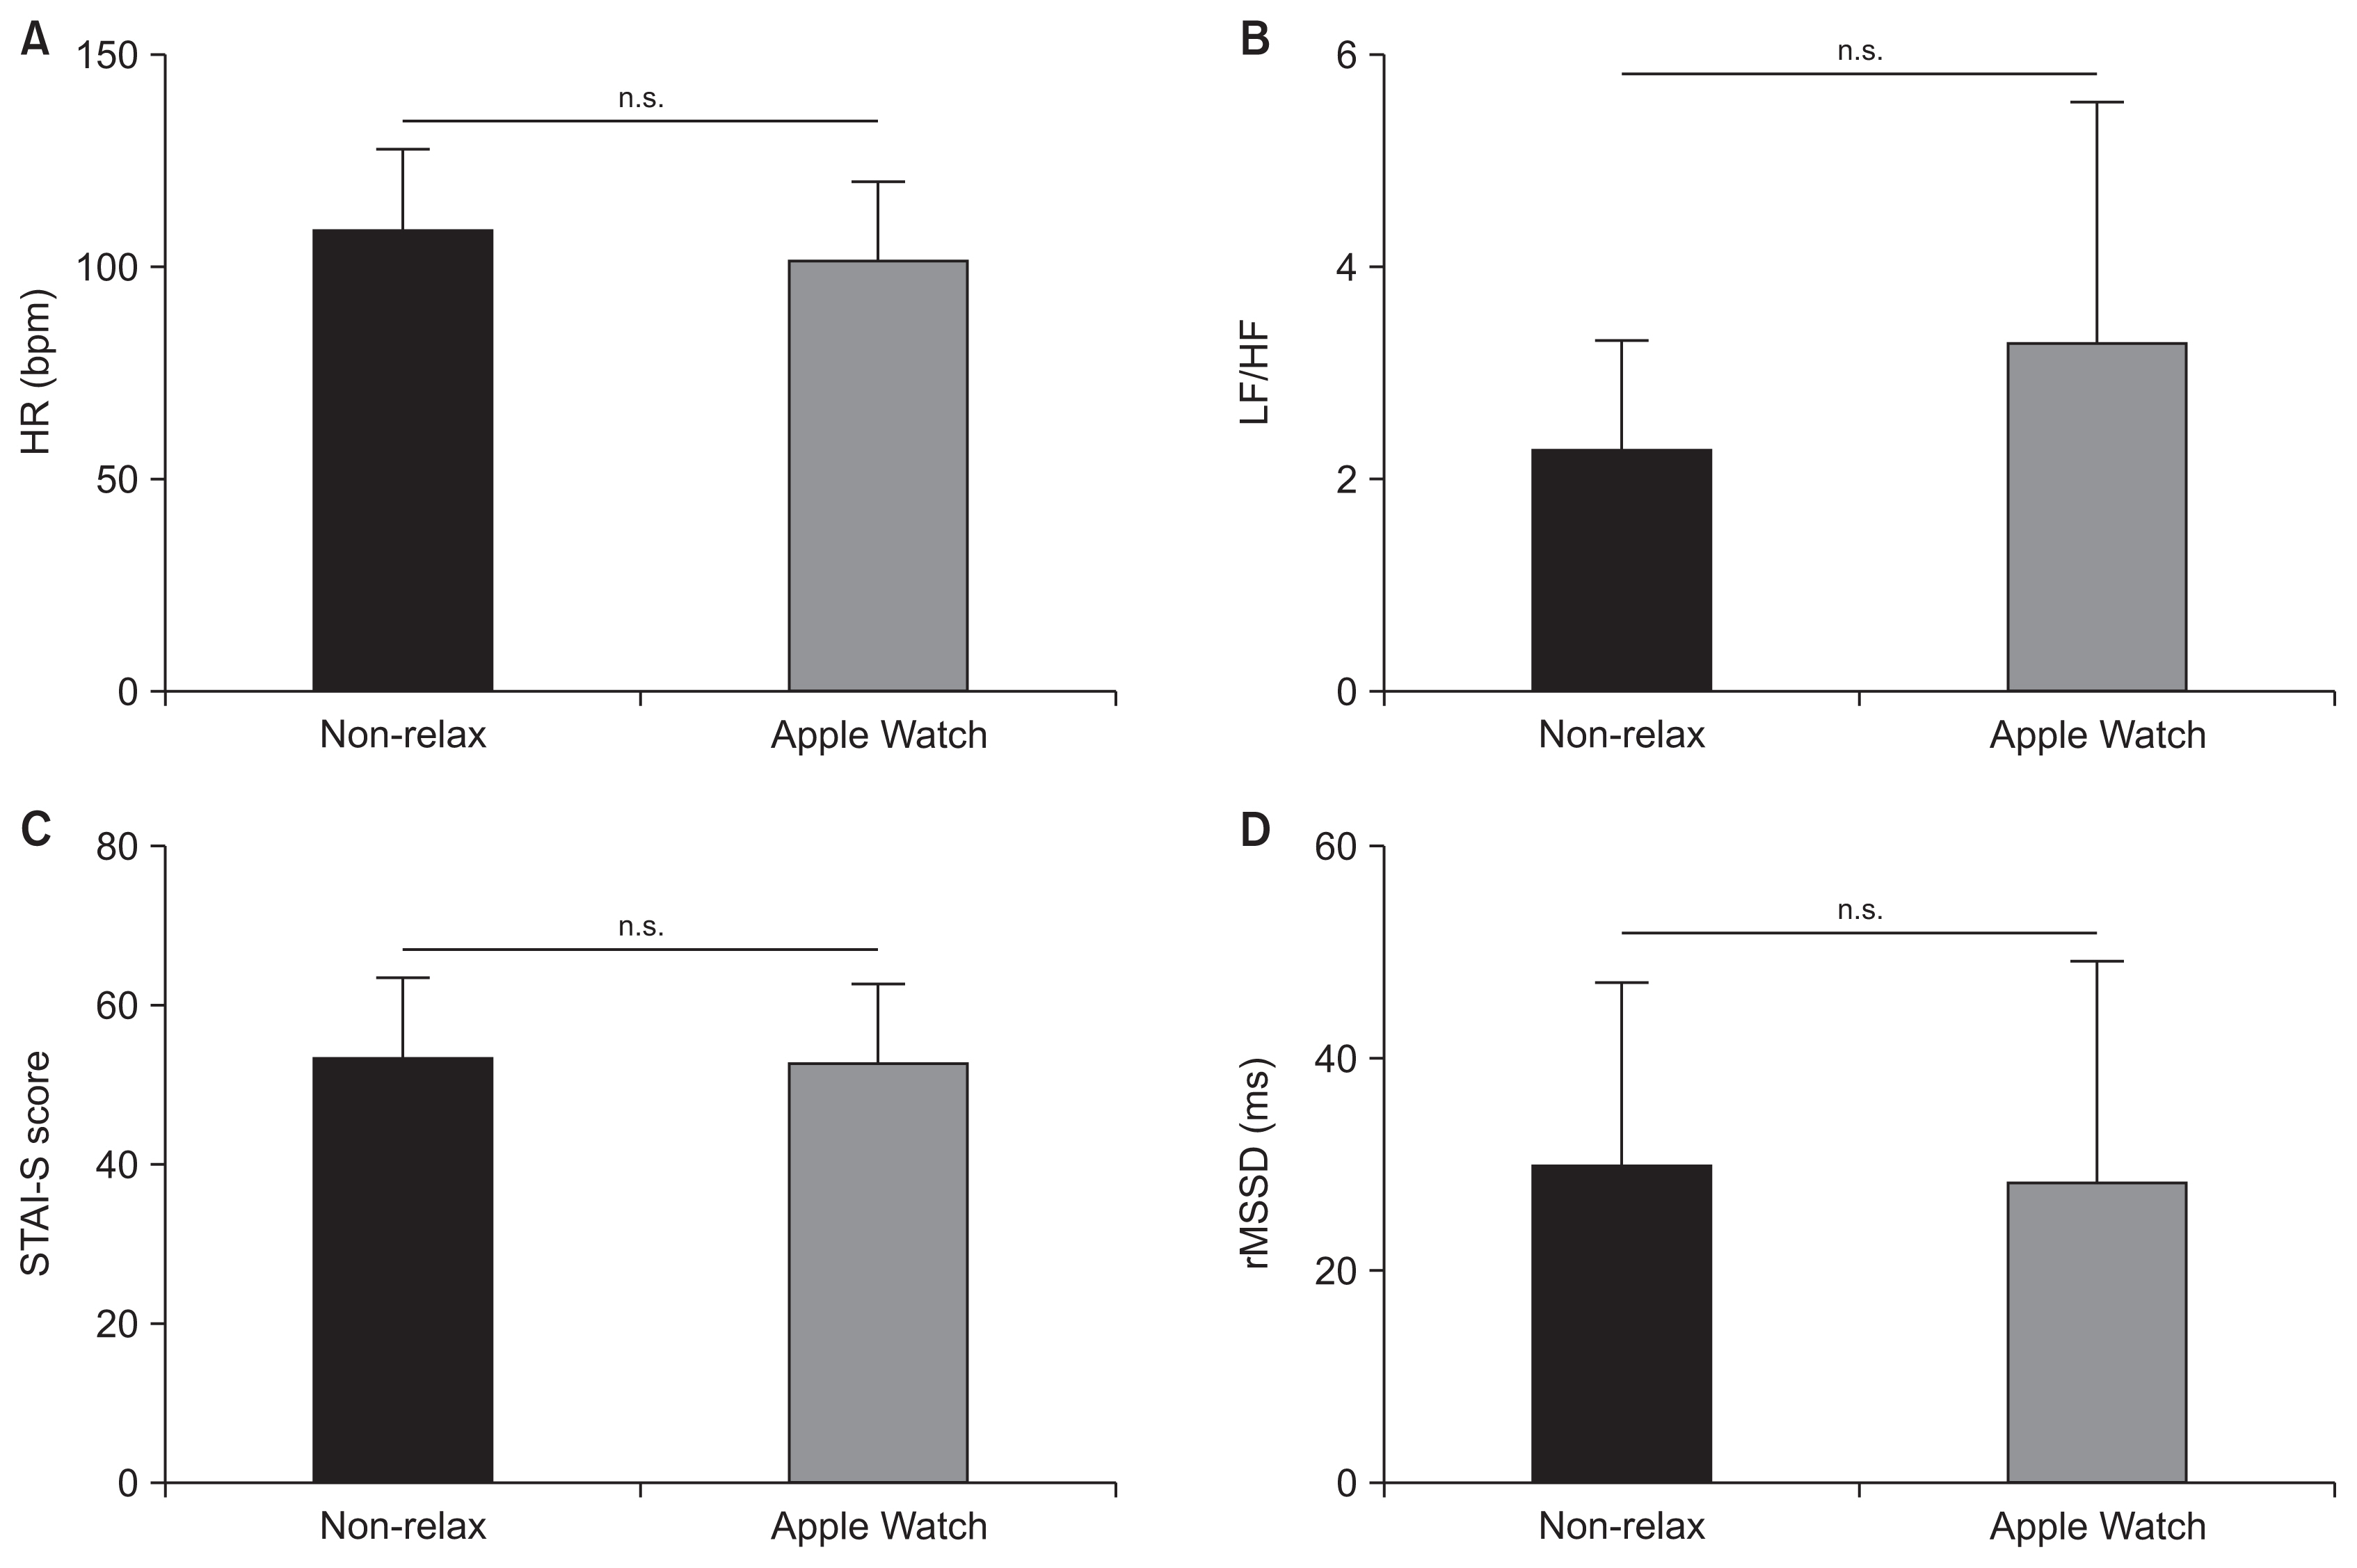
Differences in HRV and STAI-S scores during the speech delivery between the Breathe app group and the non-Breathe app group. The mean and standard deviation for HRV measurements and STAI-S scores are shown on the graphs. (A) Both groups showed similar levels for HR (unpaired t-test). (B) Both groups showed similar levels for the LF/HF ratio (unpaired t-test). (C) Both groups showed similar levels for STAI-S scores (unpaired t-test). (D) Both groups showed similar levels for rMSSD (unpaired t-test). STAI-S: State-Trait Anxiety Inventory (state anxiety), HRV: heart rate variability, HR: heart rate, HF: absolute power of high frequencies, LF: absolute power of low frequencies, rMSSD: root mean square of successive differences.
2) Stress during speech preparation
To verify how long the stress-easing effect of the Breathe app and HRV-BF continued, using the unpaired t-test, this study compared the HR, LF/HF, and rMSSD during speech preparation between the non-Breathe app and Apple Watch groups. A significant difference was found in terms of the HR (p = 0.0181) and LF/HF ratio (p = 0.0106). In fact, the HR and LF/HF ratio were lower in the Apple Watch group than in the non-Breathe app group (Figure 5). Regarding rMSSD, no significant difference was found (p = 0.2919). Based on the HR and LF/HF ratio, the participants in the Apple Watch group were able to relax more than those in the non-Breathe app group.
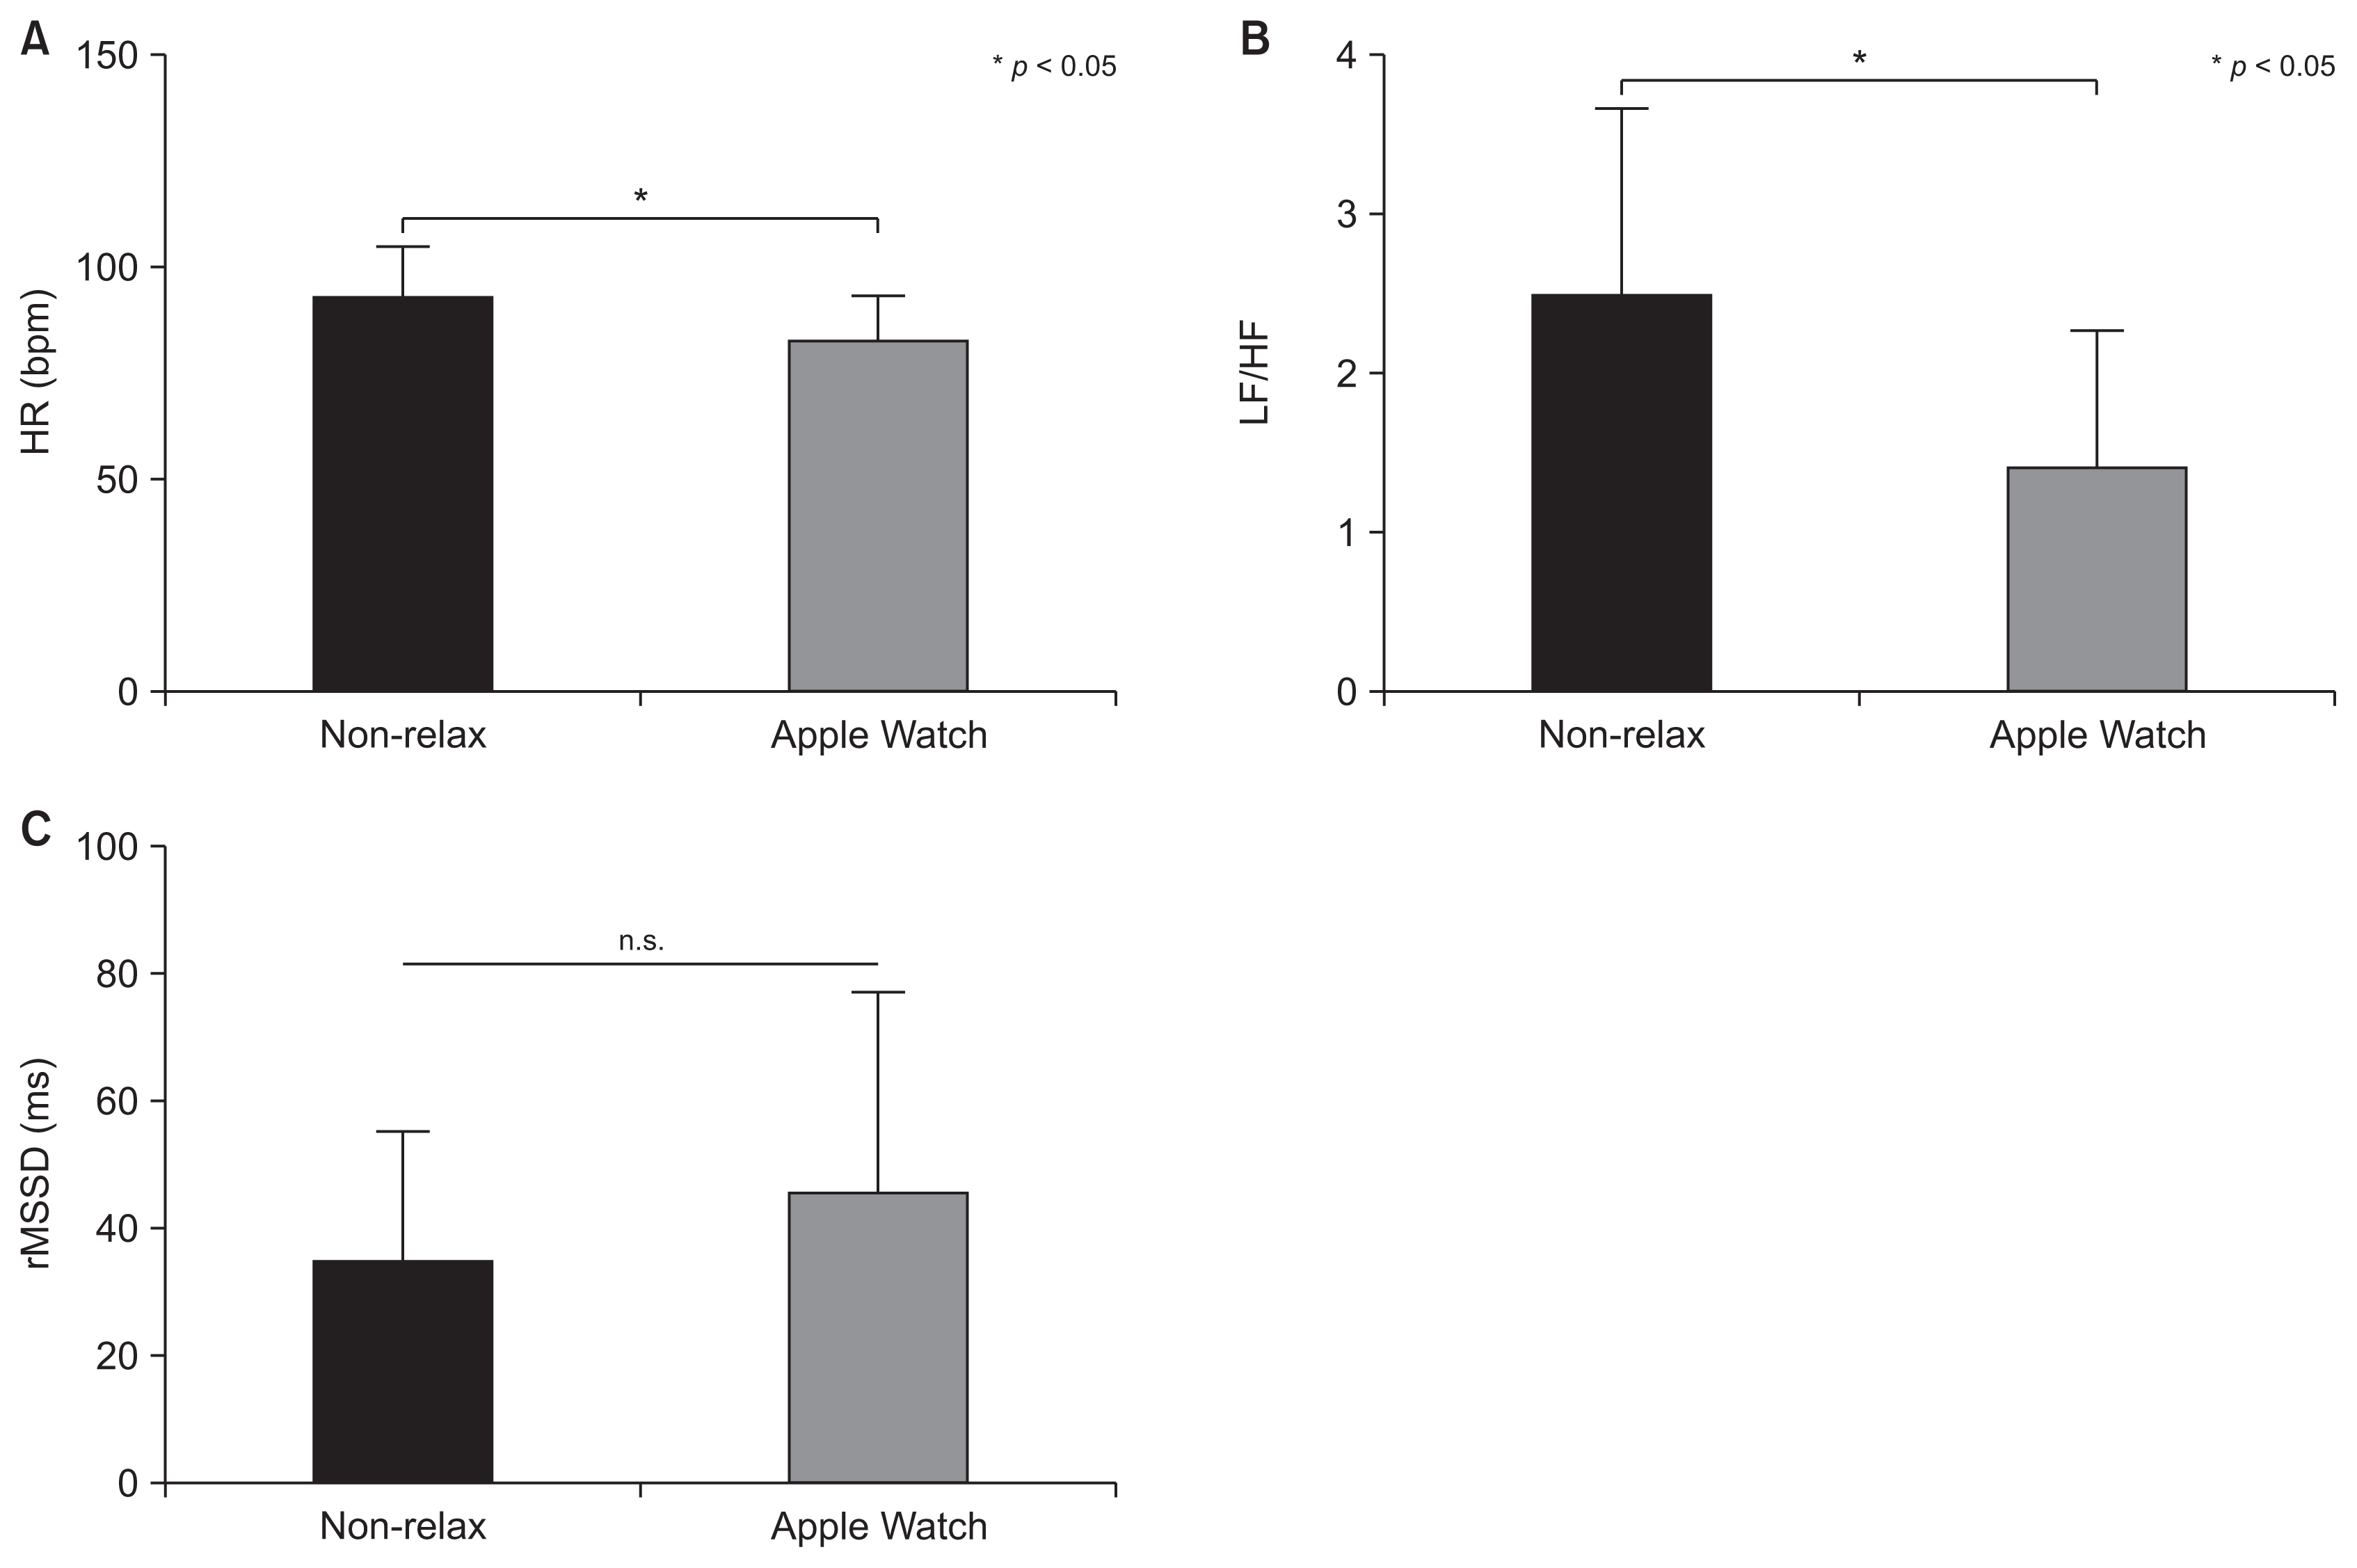
Differences in HRV and STAI-S scores during speech preparation between the Breathe app group and the non-Breathe app group. The mean and standard deviation for HRV measurements and STAI-S scores are shown on the graphs. (A) Participants from the non-Breathe app group had higher HRs than the Breathe app group (unpaired t-test, p < 0.05). (B) Participants from the non-Breathe app group had higher LF/HF ratios than the Breathe app group (unpaired t-test, p < 0.05). (C) Both groups had similar rMSSD levels (unpaired t-test). STAI-S: State-Trait Anxiety Inventory (state anxiety), HRV: heart rate variability, HF: absolute power of high frequencies, LF: absolute power of low frequencies, rMSSD: root mean square of successive differences.
IV. Discussion
1. Validity of the Tasks
The speech task induced stress. Significant differences in the average HR, LF/HF ratio, and STAI-S were found in the non-Breathe app group between their resting state and speech delivery, and between their resting state and speech preparation (Figure 2).
2. Reducing Stress with the Apple Watch
During speech preparation, the HR and LF/HF ratio of the Breathe app group were lower than those of the non-Breathe app group (Figure 5), which suggests that stress during this phase may have been eased by breathing exercises using the Apple Watch Breathe app. However, no significant differences based on physiological and subjective indicators were found between the groups during speech delivery (Figure 4). We propose the following three explanations for why stress was not alleviated during speech delivery: the stress of delivering a speech was too intense, the order of the tasks mitigated the Breathe app’s effectiveness, and the stress-easing task was insufficient.
3. Possibility for Improvement
The speech task might have induced more stress in participants than cognitive tasks examined in previous studies, such as mathematical tests and the Stroop task. According to a study that analyzed 208 articles related to acute stress, tasks in which participants do not have control over the setting and are evaluated socially tend to induce a high degree of stress [24]. Participants in the present study were informed that their speeches would be recorded and evaluated by other people. Thus, the speech task meets the condition of “being evaluated socially.” However, in earlier studies [15,25–27], participants only performed cognitive tasks and were not socially evaluated. Due to this difference in the experimental setting, the speech task in this study might have induced more stress than cognitive tasks. As such, the breathing regulation task in this study might have alleviated stress for longer if the speech task induced less intense stress.
In the present study, the following procedure was used: the stress-easing task was performed for 10 minutes, then speech preparation was undertaken for 10 minutes, and then the speech was delivered for 5 minutes (Figure 1). The stress-easing effect may not have lasted through the speech preparation step. In future experiments, the order of the procedure should be changed to improve the stress-easing effect. First, participants should prepare a speech for 10 minutes. Then, they should perform breathing regulation exercises for 10 minutes. Finally, they should deliver the speech. Conducting the steps in this order will allow participants to deliver their speeches before the stress-easing effect diminishes. Another solution could be to give participants a speech topic beforehand so they can devise the content of their speeches at home. Thus, they would not need to spend time preparing the speech and could deliver it directly following the stress-easing operation.
The Breathe app task using Apple Watches was conducted for only one session without pre-training. An earlier study found that breathing regulation using haptic interaction without pre-training increased participants’ HRV [27]. However, the stress-easing tasked used in this study might not have been sufficient. Although a significant difference was observed in rMSSD in between the non-Breathe app and Breathe app groups, no significant differences in HR were found between when the Breathe app group performed the breath-regulating task and when they rested (Figure 3), which is contrary to a previous study that found that HR decreased after an HR control session [28]. In other words, stress decreased during the speech task in terms of rMSSD, but no difference was observed in terms of HR. Therefore, although it complicates the procedure, conducting a pre-training session or increasing the number of stress-easing sessions is expected to be effective at reducing stress.
Adding a new group based on earlier studies can also be considered when conducting future research. For example, one study found that playing music to drivers relaxed them [29]. It is possible that having participants listen to music during the breathing task with the Apple Watch, speech preparation, and speech delivery could reduce stress more. However, it might be difficult to play music that speakers respond positively to during speech delivery. Thus, it would be best to use a method for easing stress that only the speaker can perceive, such as breathing regulation through haptic interaction [27].
Making wearable devices worn by participants vibrate lightly before and/or during stress-inducing activities can also be expected to be effective at reducing stress. Earlier studies succeeded in alleviating subjective anxiety during speech preparation and speech delivery using false heartbeat-like vibrations through a wearable device, doppel, or EmotionCheck that were slower than participants’ actual HRs [16,17]. Another study relaxed participants physiologically by sending haptic feedback from their heartbeat [30]. Furthermore, the BoostMeUp app for Apple Watches enabled participants in one study to perform better on mathematical tests by using vibrations that were slower than their actual HRs [15]. These studies indicate that using another wearable device or other applications installed on Apple Watches to send participants vibrations that are slower than their HRs can ease stress.
In conclusion, we propose five solutions. First, since the speech task might have been too stressful for participants, another less stressful task would enable more effective stress reduction for the purposes of the experiment. Second, changing the order of the procedure would also lead to a difference in stress levels. Since the stress-easing effect might have been lost during the speech preparation step, we suggest making speech preparation the first step and then conducting the breath regulation task immediately before speech delivery. Third, conducting a pre-training session or increasing the number of sessions would reduce stress more effectively, as our results imply that the stress-easing procedure was insufficient to reduce stress meaningfully. Fourth, based on previous studies, we suggest playing music or incorporating haptic interaction so that participants can better regulate their breathing. Lastly, we propose sending vibrations to participants’ wearable devices that are slower than their actual HRs based on the findings of multiple previous studies that demonstrated the effectiveness of vibrations.
4. Limitations
There are some limitations to this study. First, the number of participants was low and might not have been high enough for an effective analysis. We recruited the maximum number of participants possible during a certain period. Second, some participants might have been accustomed to using an Apple Watch or might have already been comfortable making speeches in public, which we did not consider when recruiting participants. Thus, the results are potentially biased. Third, the experimental setting was different from the setting of actual speeches. In this experiment, subjects made a speech in front of a researcher. However, in an actual speech, the speaker delivers his or her speech before an audience, which consists of many people. Therefore, our results might not be directly applicable to real-life situations. Fourth, all participants recruited for this experiment were young, and the results might not be generalizable to other generations. Finally, the sampling rate of the device used in this study (160 Hz) was lower than the sampling rate recommended in international guidelines for measuring HRV, which may have led to inaccuracies in the HRV analysis.
Acknowledgments
We thank all participants for participating in experiments. This research did not receive any specific grant from funding agencies in the public, commercial, or not-for-profit sectors. This paper is based on the second author’s (Yuma Nakadoi) Bachelor of Science (B.S.) thesis at Okayama University.
Notes
Conflict of interest
No potential conflict of interest relevant to this article was reported.