Quantification of Efflorescences in Pustular Psoriasis Using Deep Learning
Article information

Abstract
Objectives
Pustular psoriasis (PP) is one of the most severe and chronic skin conditions. Its treatment is difficult, and measurements of its severity are highly dependent on clinicians’ experience. Pustules and brown spots are the main efflorescences of the disease and directly correlate with its activity. We propose an automated deep learning model (DLM) to quantify lesions in terms of count and surface percentage from patient photographs.
Methods
In this retrospective study, two dermatologists and a student labeled 151 photographs of PP patients for pustules and brown spots. The DLM was trained and validated with 121 photographs, keeping 30 photographs as a test set to assess the DLM performance on unseen data. We also evaluated our DLM on 213 unstandardized, out-of-distribution photographs of various pustular disorders (referred to as the pustular set), which were ranked from 0 (no disease) to 4 (very severe) by one dermatologist for disease severity. The agreement between the DLM predictions and experts’ labels was evaluated with the intraclass correlation coefficient (ICC) for the test set and Spearman correlation (SC) coefficient for the pustular set.
Results
On the test set, the DLM achieved an ICC of 0.97 (95% confidence interval [CI], 0.97–0.98) for count and 0.93 (95% CI, 0.92–0.94) for surface percentage. On the pustular set, the DLM reached a SC coefficient of 0.66 (95% CI, 0.60–0.74) for count and 0.80 (95% CI, 0.75–0.83) for surface percentage.
Conclusions
The proposed method quantifies efflorescences from PP photographs reliably and automatically, enabling a precise and objective evaluation of disease activity.
I. Introduction
Pustular psoriasis (PP) can impair the quality of life by producing innumerable painful pustules (white or yellow vesicles) on weight-bearing areas, or lead to uncontrollable systemic inflammation and malaise. Both localized and generalized forms exist. Palmoplantar PP (PPP) is the most frequent form and produces numerous pustules on an erythematous base in the palmoplantar region. With time, these pustules dry, and their subsequent secondary efflorescences are termed brown spots. Generalized PP affects the whole body; it is rarer than localized forms and more dangerous in cases with systemic complications. There is no established standard treatment, and the available options are still limited [1].
The severity of a skin disease is traditionally evaluated based on its physical impact on patients’ health. Several different metrics exist for psoriasis, of which the Psoriasis Area and Severity Index (PASI) is considered the most established [2]. For PP, there is no universally used grading system. Objective grading systems such as the PPPASI [3] are based on the quantity and intensity of important disease features, most prominently the pustules. As these scoring systems were designed for manual assessment, they use an imprecise grading system from “no disease” (0) to “very severe” (4), integrating pustules, erythema, and scaling. Similarly, the area covered by efflorescences is also graded using discrete categories. Even though such scales are clinically useful and efficient in practice, they clearly constrain precision for severity grading and disease monitoring. As shown by the PrecisePASI for plaque-type psoriasis [4], this limitation can be overcome by developing tools for fine-grained assessments. These precise grading systems are especially important for monitoring patients’ conditions and determining the required treatments, as PP is a relapsing disease with varying degrees of severity across flare episodes. Dermatologists usually evaluate PP activity by coarse estimations, which have inevitable disadvantages such as inter-individual variation among raters [5]. Hence, an automated and reliable alternative would benefit clinical practitioners, facilitate medical studies, and could be smoothly integrated into tele-dermatology applications.
In comparison to other inflammatory skin diseases, PP presents distinct and easily identifiable skin lesions: pustules and brown spots. This special characteristic could enable machine learning (ML) algorithms to automatically perform counting and surface estimation, a very daunting task in manual settings. For example, the reader may visually assess the quantity of lesions in the patient’s hand shown in Figure 1, which tallies 118 pustules and 272 brown spots and surface percentages 2.11% and 3.14%, respectively. Clearly, such fine-grained assessments can only be achieved through automation.

Sample image (A) with expert labels (B) and the DLM prediction (C). This picture came from the test set used to evaluate the DLM and was not used in the training process. The original image is shown in (A), while (B) shows the image overlaid with expert labels and (C) the image overlaid with the DLM predictions. The pustules are colored in yellow, the brown spots in red, the patient’s skin in blue, and the background in violet. DLM: deep learning model.
Current state-of-the-art image recognition models are based on deep learning (DL) architectures. DL is a branch of ML aiming to develop models that autonomously learn relevant discriminating features from data sources to infer predictions on new unseen data samples. These deep learning models (DLMs) can be used in automated pipelines and have the advantage of producing deterministic and therefore reproducible results. They have repeatedly achieved superhuman performance in image recognition tasks, progressing to general images today. Successful applications to medical image analysis include skin cancer classification [6], psoriasis or brain tumor segmentation [7,8] and even synthetic medical data generation [9].
In this study, we propose a DLM to automatically quantify PP efflorescences (lesion count and surface percentage) and evaluate its predictions against experts’ labels.
II. Methods
1. PPP Dataset
The dataset consisted of 151 anonymized high-resolution photographs obtained at the University Hospital Zurich from PPP patients with active lesions. Two board-certified dermatologists and a student independently labeled the images for pustules and brown spots. Figure 1 shows an example of a PPP image from our dataset along with its expert labels.
We randomly divided the dataset into 121 photographs to train the DLM and 30 photographs to test its performance, ensuring that the training and test set did not contain any data from the same patient. The training set was further divided into five folds for cross-validation to determine the optimal DLM (hyper-)parameters and to evaluate the variability of the DLM performance across the different training splits.
To leverage the full resolution of the photographs, we tiled the images in square patches with a fixed side length of 512 pixels (approximately 3 cm × 3 cm). This pre-processing step resulted in 6,799 patches for the training set and 819 for the test set. Finally, only the training set was further augmented to improve DLM generalization using random transformations such as flips, rotations, zoom, and contrast and brightness changes. The full test set lesion distribution is displayed in the supplementary materials.
2. DLM Training
The suggested DLM is composed of two subunits, both based on the U-Net [10] architecture with a ResNet [11] backbone to extract image features. The workflow is as follows: first, the M1 subunit separates the skin and background from the full picture, while the M2 subunit splits the picture into patches and segments pustules and brown spots. The M1 predictions take priority over M2 predictions in the sense that we consider M2-predicted pustules and spots only when they overlap with M1-predicted skin. The lesions are counted and the surface percentage (the total lesions’ pixel size multiplied by 100, then divided by the total skin’s pixel size) is calculated.
Due to the relatively small size of our dataset, the training process was preceded by two pretraining steps. First, we applied transfer learning on both subunits’ backbones using the pretrained weights from the ImageNet dataset [12]. Next, we pretrained the M2 subunit’s backbone on a simpler classification task: separating patches containing lesions from patches with only background or healthy skin.
Finally the training of the DLM was performed for each subunit independently on the same training set using a learning rate scheduler with a one-cycle policy [13].
As the lesions are very small, there is a large imbalance between lesion pixels and irrelevant pixels from the skin or background. To ensure that the DLM properly learns to recognize very small lesions, we used the mixed focal loss function [14], combining the focal loss [15] and the dice focal loss [16], both of which are known to mitigate semantic class imbalance and are popular in medical image segmentation [17]. The implementation was done with PyTorch [18] and the fastai library [19].
3. Pustular Diseases Dataset (PDD)
This dataset used for out-of-distribution testing consisted of 213 unstandardized pictures from four pustular diseases (Table 1) with at least 15 images per diagnosis (Supplementary Tables S1–S3). The diseases were selected because they also produce pustules and brown spots. One of the four diseases was again PPP, but the pictures were derived from a distinct patient population and were less standardized. In comparison to the training dataset, the PDD pictures varied greatly in terms of resolution, zoom level, focus, brightness level, patient posture, and so on. One dermatologist assessed the images for actual disease severity using a physician’s global assessment ranking from 0 (no disease) to 4 (very severe). In contrast, one student graded the images for lesion count only, with results ranging from 0 (no lesions) to 4 (very large count) for the estimated lesion count. Consistent estimation of the lesion surface percentage by human raters was tried, but proved to be too difficult and was therefore abandoned.

Correlation coefficients of DLM predictions
4. Analysis
To evaluate the agreement between the experts’ labels and the DLM predictions, intraclass correlation coefficients (ICCs) with 95% confidence intervals (CIs) were measured. For the PDD experiment, we computed Spearman correlation (SC) coefficients with a 95% CI instead, since ranking labels are ordinal variables. The computed correlation coefficients reflect how well the DLM predictions relate to the experts’ labels: <0.4 for weak agreement, 0.4–0.6 for moderate, 0.61–0.8 for strong, and >0.8 for very strong agreement.
Following the recommendations by van Stralen [20] we created Bland-Altman (BA) plots to analyze the agreement. As the data were not normally distributed, the BA limits of agreements were computed with the 2.5th and 97.5th percentiles (to cover 95% of the data samples). We also created a Q3P plot to show the third quartile of (absolute and relative) differences between experts’ labels and DLM predictions. Thus, for both the BA and Q3P plots, a positive difference means that the DLM underestimates the efflorescence quantity while a negative difference implies the opposite.
Finally, in order to better understand the DLM’s divergence from the experts’ labels, we randomly selected 100 patches from the PPP test set and manually analyzed the lesions missed by the DLM and the lesions that it detected but were missed by the experts. A student then analyzed each case individually and determined if the discrepancy reflected a mistake by the DLM or the experts.
III. Results
The results presented in this section were obtained from the PPP test set patches (Supplementary Figures S1–S3).
1. PPP Test Set: Prediction of Pustule and Brown Spot Counts
As shown in Figure 2F, the DLM predictions differed by at most 1 pustule or brown spot in 75% of the patches with up to 6 lesions (corresponding to the third quartile [Q3] of the test set for lesion count). For the remaining patches (i.e., in 18.8% of all cases), the difference increased to 2 lesions. The DLM’s bias (full line in BA plots) was 0.24 lesions (Figure 2E), indicating that the DLM tended to detect fewer lesions than the experts did. The BA plots did not reveal a systematic bias in the DLM predictions; the patches were concentrated on the left of the x-axis because most of them contained only a few lesions. The mean absolute difference (MAD) was 1.68 lesions, and although we observed several outliers, the ICC was 0.97 with (95% CI, 0.97–0.98) (Table 2), implying very strong agreement with the experts’ labels.
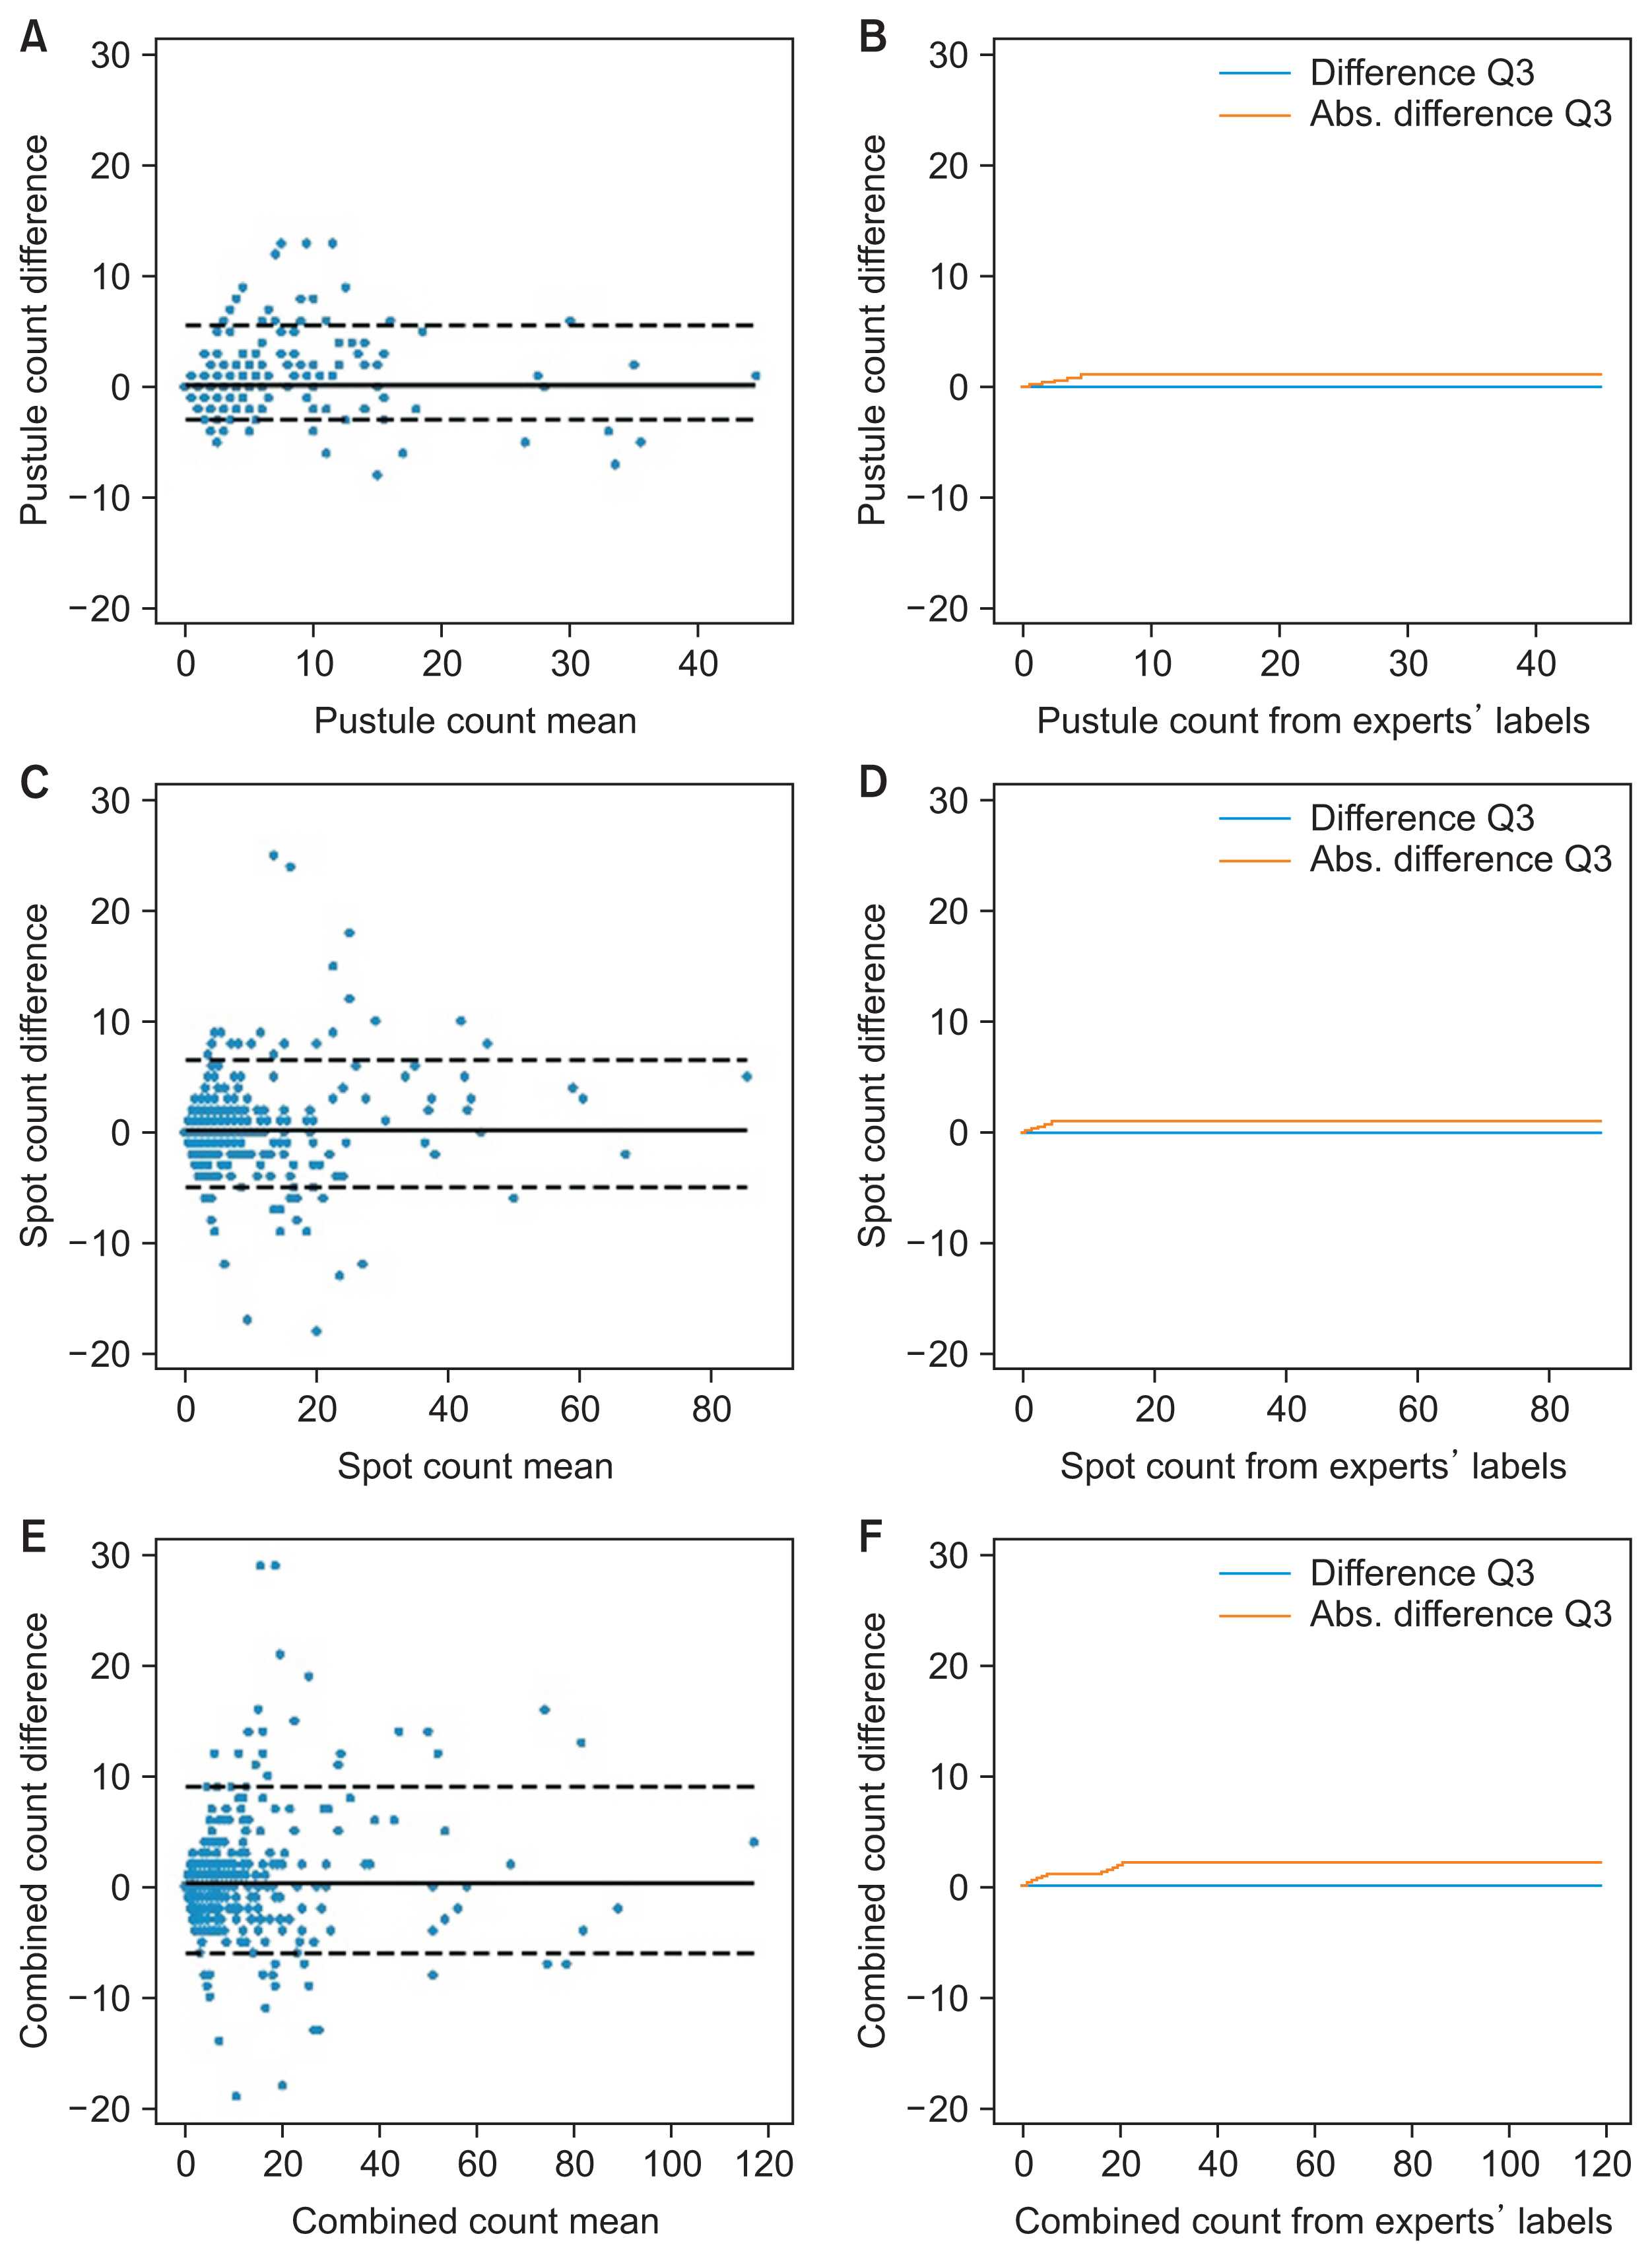
Agreement of DLM lesion count predictions with expert labels. The figure shows the Bland-Altman plots of the predicted count for pustules (A), spots (C), and combined lesions (E). The plots for pustules (B), spots (D), and both lesions (F) show the third quartile of the mean difference and the mean absolute difference of the predicted count for patches with up to the number of lesions specified on the horizontal axis value. DLM: deep learning model.

Pustular diseases dataset
2. PPP Test Set: Prediction of Pustule and Brown Spot Surface Percentage
Considering the test image patches with lesion surface percentages up to 1.31% (PPP test set’s surface Q3), the DLM surface predictions differed by less than 0.15% in 75% of the cases (Figure 3F). This difference plateaued at 0.42% for 75% of the patches with higher surface percentages. The predicted surface ICC was 0.93 with (95% CI, 0.92–0.94) (Table 2). The DLM bias was 0.27% and the MAD was 0.47%, implying that the DLM tended to underestimate the surface of lesions. Again, the BA plots did not reveal any systematic bias in the DLM predictions.
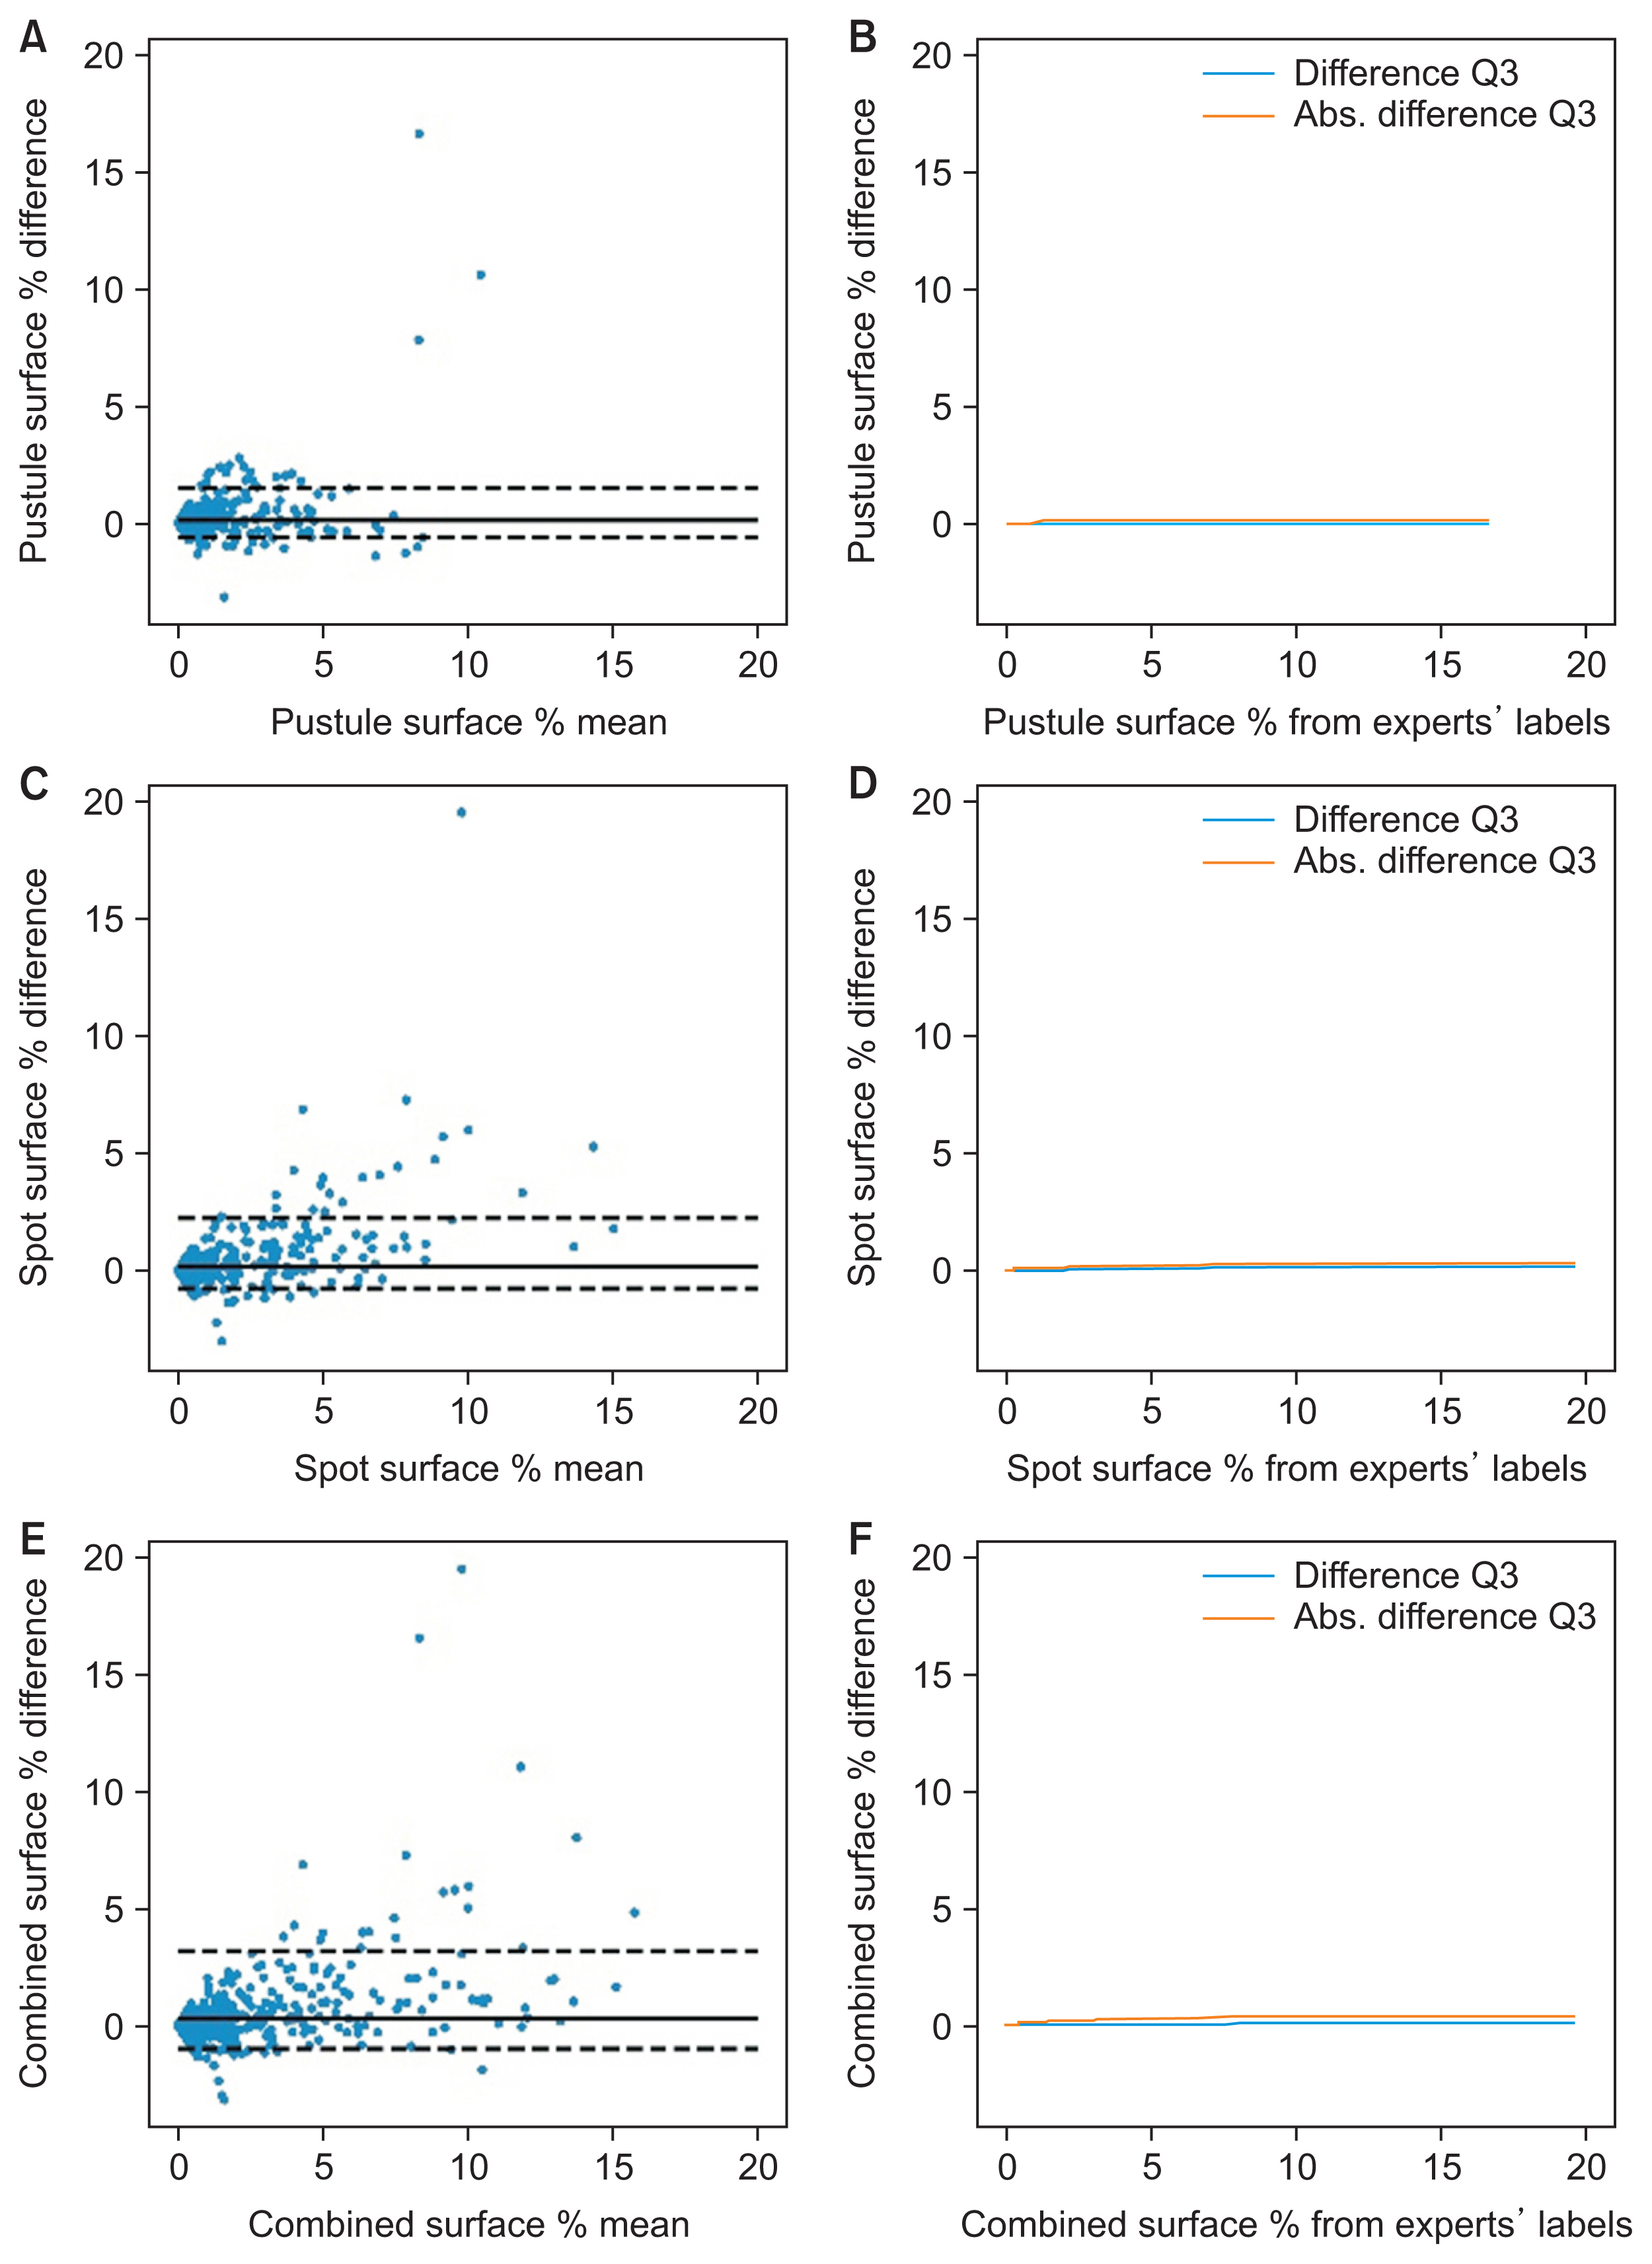
Agreement of DLM lesion surface predictions with expert labels. The figure shows the Bland-Altman plots of the predicted surface percentage for pustules (A), spots (C) and combined lesions (E). The plots for pustules (B), spots (D), and both lesions (F) show the third quartile of the mean difference and the mean absolute difference of the predicted surface percentage for patches with up to the lesion surface specified on the horizontal axis value. DLM: deep learning model.
3. PPP Test Set: Review of DLM Divergence
The DLM predictions for all 100 patches yielded 486 lesions, of which 76.6% matched the experts’ labels. However, 23.4% were absent from the experts’ labels. Manual verification determined that 88.5% were indeed real pustules or brown spots missed by the experts, and only 11.5% were structures mistakenly identified by the DLM.
The experts labeled a total of 579 lesions, of which 63.6% were identified by the DLM, 30.6% were missed, and the remaining 5.8% were upon manual verification identified to be expert label errors; thus, they were correctly classified to be healthy skin by the DLM.
We infer from these observations that from these 100 patches, the correct lesion count should have been 645, implying a combined sensitivity for experts of 84.4% with a labeling error rate of 5.8%, and for the DLM a sensitivity of 73.3% with a detection error rate of 2.6%.
The usual mistakes both for the experts and DLM were caused by lesion-mimicking structures, such as small lentigines or dirt for brown spots and scales for pustules. Concerning the missing lesions from the experts’ labels, these were mainly small pustules or brown spots that a human could barely see without sufficient zooming in.
4. PDD Set: DLM Evaluation for Pustular Diseases
We applied the DLM to 213 unstandardized pictures from four different pustular diseases to predict the lesion count and surface. Table 2 shows the corresponding SC coefficients with the experts’ grading. With respect to the dermatologist’s severity grading, the overall SC coefficient for all diagnoses was 0.66 (95% CI, 0.60–0.74) for lesion count and 0.80 (95% CI, 0.75–0.83) for lesion surface, indicating strong agreement. Regarding the medical student’s estimated lesion count, the observed agreement was strong (SC coefficient = 0.77; 95% CI, 0.72–0.81).
IV. Discussion
This work addressed the task of automatically measuring disease intensity in PPP patient photographs. The presented DLM was able to quantify both pustules and brown spots in patient images, reaching very strong agreement with experts’ labels, as shown by an ICC range of 0.97–0.98 for lesion count and an ICC range of 0.92–0.94 for lesion surface percentage. An analysis of a randomly selected subsample of the test set revealed a combined expert sensitivity of 84.4% with an error rate of 5.8%, while the DLM showed a sensitivity of 73.3% with an error rate of 2.6%.
The DLM was further evaluated on photographs taken from patients with four pustular diseases. It showed strong agreement with the dermatologist’s severity evaluation (on a range from 0 to 4) and the student’s lesion count (likewise on a scale from 0 to 4). To the best of our knowledge, this is the first attempt to automatically quantify efflorescences from pustular psoriasis; as such, this is the first step toward a precise, reproducible, and objective evaluation of this disease activity.
Related to the task of automating existing disease scoring systems, most of the literature has focused on the automation of the PASI index. Some studies [21–23] chose to rely on classification DLMs, thus capping the achievable precision to discrete scores in contrast to our DLM, which predicts continuous metrics. Various segmentation approaches have also been applied to ulcers [24], skin cancer [25,26], eczema [27], and psoriasis [7,28], and therefore could also be used to produce metrics similar to our study. However, they all targeted diseases with plaques, single lesions, or lesions larger than PP efflorescences. The segmentation of small objects in imbalanced settings is a well-known technical challenge [29], which we successfully addressed here in the context of PP with our patch-based approach and an additional pretraining task. This patch-based approach was the main motivation behind our design choice to segment skin separately from lesions, since the first task is performed better when the full image context is available. Another PP-specific difficulty was caused by the inevitably limited sensitivity of experts in cases with a large number of lesions and the tedious nature of the labeling task. To illustrate the impact on the clinical workload, the image shown in Figure 1 required 30 minutes for the human expert to fully label, whilst the same took less than 15 seconds for the DLM. The produced labels were bound to miss some lesions, penalizing the DLM training and evaluation process. Indeed when analyzing the quantitative DLM segmentation performance (see Supplementary Figures S4 and S5), around 40% of lesion pixels were mistaken for healthy skin, matching the observed positive bias in the counts and surface Bland-Altman plots. However, the high intra-class correlation with experts’ labels implies that the disease lesions were quantified according to the experts’ annotations, aligning with the study’s main objective.
Due to its algorithmic nature, the error rate of the DLM should remain constant in time across different patient cases. We expect the DLM’s performance to be at least as stable as human evaluation over the course of various follow-up visits. Both hypotheses should be validated in future studies.
While our DLM was trained exclusively on PPP patients’ pictures, we demonstrated that our approach of counting lesions and measuring their surface to evaluate the disease severity is also applicable to relatively unstandardized, out-of-distribution (coming from a different source with different capturing conditions) photographs of patients with other pustular disorders.
This remarkable generalization is possible without retraining the DLM as long as the different diseases’ lesions have a similar appearance. Whilst the pictures showed very different patient postures and body regions, the DLM’s performance remained robust, presumably due to its training on small image patches instead of full images.
Dermatologists’ workflow currently consists of either an informal subjective global assessment or manually grading disease activity with an objective score such as the PPPASI. The latter, however, requires time and expertise to perform in a reproducible manner. Improving on this situation, our approach for PP grading does not have such constraints. The DLM could be integrated into a smartphone app enabling physician extenders to photograph and quantify lesions before patients consult with dermatologists. To allow a systematic comparison of the DLM predictions, it is important to standardize the conditions under which pictures are taken, such as a patient’s posture, zoom level, and so forth. This could be achieved via a guided picture-taking process in the smartphone app and proper training of medical personnel.
Image standardization is a common pitfall for DLMs. When photographs are taken with very different settings (lighting, posture, or zoom level), the quality of DLM predictions can degrade despite training with extensive data augmentation. Such variations can be reduced by following photograph collection procedures such as the guidelines proposed by Finnane et al. [30] for dermatology. Although our DLM showed robust performance on unstandardized pictures, they were taken by photographers and medical personnel in relatively controlled conditions (hospitals and studies). For extreme cases such as tele-dermatology (where untrained people take images with different devices, resolution, zoom, exposure to sunlight, and so forth) the DLM should be retrained using transfer learning on a subset of the new data source. Another limitation to consider is that the DLM was trained in this study mainly with Caucasian patient pictures and must therefore be retrained before it is applied to patients with different skin pigmentation. Once a new dataset has been collected, DLM retraining is usually not a challenging task since it is possible to leverage the already learned knowledge with transfer learning.
Another common criticism of DL applications in medicine is the difficulty of explaining the rationale behind model predictions, which makes them unsafe for use in tasks such as differential diagnosis. Here, this issue is not critical since the presented approach can be validated with little effort and training by visualizing the predicted lesions (a single glance would be sufficient).
Our DLM enables new, previously impractical analyses, including systematic studies of pustules’ growth, shapes, evolution, and treatment response. In practice, our approach is particularly suited for automatically generating patient reports, disease monitoring, and analyzing treatment efficacy. It synergizes well with standardized full-body photography solutions and their respective image analysis pipelines. In the future, our method could be utilized to develop tools that would help dermatologists better monitor patients afflicted with any type of pustulosis or disseminated monomorphic rashes and therefore improve the quality of followup consultations. The DLM is well-suited for integration into tele-dermatology applications, provided it is retrained to match the expected types of inputs and complemented with systems to ensure picture quality and verify the output. This could reduce hospital loads and be deployed in geographical regions where physical access to dermatologists is difficult or even impossible.
Acknowledgments
We thank the members of the labelling consortium: Dr. Komal Agarwal, Dr. Joanna Goldberg, Dr. Swathi Shivakumar, Nicholas Khoury, Anke Naedele. This work was supported by the Helmut-Fischer Foundation, the Botnar Foundation and the University of Basel.
Notes
Conflict of Interest
Alexander A. Navarini declares being a consultant and advisor and/or receiving speaking fees and/or grants and/or served as an investigator in clinical trials for AbbVie, Almirall, Amgen, Biomed, Bristol Myers Squibb, Boehringer Ingelheim, Celgene, Eli Lilly, Galderma, GlaxoSmithKline, LEO Pharma, Janssen-Cilag, MSD, Novartis, Pfizer, Pierre Fabre Pharma, Regeneron, Sandoz, Sanofi, and UCB. None of the activities listed above had an impact on this work. All other authors declare no potential conflicts of interest.
Supplementary Materials
Supplementary materials can be found via https://doi.org/10.4258/hir.2022.28.3.222.