Diffusion of Electronic Medical Record Based Public Hospital Information Systems
Article information
Abstract
Objectives
This study was conducted to evaluate the adoption behavior of a newly developed Electronic Medical Record (EMR)-based information system (IS) at three public hospitals in Korea with a focus on doctors and nurses.
Methods
User satisfaction scores from four performance layers were analyzed before and two times after the newly develop system was introduced to evaluate the adoption process of the IS with Rogers' diffusion theory.
Results
The 'intention to use' scores, the most important indicator for determining whether or not to adopt the IS in Rogers' confirmation stage for doctors, were very high in the third survey (4.21). In addition, the scores for 'reduced medication errors', which is the key indicator for evaluating the success of the IS, increased in the third survey for both doctors and nurses. The factors influencing 'intention to use' with a high odds ratio (>1.5) were the 'frequency of attendance of user training sessions', 'mandatory use of system', 'reduced medication errors', and 'reduced medical record documentation time' for both doctors and nurses.
Conclusions
These findings show that the new EMR-based IS was well accepted by doctors. Both doctors and nurses also positively considered the effects of the new IS on their clinical environments.
I. Introduction
Korean health delivery system is heavily dominated by the private sector. Over 90% of hospitals are private. Moreover, the facilities and manpower of most public hospitals are less competitive than those of private hospitals. The adoption rates of Electronic Medical Records (EMR) for public hospitals were much lower than those of private hospitals. As public hospitals play important roles in providing medical and preventive services to low-income patients, the Korean government began to disseminate a newly developed EMR-based information system to public hospitals in 2012 in an effort to strengthen their service capacity [1]. The government has taken a cautious approach to disseminating the new IS by evaluating its performance in achieving the mission of public hospitals and the adoption of EMR over time within public hospitals with focus on adoption by key users (doctors and nurses).
This study is part of a follow-up study to evaluate the performance of the new IS in public hospitals that have implemented the system based on the performance reference model (PRM). Cho et al. [1] evaluated the performance of the system before and after it was introduced by using DeLone and McLean's information system (IS) success model [2]. However, the second survey was conducted only one month after the system had been introduced in three hospitals; therefore, users did not have enough time to experience the system. For the results to be more applicable, the performance of the system should have been evaluated again, at least six months after its implementation, by using the above results as baseline data.
The PRM is a standardized framework which is used to measure the performance of major IT initiatives and their contribution to program performance. The PRM was developed by the Office for Management of Budget in the United States, and has been widely used to evaluate IS performance levels for government projects in the United States [3]. Chung et al. [4] modified the PRM to evaluate government IT projects in Korea by classifying the performance of an IS into what are known as the input, process, business, and performance layers. For each layer, a set of key performance indicators (KPI) was also developed to measure the performance of a specific IS. They developed PRM ver. 2.0 as a standard performance evaluation tool and developed 138 KPIs for evaluating the performance of government IS projects. However, many of these KPIs were not applicable to the public hospital setting because they were primarily developed for ISs for government projects unrelated to healthcare. Therefore, a need has arisen to identify KPIs for evaluating the performance of IS projects in a public hospital setting based on the PRM framework.
Rogers' diffusion of innovation theory is one of the most popular theories for studying the adoption of information technologies (IT) and understanding how IT innovations spread within and between organizations [5]. EMR can be viewed as an innovation at public hospitals because it is a type of IT that is perceived as new and unfamiliar to doctors and nurses at hospitals. Because EMR changes the entire process within a hospital, most hospitals have encountered strong resistance from doctors, who are the key users. Therefore, it is important to assess how EMR is accepted by doctors and how it diffuses over time within a hospital. Many studies have applied Rogers' diffusion of innovation theory to investigate the adoption of IT in healthcare settings, such as EMRs [6] and IS for cancer care [7]. Unlike previous studies on the diffusion of innovations, this study quantitatively analyzed the adoption process by measuring changes in the factors of the attributes of IS innovation according to Rogers' model three times (before the introduction of the new IS and one month and seven months after the introduction of the new IS).
The purpose of this study was to evaluate the adoption process of a newly developed IS in three public hospitals (Andong, Taegu, and Pohang) that introduced the system on July 1, 2012 in order to determine whether the system could effectively improve the user satisfaction of doctors and nurses. Specifically, the KPI satisfaction scores from the four aforementioned performance layers based on Rogers' diffusion of innovation model were compared before and one month and seven months after the introduction of the system. In addition, the factors influencing 'intention to use' for doctors and nurses were identified using the attributes of innovation from the performance layers as independent variables.
II. Methods
1. Subject
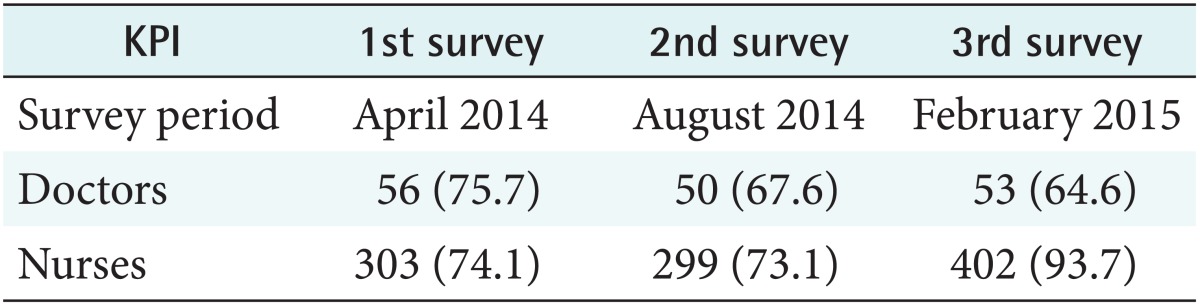
To investigate changes in the KPI satisfaction scores in the four layers, three surveys were conducted with 56 doctors and 359 nurses prior to using the system and 50 doctors and 349 nurses after this group had gained experience with the system for one month at three hospitals (Andong, Taegu, and Pohang). In addition, 53 doctors and 455 nurses were surveyed after seven months of experience, as shown in Table 1.
Survey characteristics
2. Analytic Methods
1) Comparison of key performance indicators before and after system introduction
A set of KPIs was derived from four layers based on the PRM. Specifically, the input layer consisted of IT factors (e.g., system quality, information quality, system usage, perceived ease of use, information sharing, and security) and human factors (top management support). Many of these factors were derived from the IS success model introduced by De-Lone and McLean [2] and Rogers' diffusion of innovation model [5]. Some KPIs were also derived from a previous study on the barriers to EMR adoption [8]. These included 'high costs of EMR', 'lack of technical training', 'complexity of EMR', 'time to enter data into EMR', 'lack of belief in EMR', 'interference with doctor-patient relationship', 'privacy and security', and 'lack of top management support'. 'Intention to use' is a key indicator for measuring users' decisions to adopt IS or not in the final confirmation stage after implementation of the IS for a certain period of time in Rogers' communication channel. In addition, the KPIs in 'perceived ease of use' are complexity attributes of successful innovation by Rogers.
The process layer consisted of the transaction process (the efficiency of the process and quality of business transactions) and the management process (knowledge management and security management). These factors are the outputs of the IS and the relative advantage attributes of IS innovation by Rogers.
The business layer includes the effects of the system on the efficiency of the business outputs and on user satisfaction. The factors in the business layer are the outcome of the IS and the relative advantage attributes of IS innovation by Rogers.
Finally, the performance layer includes the effects of the system on service efficiency, the overall effects of computerization, and improvements in service. The factors in the performance layer are goals of the IS.
2) Factors influencing the adoption of an information system
To identify the key factors influencing the adoption of a new IS, a logistic regression was conducted with 'intention to use' as the dependent variable and the key clinical attributes of IS innovation in Rogers' diffusion of innovation model as the independent variables. Some independent variables were derived from a previous study on barriers of EMR adoption [8]. They were 'age', 'length of employment', 'frequency of attendance in user training sessions', two attributes of innovation from the input layer ('ease of use' and 'mandatory use of the IS'), and three clinical attributes of innovation from the process layer ('reduced medication errors', 'improved accessibility to clinical information', and 'reduced medical record documentation time').
III. Results
1. Descriptive Statistics
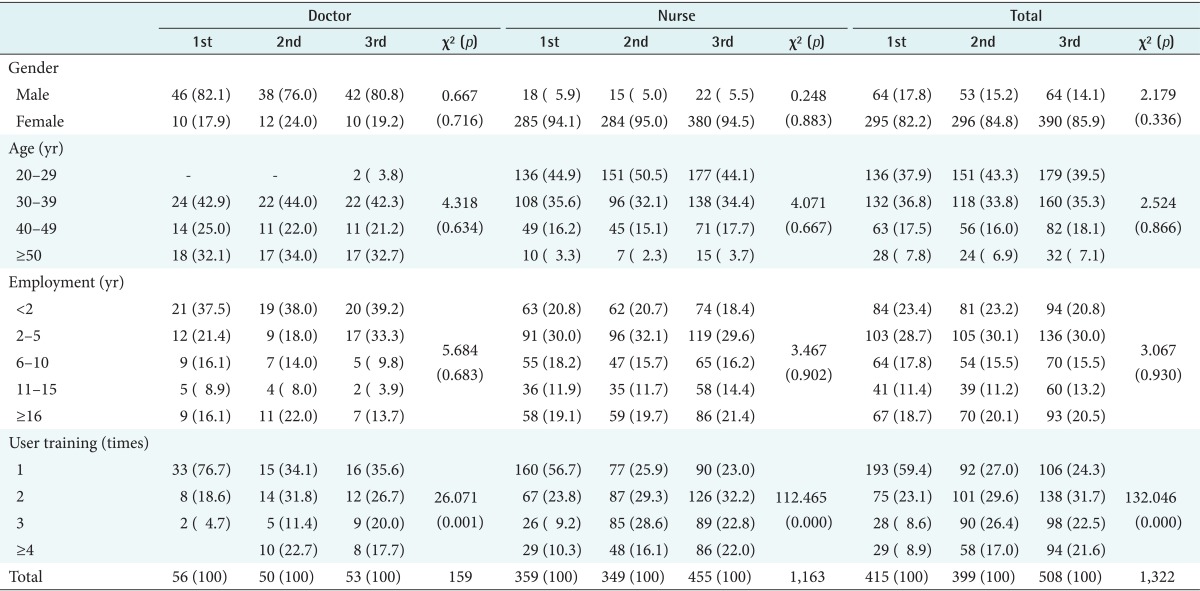
As shown in Table 2, the doctors were predominantly male, and the nurses were predominantly female. Most of the doctors were in their 30s (42%-44%) and 50s (32%-34%), and most of the nurses were in their 20s (44%-51%) and 30s (32%-36%). Most of the doctors had less than six years of employment experience; 38%-39% of the doctors had worked for less than two years and 18%-33% of the doctors had worked for two to five years. Similarly, most of the nurses also had less than six years of employment experience; 30%-32% of the nurses had worked two to five years and 18%-20% of the nurses had worked for less than two years. The frequency of user training attendance varied over time for the two groups. Prior to the introduction of the system (the first survey), 76.7% of the doctors had attended a user training session once, but the frequency of attendance increased in the third survey: 35.6% had attended once, 26.7% had attended twice, and 37.7% had attended more than three times.
Descriptive statistics for doctors and nurses
2. User Satisfaction Scores by Performance Layers
1) Input layer
As shown in Table 3, the average scores for the input layer were 3.09, 3.17, and 3.10 in the three surveys for the doctors, and they were 3.22, 3.26, and 3.24 for the three surveys taken by the nurses. While the overall satisfaction scores of the doctors were lower than those of the nurses, the doctors' satisfaction scores for 'intention to use', which is the most important indicator for determining whether to adopt an IS or not in Rogers' confirmation stage, were higher than the nurses' scores (3.843, 3.78, and 4.21 vs. 3.51, 3.64, and 3.60) despite the fact that all KPIs in 'perceive ease of use' for doctors, which is the complexity attributes of successful innovation by Rogers, were lower than those of nurses. In addition to 'intention to use', 'information sharing' and 'mandatory use of the system' also had high scores in the three surveys for both doctors and nurses. However, many KPIs had lower scores in the third survey as compared to the second survey. The KPIs that had higher satisfaction scores in the third survey than in the second survey were 'electronic authentication' (2.98), 'security' (3.08), 'authorization' (3.23), and 'mandatory use of the system' (3.53) for doctors, and 'response time' (3.02), 'update information' (3.23), 'screen layout' (3.27), 'amount of input' (3.15), 'communication' (3.03), 'security' (3.27), and 'mandatory use of the system' (3.43) for nurses.

Input layer
2) Process layer
As shown in Table 4, the average process layer scores were 3.04, 3.02, and 3.01 in the three surveys for the doctors and 3.11, 3.19, and 3.16 in the three surveys for the nurses. 'Savings in medical record storage' had the highest scores for both doctors (4.04, 3.98, and 3.79) and nurses (3.95, 3.86, and 3.69). 'System recovery' during system malfunction also had high scores for both doctors (3.64, 3.68, and 3.66) and nurses (3.60, 3.54, and 3.65). Similarly, 'improved communication' had high scores for both doctors (3.52, 3.50, and 3.32) and nurses (3.61, 3.49, and 3.42). However, five out of ten KPIs had lower scores in the third survey for doctors ('saved personnel costs', 'reduced documentation time', 'savings in medical record storage costs', 'improved communication', and 'improved system recovery during system malfunction'), and three KPIs had lower scores in the third survey for nurses ('information validation', 'savings in medical record storage costs', and 'improved knowledge sharing').

Process layer
3) Business layer
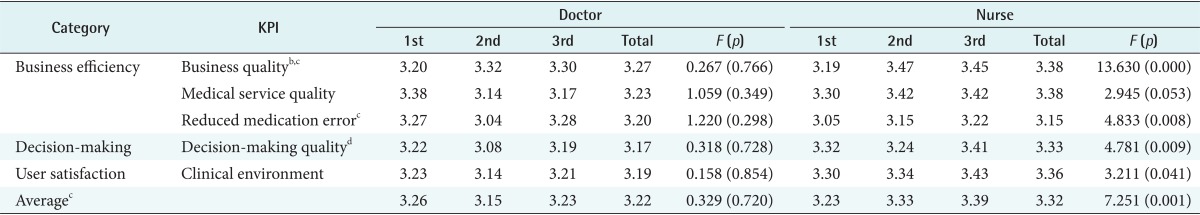
As shown in Table 5, the average business layer scores were 3.26, 3.15, and 3.23 for the doctors and 3.23, 3.33, and 3.39 for the nurses. The KPIs in the business layer are the outcome of the IS and are important factors in the IS success model of DeLone and McLean. Unlike the input and process layers, all clinical KPIs increased in the third survey except for 'business quality'. Specifically, the scores for 'reduced medication errors', which is the key indicator for evaluating the success of an IS, increased in the third survey for both the doctors (3.27, 3.04, and 3.28) and the nurses (3.05, 3.15, and 3.22). This shows that both doctors and nurses considered the clinical effects of the new IS to be positive after using it for seven months. They also considered the effects of the new IS on the clinical environment to be positive. For the nursing staff, the scores for 'reduced medication errors', 'improved decision-making quality', and 'improved clinical environment' significantly increased from the first survey to the third survey (p < 0.05).
Business layer
4) Performance layer
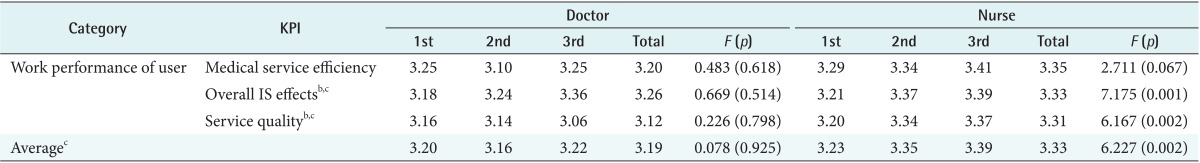
As shown in Table 6, the average scores for the performance layer were 3.20, 3.16, and 3.19 for the doctors and 3.23, 3.35, and 3.39 for the nurses. While the scores for two clinically oriented KPIs (improvement in medical service efficiency and overall IS effects) increased in the third survey for the doctors, all three KPIs increased in the third survey for the nurses. In particular, the scores for the nurses for 'improved overall IS effects', 'improved service quality', and overall average significantly increased from the first survey (p < 0.01). Unlike the previous three layers, all scores for both the doctors and nurses were higher than 3.0. This shows that both doctors and nurses had a positive attitude toward the new IS.
Performance layer
3. Factors Influencing the Adoption of an Information System
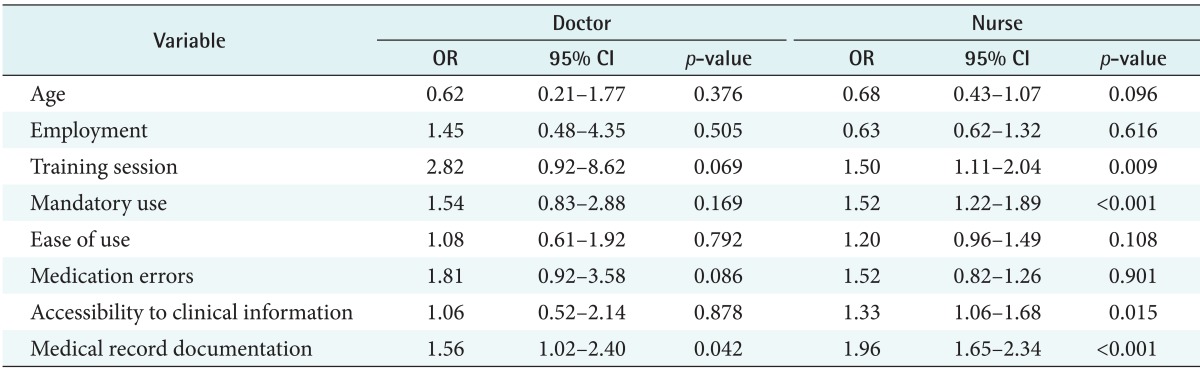
The result of the logistic regression on the adoption of the new IS for doctors and nurses showed that different factors influenced the adoption of the IS (Table 7). While only 'reduced medical record documentation time' significantly influenced 'intention to use' for doctors, 'frequency of attendance of training session', 'mandatory use of system', 'improve accessibility to clinical information', and 'reduced medical record documentation time' were significant factors influencing ' intention to use' for nurses (p < 0.05). The factors that have high odds ratio (>1.5) were a 'frequency of attendance of user training session', 'mandatory use of system', 'reduced medication errors', and 'reduced medical record documentation time' for both doctors and nurses.
Results of logistic regression of intention to use
IV. Discussion
This study evaluated the performance of a newly developed EMR-based information system for three public hospitals by examining changes in satisfaction scores on four performance layers for doctors and nurses before and one month and seven months after the introduction of the system based on the performance reference model [4] and on Rogers' diffusion of innovation model [5].
The scores for 'intention to use', which is the most important indicator for determining whether to adopt an IS or not in Rogers' confirmation stage, were very high for doctors in the third survey (4.21). This shows that the new EMR-based IS was well accepted by doctors. The scores for 'reduced medication errors', which is the key indicator for evaluating the success of an IS, increased in the third survey for both the doctors (3.27, 3.04, and 3.28) and the nurses (3.05, 3.15, and 3.22). This shows that both doctors and nurses considered the clinical effects of the new IS to be positive after using it for seven months. This is in line with the findings of previous studies. They also considered the effect of the new IS on the clinical environment to be positive. Quick access to electronic information, such as laboratory analyses and medical imaging results, and faster prescription updates may reduce the number of redundant diagnostic investigations and therefore improve quality of care and reduce medication errors [91011].
The factors influencing 'intention to use' with a high odds ratio (>1.5) were the 'frequency of attendance of user training sessions', 'mandatory use of system', 'reduced medication errors', and 'reduced medical record documentation time' for both doctors and nurses. This is in line with the findings of previous studies on EMR adoption. Boonstra and Broekhuis [8] found several EMR adoption barriers during the initiation stage, including the technical capability of physicians to use an EMR system, lack of support from organization culture and management, and time to enter data into the EMR system. Pare et al. [12] also found that economical and knowledge barriers (e.g., lack of computer skills to use EMR) were the key challenges preventing medical practices from investing in EMR systems.
There are several implications with regard to improving the system further. Both doctors and nurses were not satisfied with certain aspects of the system quality, including the response time, system performance, and amount of input requited. Moreover, five out of ten KPIs had lower scores in the third survey for doctors. To disseminate the new system successfully to other public hospitals, these problems should be carefully analyzed and corrected.
This study had some limitations. To analyze the adoption behavior of individual doctors and nurses, it is important to follow the same persons during subsequent surveys. However, in this study, it was not possible to follow the same persons because they refused to be identified in the survey. In addition, there were problems with the system, such as insufficient system capacity, and these caused slow response time and decreased user satisfaction. For the results to be more applicable, the adoption behavior of doctors and nurses should be examined again after all system problems have been fixed.
Acknowledgments
This research was supported by the "Performance evaluation program of information systems for the regional public hospitals" funded by the Ministry of Health and Welfare.
Notes
Conflict of Interest: No potential conflict of interest relevant to this article was reported.