Methods Using Social Media and Search Queries to Predict Infectious Disease Outbreaks
Article information
Abstract
Objectives
For earlier detection of infectious disease outbreaks, a digital syndromic surveillance system based on search queries or social media should be utilized. By using real-time data sources, a digital syndromic surveillance system can overcome the limitation of time-delay in traditional surveillance systems. Here, we introduce an approach to develop such a digital surveillance system.
Methods
We first explain how the statistics data of infectious diseases, such as influenza and Middle East Respiratory Syndrome (MERS) in Korea, can be collected for reference data. Then we also explain how search engine queries can be retrieved from Google Trends. Finally, we describe the implementation of the prediction model using lagged correlation, which can be calculated by the statistical packages, i.e., SPSS (Statistical Package for the Social Sciences).
Results
Lag correlation analyses demonstrated that search engine data/Twitter have a significant temporal relationship with influenza and MERS data. Therefore, the proposed digital surveillance system can be used to predict infectious disease outbreaks earlier.
Conclusions
This prediction method could be the core engine for implementing a (near-) real-time digital surveillance system. A digital surveillance system that uses Internet resources has enormous potential to monitor disease outbreaks in the early phase.
I. Introduction
Emerging infectious diseases, such as Severe Acute Respiratory Syndrome (SARS) in 2002, the H1N1 pandemic in 2009, and Middle East Respiratory Syndrome (MERS) in 2015, have highlighted the necessity for a syndromic surveillance system, which can play a significant role in detecting the beginning of an infectious disease outbreak [123]. However, traditional surveillance systems mainly depend on case reports, such as influenza-like illness (ILI) reports, which have time-delays in reporting and case confirmation. To enable the earlier detection of infectious disease outbreaks, a syndromic surveillance system should utilize real-time or near-real-time data, i.e., school or work absenteeism, over the counter medication sales, or the volume of Internetbased health inquiries [4567]. Among diverse alternative data sources, search queries, social media, and website visits have proven potential for digital surveillance systems [3578910]. In Korea, there is a national health alert system operated by the National Health Insurance Service which uses data from social media and blogs [11].
In this paper, we briefly introduce how social media and search queries can be used to predict infectious disease outbreaks. This prediction method could be the core engine for implementing a (near-) real-time digital surveillance system.
II. Case Description
1. Data Collection
To implement a prediction model for the digital surveillance system, the statistics of an infectious disease and digital data, such as search engine queries or social media data, should be collected. Disease statistics are used as target data, and digital data is used as input for the prediction model.
1) Collection of disease statistics
ILI data in Korea can be gathered from Korea Centers for Disease Control and Prevention (KCDC) [12]. Since the ILI reports of the KCDC are published in word processor formats, such as HWP files in Korean and DOC files in English, the data should be manually curated. Figure 1 shows an example ILI report published by the KCDC. The ratio of ILI in week 28 was 6.0.
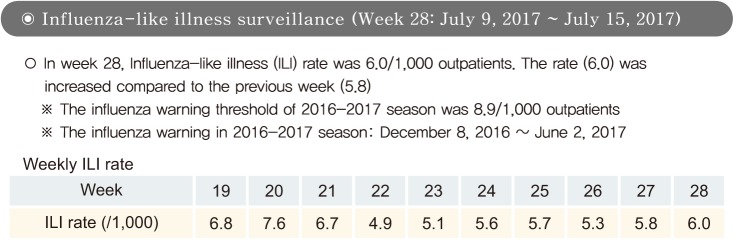
ILI report example from week 28, 2017 (July 9, 2017–July 15, 2017). The ratio is the number of outpatients divided by 1,000.
The MERS statistics of Korea in 2015 were released via the official governmental MERS statistics site. However, since that site was not accessible at the time of this study, the statistics could be alternately collected from Wikipedia [13]. When curating disease statistics, researchers should be cautious about time intervals. ILI data is weekly data, whereas MERS statistics are reported as daily data.
2) Choosing keywords
To collect digital data from search engine queries or Twitter, the keywords that relate to influenza or MERS need to be determined first. This step is the most important step for the performance of disease prediction model. To choose the keywords, both laypersons' opinions and experts' opinion are taken into consideration, since search queries and social media data are generated by laypersons. In our previous works regarding influenza prediction, we conducted a survey by quota sampling based on sex and age to choose keywords [89]. Moreover, we also included keywords that were chosen by physicians, such as fever, cough, and sore throat for influenza prediction, since these keywords are related to the definitions of ILI.
For MERS prediction, MERS and 메르스 (MERS in Korean) were chosen first. Then the top two related combined queries in Korean were added [3]. Moreover, selected keywords were translated into English or Korean since people can perform search queries in both languages. The chosen keywords are shown in Table 1.

The chosen keywords for influenza and MERS
3) Collection of data from search engines
The daily or weekly trends of the keywords for web search queries can be obtained from Google Trends [14] or Naver DataLab [15]. The newly renovated Naver DataLab only offers weekly trends, and it requires several steps to download the output. Therefore, we only explain how to use Google Trends. Google Trends offers various data patterns starting from the previous minute's data to monthly data based on the selected time range. For example, Figure 2 shows the weekly trend of searches for “influenza” of Google Trends between September 9, 2007, and September 8, 2012. Trend data associated with the predefined keywords were retrieved by setting the location parameter to “South Korea” and setting the time parameters. The time parameters were based on previous disease outbreak seasons, for example, “May 2015 to Jun 2015” for MERS in Korea. May 11, 2015 was the symptom onset day of the first laboratory-confirmed patient. The results can be downloaded in a CSV format by clicking the arrow located in upper right in the graph. The downloaded CSV file consists of two columns. The first column represents the week by indicating the starting date of the week and the second column is the trend data. The researcher should collect the necessary trend data for each keyword. Table 2 shows example influenza statistics from ILI reports (Figure 1) with Google Trends data for the following five keywords: “New influenza,” “New flu,” “Fever,” “Tamiflu,” and “Flu” (Figure 2). As shown in Table 2, there is a timedelay pattern between the influenza statistics and Google Trends data.

Trends of influenza search queries, according to Google Trends, between September 9, 2007 and September 8, 2012.

Example of influenza data and Google Trends data
The important fact is that the current trend data obtained from Google Trends or Naver DataLab are available as normalized values, not the absolute numbers of searches. According to Google Trends, “Numbers represent search interest relative to the highest point on the chart for the given region and time. A value of 100 is the peak popularity for the term. A value of 50 means that the term is half as popular. Likewise, a score of 0 means the term was less than 1% as popular as the peak.”
The previous site of Naver DataLab, called Naver Trends offered the separate data trends for mobile and desktop searches [16]. However, Naver DataLab does not distinguish between mobile and desktop trends as Google Trends does. In our previous work, we collaborated with Daum to collect curated data [89].
People search web pages using one or multiple words at a time. To reflect this behavior, combinations of the chosen keywords should be considered, for example, “H1N1”, “H1N1 Treatment”, “H1N1 Symptom”, “Influenza”, “Influenza Treatment”, and “Influenza Symptom”.
4) Collection of data from Twitter
Among diverse social media platforms, Twitter has been used as a data sources for digital surveillance systems [17]. In our previous work, the number of tweets containing one of the predefined keywords was collected through Topsy, which is a certified partner of Twitter that offers social searching and social analytics [3]. However, Topsy closed a few years ago. There are alternative services, such as GNIP [18] or Talkwalker [19]; however, researchers would be required to purchase the relevant data from them. Therefore, there is currently a barrier to using Twitter data.
2. Data Analysis
Spearman correlation analyses can be used to examine the correlations between search engine data and disease data. Lag correlation analyses can be used to assess the temporal relationships between these sets of data for up to userdefined days or weeks. Significance was set at p < 0.05. In our work, we used the SPSS package to obtain statistical values, and the proposed method is summarized as follows. The KCDC data values are placed tidily in a column (Table 2). The search engine query data values to be compare are placed next to it. The data must be arranged in rows so that each row represents a specific time period. The correlation value obtained in this state means present (0 week lag) [8]. To get the correlation coefficient of preceding or lagging week, the column containing a search engine query data value is moved in the desired direction and correlation analysis is performed. In this case, the data that differ by the number of weeks to be compare is placed in the same row.
To see the changes in correlation coefficients over time, correlation coefficients in subsequent epidemiological intervals are calculated. These correlation coefficients can be used to validate the developed prediction model. If necessary, subgroup analyses for the period are conducted along the same lines. For example, we performed a subgroup analysis focusing on the acceleration and deceleration period of MERS (June 3, 2015–June 26, 2015) adopting the CDC interval [3].
III. Discussion
The proposed digital surveillance system which uses Internet resources has enormous potential to monitor disease outbreaks in the early phase; however, this approach has some limitations as well. First, in our work, it was difficult to choose keywords although they have a considerable effect on the performance of a prediction model. More importantly, keywords should be changed periodically. For example, before 2015 only experts were aware of MERS. However, most Koreans know about MERS nowadays. Since people continuously learn new terminology and change the search keywords they use, keywords should be updated regularly to maintain prediction performance [9]. Second, as in the case of Google Flu, this system can fail to predict disease outbreaks correctly [20]. Therefore, the proposed digital surveillance system should be used with caution or as a complementary method.
Notes
Conflict of Interest: No potential conflict of interest relevant to this article was reported.