Prediction of Diabetes Using Data Mining and Machine Learning Algorithms: A Cross-Sectional Study
Article information

Abstract
Objectives
This study aimed to develop a model to predict fasting blood glucose status using machine learning and data mining, since the early diagnosis and treatment of diabetes can improve outcomes and quality of life.
Methods
This cross-sectional study analyzed data from 3376 adults over 30 years old at 16 comprehensive health service centers in Tehran, Iran who participated in a diabetes screening program. The dataset was balanced using random sampling and the synthetic minority over-sampling technique (SMOTE). The dataset was split into training set (80%) and test set (20%). Shapley values were calculated to select the most important features. Noise analysis was performed by adding Gaussian noise to the numerical features to evaluate the robustness of feature importance. Five different machine learning algorithms, including CatBoost, random forest, XGBoost, logistic regression, and an artificial neural network, were used to model the dataset. Accuracy, sensitivity, specificity, accuracy, the F1-score, and the area under the curve were used to evaluate the model.
Results
Age, waist-to-hip ratio, body mass index, and systolic blood pressure were the most important factors for predicting fasting blood glucose status. Though the models achieved similar predictive ability, the CatBoost model performed slightly better overall with 0.737 area under the curve (AUC).
Conclusions
A gradient boosted decision tree model accurately identified the most important risk factors related to diabetes. Age, waist-to-hip ratio, body mass index, and systolic blood pressure were the most important risk factors for diabetes, respectively. This model can support planning for diabetes management and prevention.
I. Introduction
Diabetes is recognized as a major health problem due to its increasing prevalence in children and adults. It is a chronic disease that disrupts blood glucose control and is caused by insulin dysfunction, which leads to increased blood glucose and disturbances in carbohydrate, fat, and protein metabolism [1,2]. There are three main types of diabetes. Type 1 diabetes is characterized by inadequate insulin production. Type 2 diabetes, which is most prevalent among individuals aged 45–60, involves elevated blood glucose levels resulting from metabolic disturbances influenced by lifestyle, diet, and genetic factors [2,3]. Gestational diabetes develops during pregnancy and is driven by hormonal changes [3].
If diabetes is not diagnosed in a timely manner and managed appropriately, it can lead to serious health complications and affect various parts of the body over time [4,5]. Consequently, diabetes is a contributing factor to kidney diseases, vision loss and other eye problems, as well as strokes and heart diseases [6,7]. Additionally, the economic impact of the disease is substantial; the global economic burden of diabetes is projected to reach approximately 802 billion dollars by 2040 [1]. As a result, the diagnosis and prognosis of diabetes have garnered increasing attention [4]. In modern health systems, extensive databases contain vast amounts of data, underscoring the importance of data analysis in the delivery of healthcare [7,8]. Machine learning and data mining techniques are instrumental for extracting knowledge and making predictions from this data [8,9]. These methods have been employed in the diagnosis of diabetes, the prediction of complications such as nephropathy and retinopathy, and the identification of patients at high risk in order to enhance patient care and optimize the allocation of resources [10].
Numerous studies have explored the use of machine learning for predicting and diagnosing diabetes, presenting a variety of prediction models and comparing their sensitivity and the area under the receiver operating characteristic (ROC) curve [3,4,8,11]. Despite these advancements, there remains potential to further improve model performance and to validate these findings in new populations, such as the Iranian cohort. For instance, a study by Olisa et al. [4] demonstrated an improved model for predicting and diagnosing diabetes by optimizing data preprocessing methods. Additionally, other studies have revealed variations in the accuracy, correctness, and sensitivity of machine learning algorithms [3,8,11]. Moreover, only a limited number of studies have examined the significance of anthropometric indices, such as the waist-to-hip ratio (WHR), and their association with diabetes status. The findings from these studies have also been inconsistent. One study identified waist circumference and body mass index (BMI) as the most reliable predictors [12], while another suggested that waist circumference and the waist-to-height ratio are superior to BMI [13]. A separate study focusing on the Iranian population found waist circumference to be the most effective predictor [14].
Given the rising prevalence of diabetes, the unreliability of diagnostic measurements, the inconsistent results from previous studies, and the scarcity of research on the Iranian population, our current study employed advanced machine learning and data mining algorithms. We used data from individuals aged 30 and older living in Tehran Province who participated in a diabetes screening program. The goal was to create a predictive model for fasting blood glucose (FBG) status (normal versus abnormal) by utilizing demographic, anthropometric, and clinical risk factors as predictive features.
II. Methods
This cross-sectional study analyzed data from a diabetes screening program in Tehran, Iran, involving 3,376 participants aged over 30 years. The program was conducted at 16 governmental comprehensive health service centers to determine the prevalence of diabetes and its associated risk factors from 2018 to 2020. The diabetes screening program is a routine triennial event for individuals over the age of 30. Outreach for the program is conducted by health service provider personnel in each region. Participation in the screening is voluntary. A stratified multi-stage sampling method was employed. Data were collected using a checklist and the World Health Organizaqtion STEPwise approach to NCD risk factor surveillance (STEPS) guide techniques [15]. The study’s findings were reported in accordance with the guidelines and recommendations for machine learning [16,17].
Before use, all instruments were calibrated. Participants were measured for height and weight while barefoot and wearing light clothing to ensure accuracy. Additionally, two indices—BMI and WHR—were used to assess obesity. Blood pressure was measured twice, following a 15-minute rest period, and the average of these measurements was recorded as the participant’s blood pressure. To measure FBG, venous blood samples were collected after a 12-hour fast. Subjects with an FBG level between 100 and 125 mg/dL were classified as having prediabetes, while those with an FBG level exceeding 125 mg/dL were classified as having diabetes [18]. Furthermore, subjects with a history of diabetes treatment were classified as having diabetes regardless of their recorded FBG value [19].
The dataset displayed an imbalance in the number of records pertaining to FBG status. Out of the 3,376 records, 2,660 subjects were classified as having a normal status, 311 subjects were identified as having prediabetes, and 405 subjects were diagnosed with diabetes. Thus, the proportion of diabetic individuals was approximately 12%, those with prediabetes constituted around 9%, and the remaining subjects fell into the normal category. This imbalance in the dataset relative to the outcome variable can influence the modeling process, as it tends to be biased towards the group with more data. As a result, the model’s performance in predicting outcomes for the group with fewer records may be less than optimal [20]. To address this issue, the data were stratified into two groups (Figure 1): Group 1 (normal), subjects whose FBG value is less than 100 mg/dL; and Group 2 (abnormal), subjects on medication for high blood glucose or whose FBG value was 100 mg/dL or more. This group includes subjects with prediabetes and diabetes.
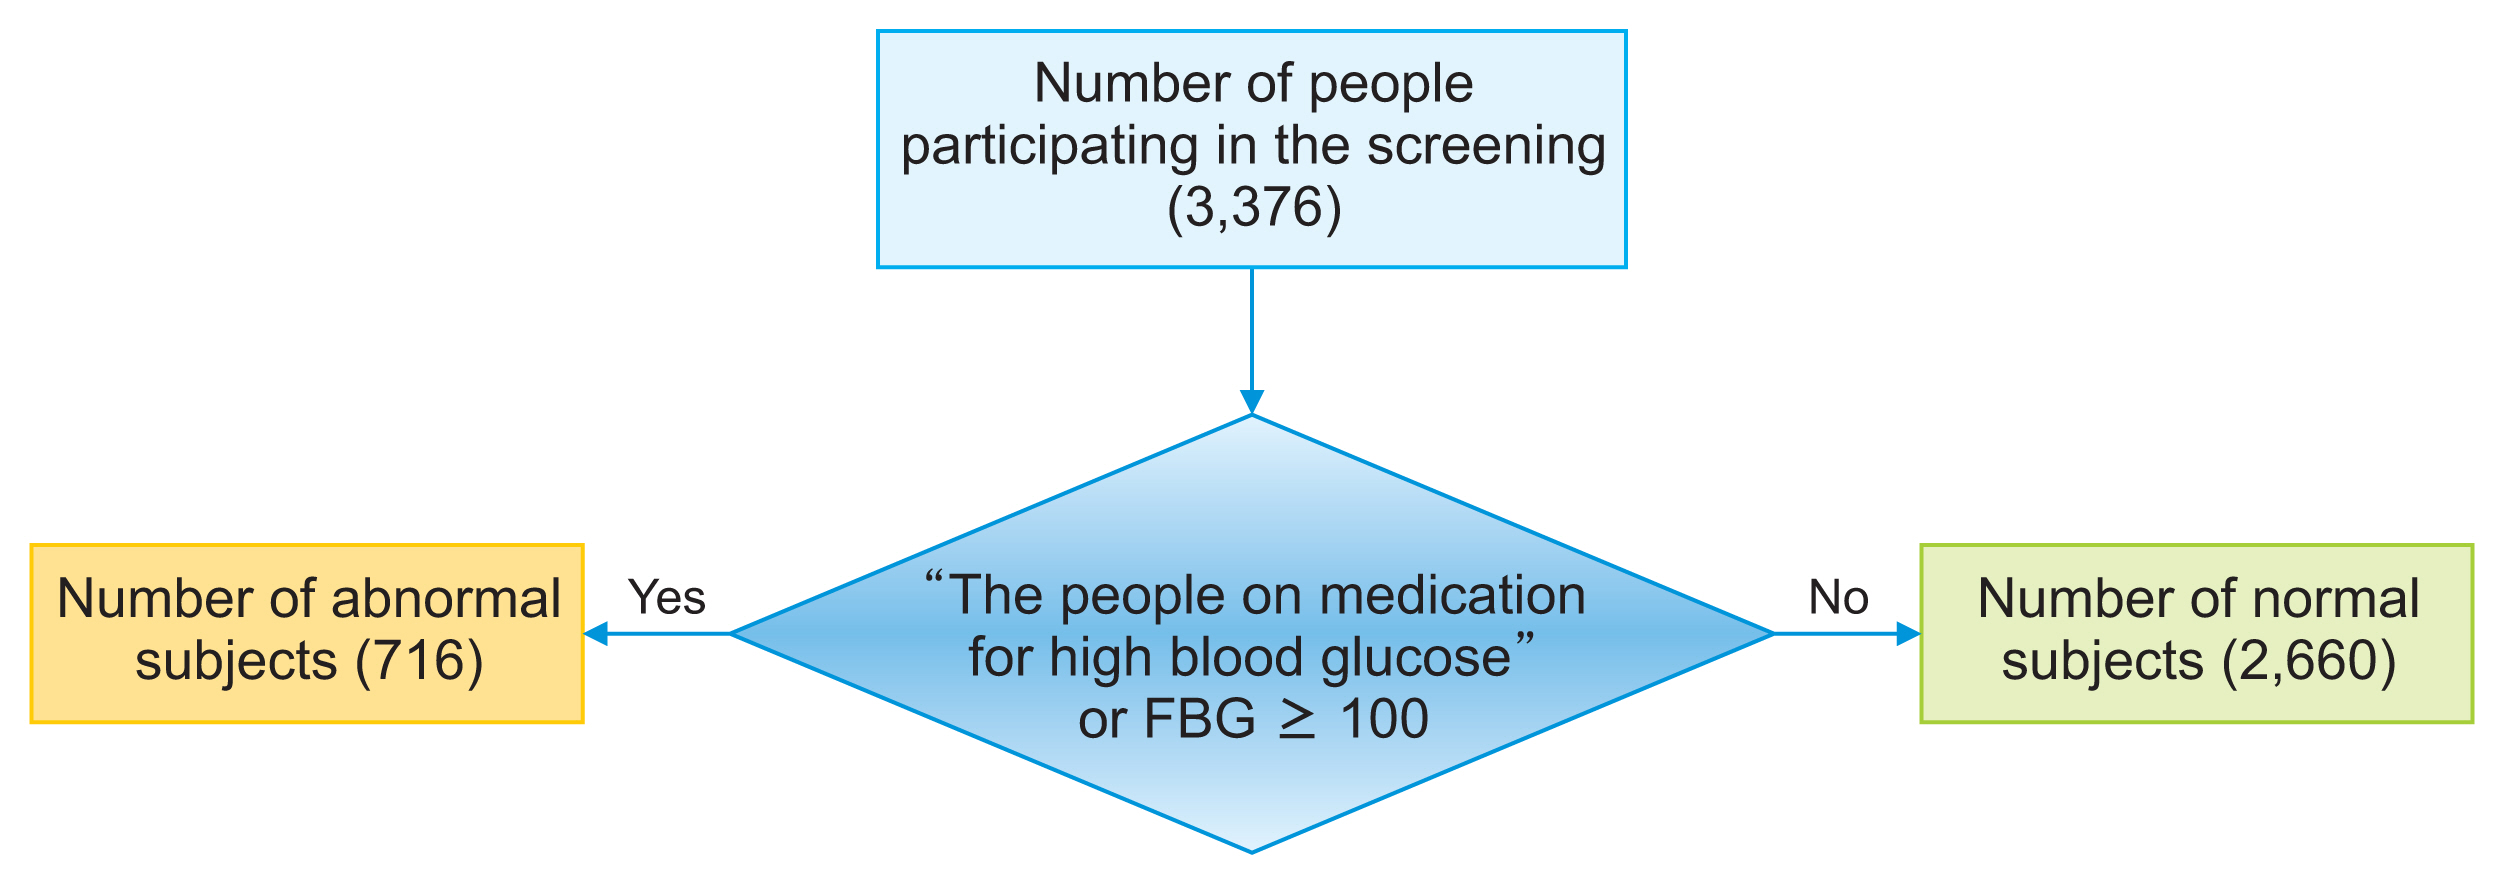
Division of subjects into normal and abnormal groups. FBG: fasting blood glucose.
The predictor variables and the outcome variable in this study were as follows:
Outcome:
• The outcome was FBG status, categorized as normal versus abnormal.
Predictors:
• Predictors included demographic factors (age, sex), anthropometrics (weight, height, BMI, WHR), clinical measurements (blood pressure), behavioral factors (smoking status), and diabetes family history.
• Age, sex, smoking status, and diabetes family history were obtained through questionnaires.
• Anthropometrics were measured using standard protocols (e.g., weight measured with participants barefoot and in light clothing).
• Blood pressure was measured twice following a 15-minute rest period.
• BMI and WHR were calculated from height, weight, waist, and hip measurements.
Figure 2 outlines the general steps of data processing. Initially, features were analyzed, and the necessary preprocessing steps were conducted. Numerical features were characterized by their mean and standard deviation, while categorical features were described by the count of records for each unique value. As new features, the BMI and WHR were added to the dataset using values for weight, height, waist circumference, and hip measurements. Furthermore, given the significance of age as a predictor for diabetes, a new feature named “age group” was created. This feature categorized age into 10-year intervals (30–39, 40–49, etc.).

General steps of data processing for modeling. SMOTE: synthetic minority over-sampling technique, AUC: area under the receiver operating characteristic curve.
Several records contained missing values. To address the missing values in numerical features, we imputed the mean, while for categorical features, we used the mode to fill in the gaps. Additionally, we identified and addressed outliers in the continuous variables. Boxplots were employed to visualize the distributions and highlight potential outliers. To manage these outliers, we replaced values below the 5th percentile and above the 95th percentile with the corresponding 5th and 95th percentile values. This method of capping outliers at percentiles preserved the overall distribution while mitigating the influence of extreme values. Furthermore, we applied normalization to the numerical features and one-hot encoding to the categorical features.
The Shapley method was utilized for feature selection during the modeling process. Originating from game theory, this method assesses the importance of each feature in predicting the model’s outcome by calculating Shapley values [21]. Initially, the data were modeled using the XGBoost algorithm. Shapley values were then determined based on this preliminary model and arranged in descending order. The top-ranking features were incorporated as predictors in the final model. To determine the stability of the feature selection method, Gaussian noise ranging from 5% to 20% was introduced to the numerical features within the training dataset. For each specified level of noise, a new model was constructed using the XGBoost algorithm, and Shapley values were recalculated. Ultimately, features that consistently appeared as one of the top five important features across various noise intensities were identified as significant.
The dataset was unbalanced with respect to the outcome variable. It contained 3,376 records, of which 2,660 subjects were classified as having a normal status and 716 as having an abnormal status. Consequently, the proportion of subjects with a normal status was approximately 79%. Therefore, if a classification algorithm were applied to this dataset without modification and it predicted all records as normal, the accuracy would be 79%. To correct this imbalance, it was necessary to increase the number of records in the abnormal group and decrease those in the normal group to achieve a more balanced distribution. To address the data imbalance, we employed a combination of random sampling methods on the normal records and the synthetic minority over-sampling technique (SMOTE) to augment the abnormal records [22]. The SMOTE technique is effective in balancing the dataset by generating new, synthetic samples, thereby avoiding the repetition of existing samples [23]. It is important to note that imbalance management was conducted solely on the training data. Initially, the dataset was partitioned into training data (80%) and test data (20%). The random sampling method was then applied to the training data to reduce the number of normal records to twice that of the abnormal records. Afterward, the SMOTE technique was utilized to increase the number of samples in the abnormal group, thereby equalizing the number of records between the two groups.
Machine learning algorithms are broadly categorized into three main types: supervised, unsupervised, and reinforcement learning algorithms [24]. This research specifically utilized supervised learning algorithms.
The gradient boosted decision trees (GBDT) method is a supervised machine learning technique that currently stands as one of the advanced methods for modeling with decision trees [25]. Decision trees can achieve optimal convergence without the need for large datasets. Moreover, the interpretability of decision trees surpasses that of neural networks, which often operate as a “black box.” Additionally, decision trees exhibit superior management of class characteristics and offer the ability to separate data at their decision nodes [26]. One of the tree-based classification algorithms introduced in recent years is the CatBoost algorithm. It accommodates class features and has demonstrated superior performance compared to other GBDTs, such as XGBoost [11] and LightGBM [27].
In this research, the CatBoost, XGBoost, random forest, logistic regression, and feed-forward neural network algorithms were used for modeling. Moreover, an ensemble voting classifier was used to combine these models. Finally, the modeling results based on these algorithms were compared.
In addition to the development of the reduced model using the top features selected by Shapley values, a full prediction model was created using all original variables without feature selection. This enabled a comparison of model performance with and without feature reduction.
After the development of various models, they were evaluated using data from the test set, which comprised 20% of the total data. The evaluation metrics reported for the different models included sensitivity, specificity, accuracy, F1-score, and area under the ROC curve (AUC). Additionally, ROC curves were generated for each model.
This study involved an analysis of secondary data from a diabetes screening program in Tehran. Approval for the study was granted by the Research Council of Iran University of Medical Sciences (IRB No. IR.IUMS; Ethics Code REC.1401709). Informed consent was obtained from all participants in the original study. Prior to our acquisition for the current analysis, the data were anonymized.
III. Results
Table 1 provides details about the characteristics of the dataset, including additional features such as BMI and WHR. Figure 3 illustrates the relationship between predictor variable values and FBG status, highlighting direct correlations among blood pressure, BMI, WHR, and FBG status. Furthermore, there was an evident increase in the likelihood of diabetes as age progressed. The observed difference in mean age can be attributed to a mix of biological, lifestyle, and socioeconomic factors.
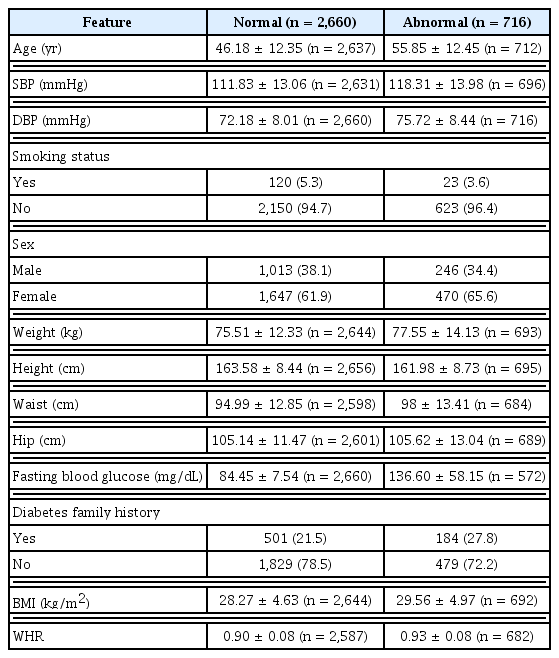
Sample characteristics
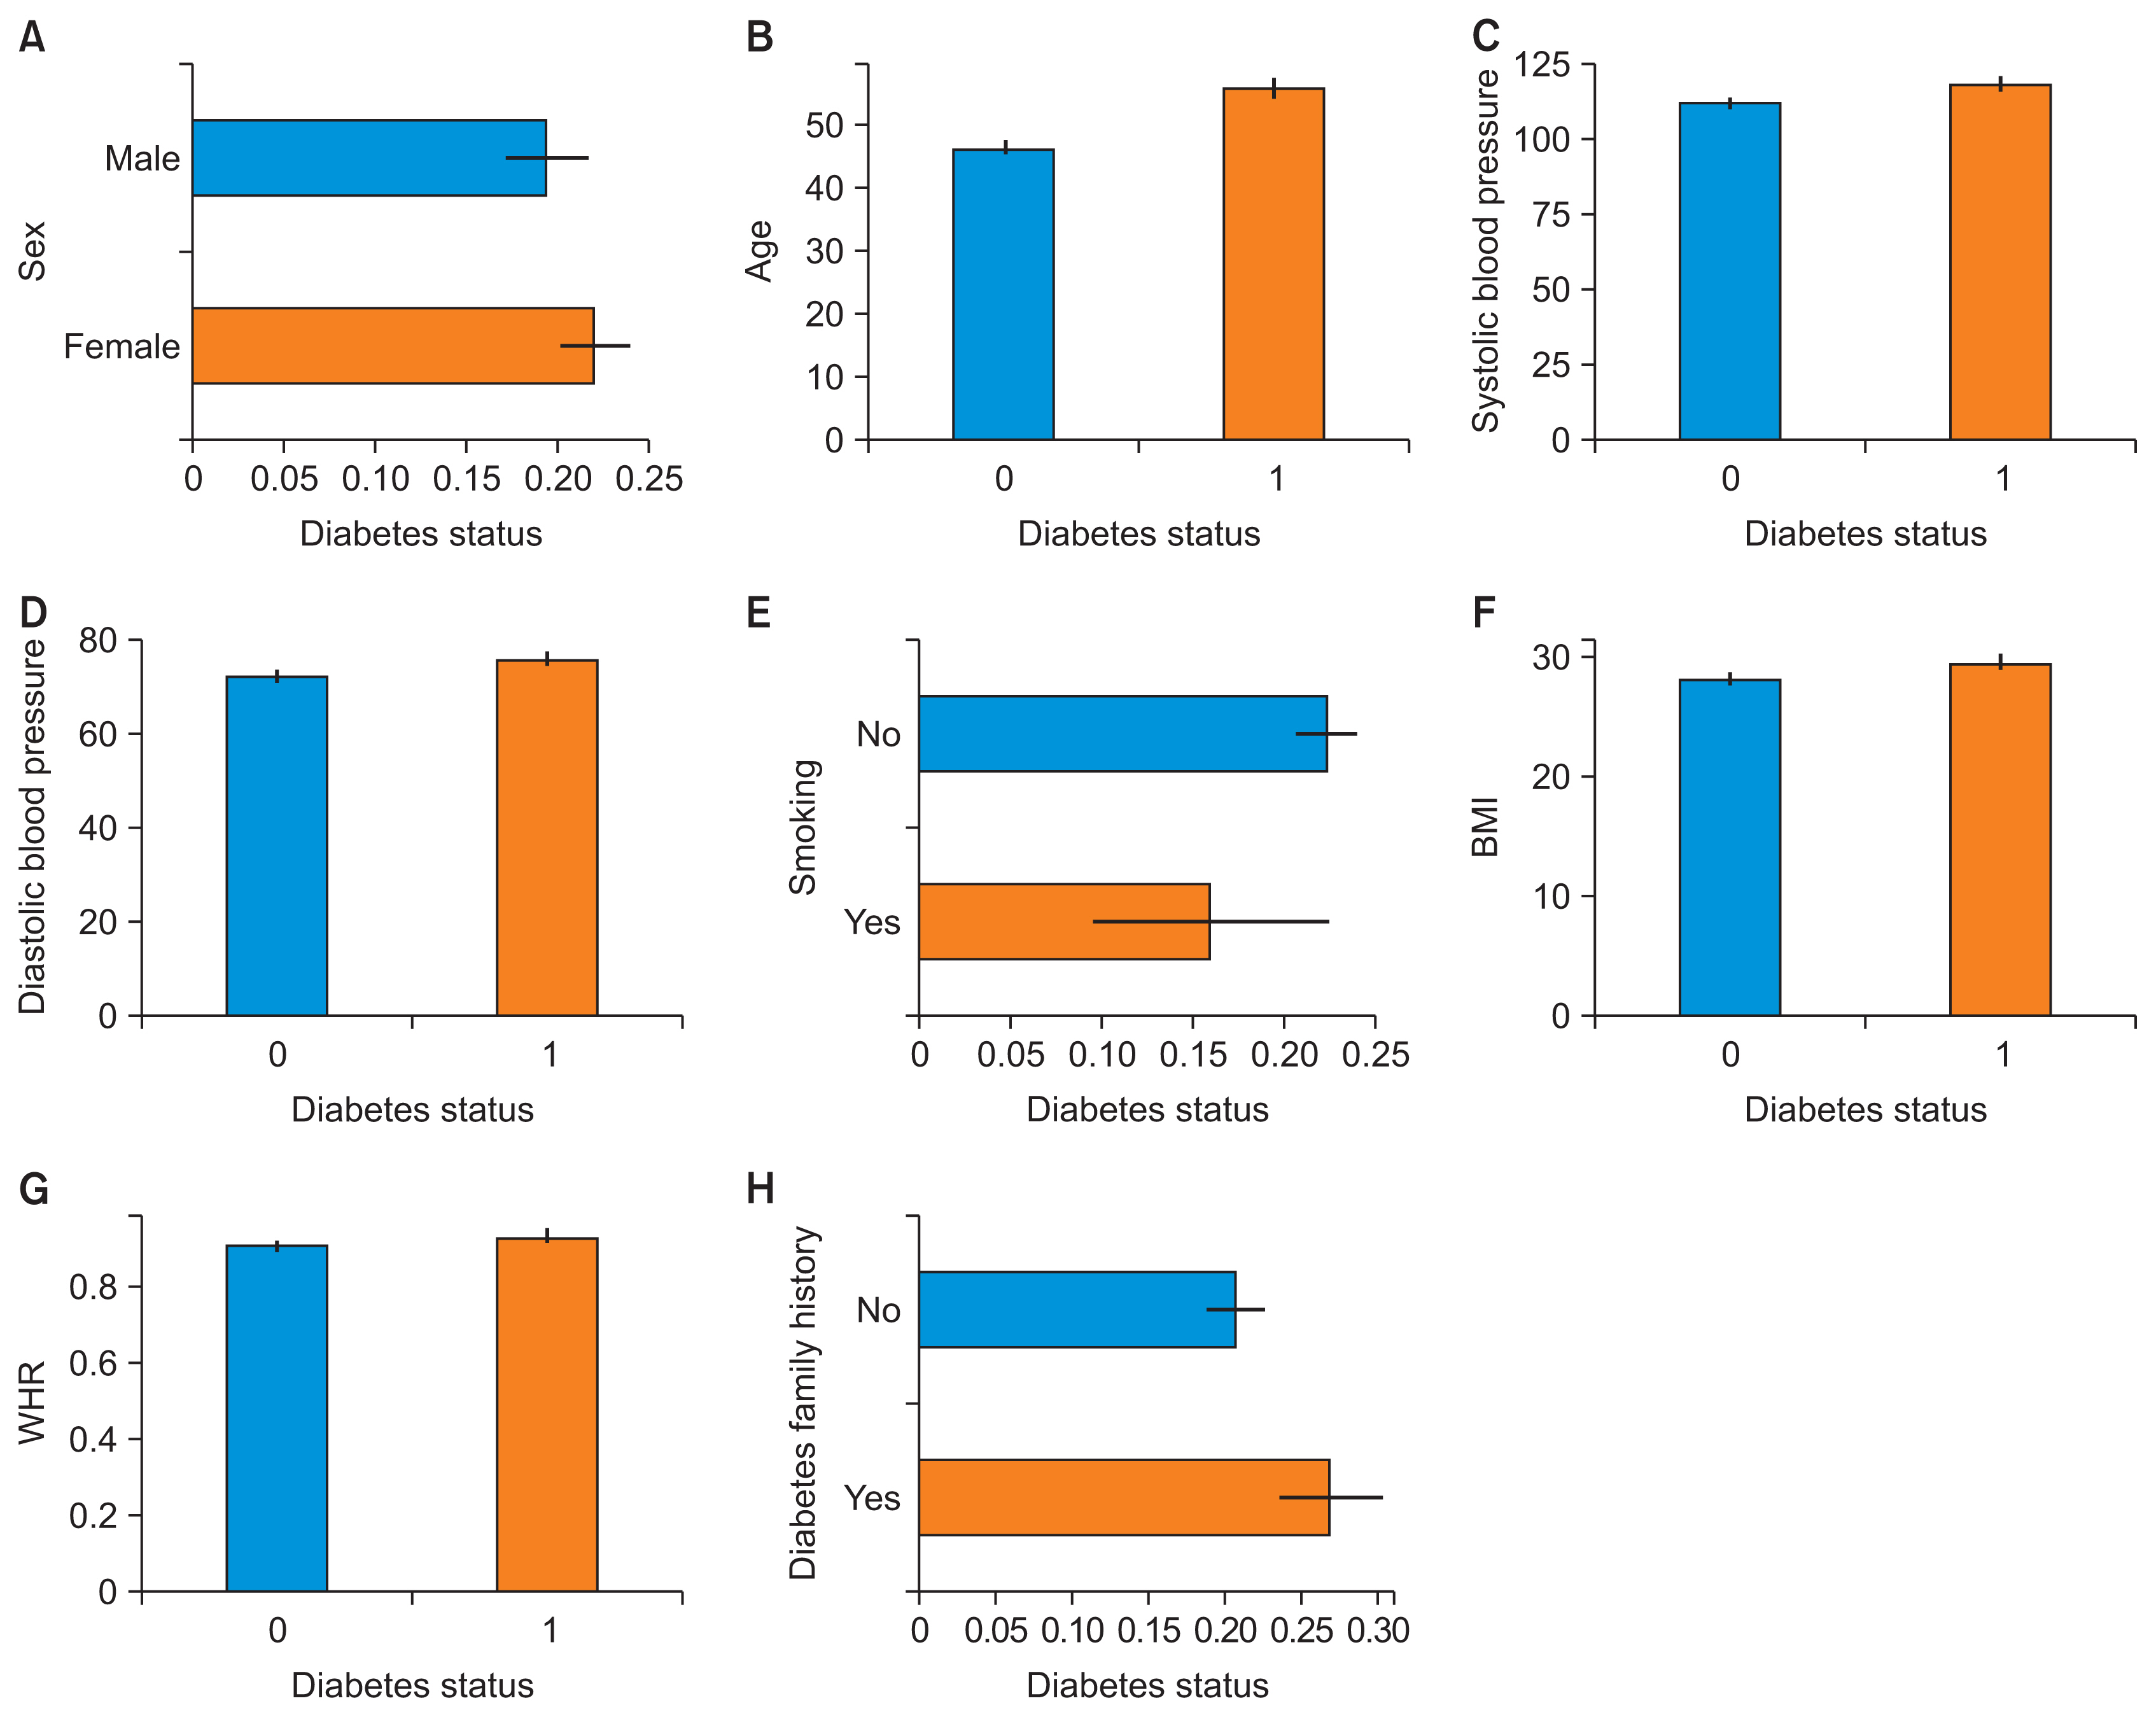
The relationships between predictive variables and fasting blood glucose status: (A) sex, (B) age, (C) systolic blood pressure, (D) diastolic blood pressure, (E) smoking, (F) body mass index (BMI), (G) waist-to-hip ratio (WHR), and (H) diabetes family history.
In Figure 4, boxplots depict the data before and after replacing outliers with 5th and 95th percentile values. This adjustment effectively mitigated the influence of extreme values, while maintaining the overall distribution.
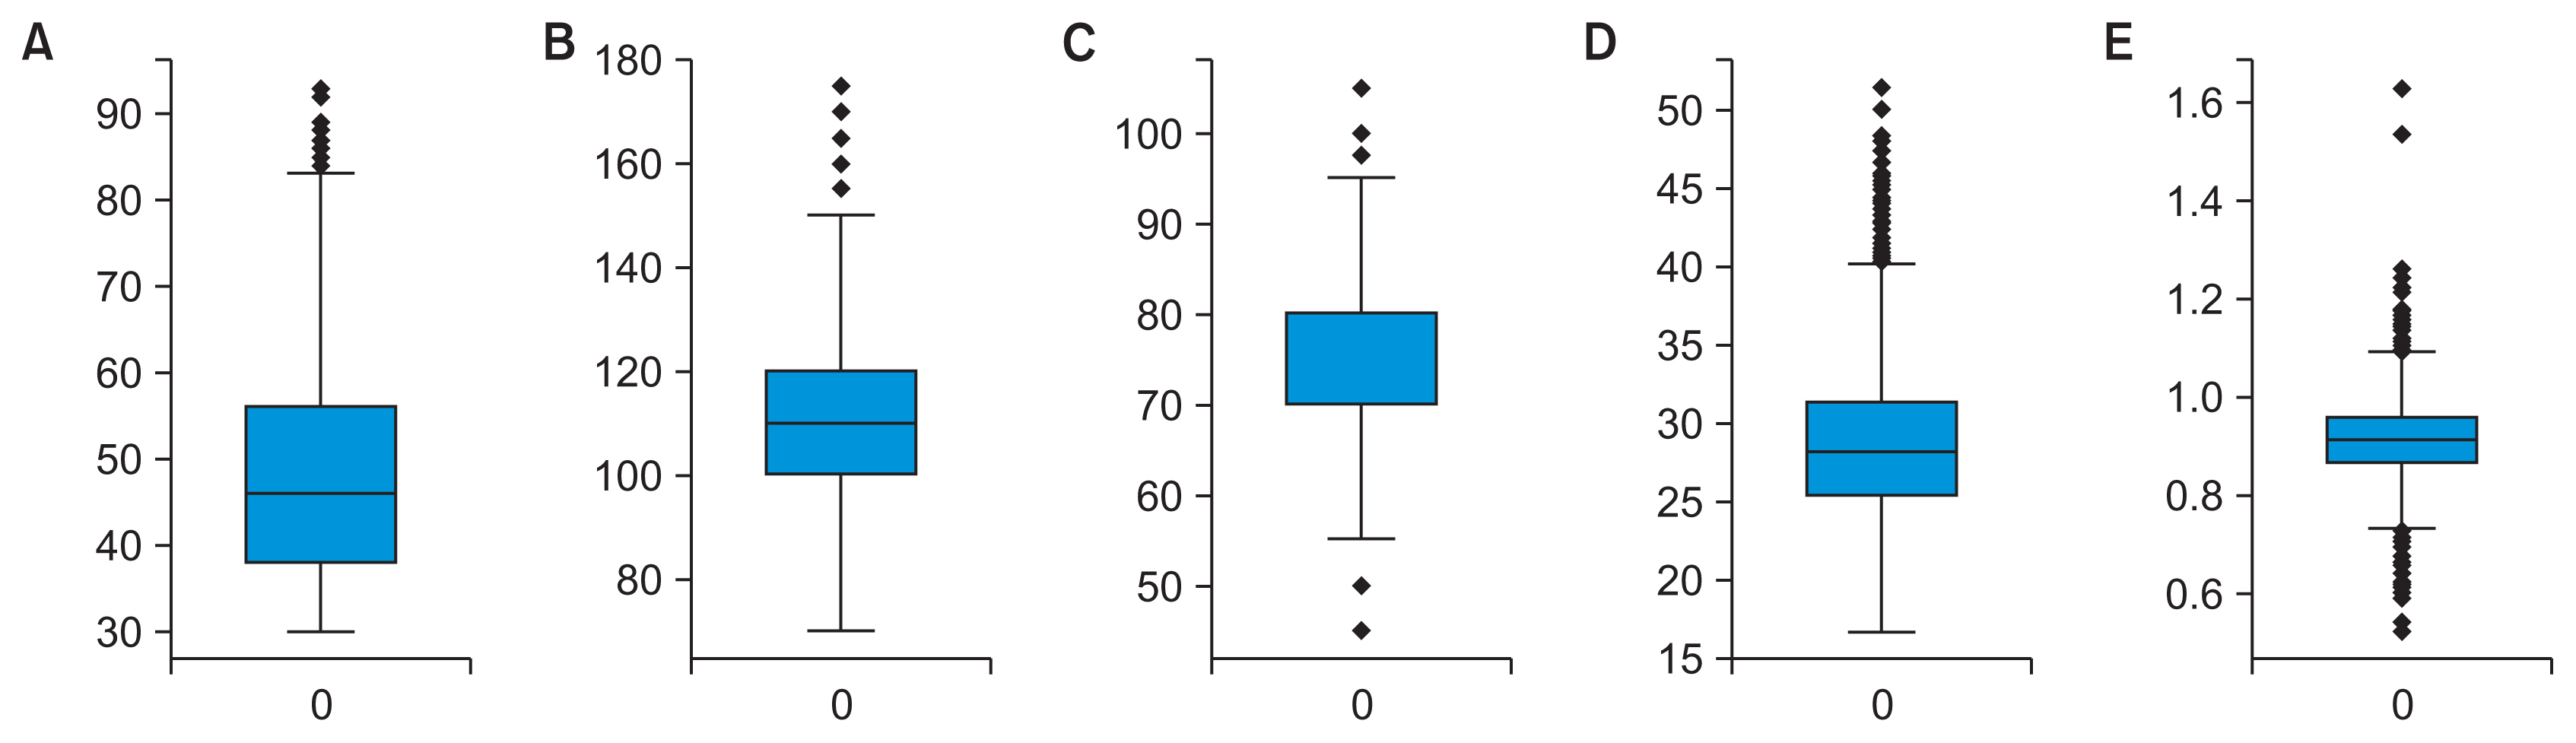
Boxplots comparing distributions before and after outlier removal: (A) age, (B) systolic blood pressure, (C) diastolic blood press, (D) body mass index, and (E) waist-to-hip ratio.
Based on the results obtained from the initial modeling with the XGBoost algorithm and using the Shapley method, a set of important features was selected. Figure 5 displays the Shapley values calculated for training data without noise. To assess the robustness of feature selection, noise analysis was conducted with Gaussian noise ranging from 5% to 20%. Table 2 summarizes the top five features selected by Shapley values for different noise levels.
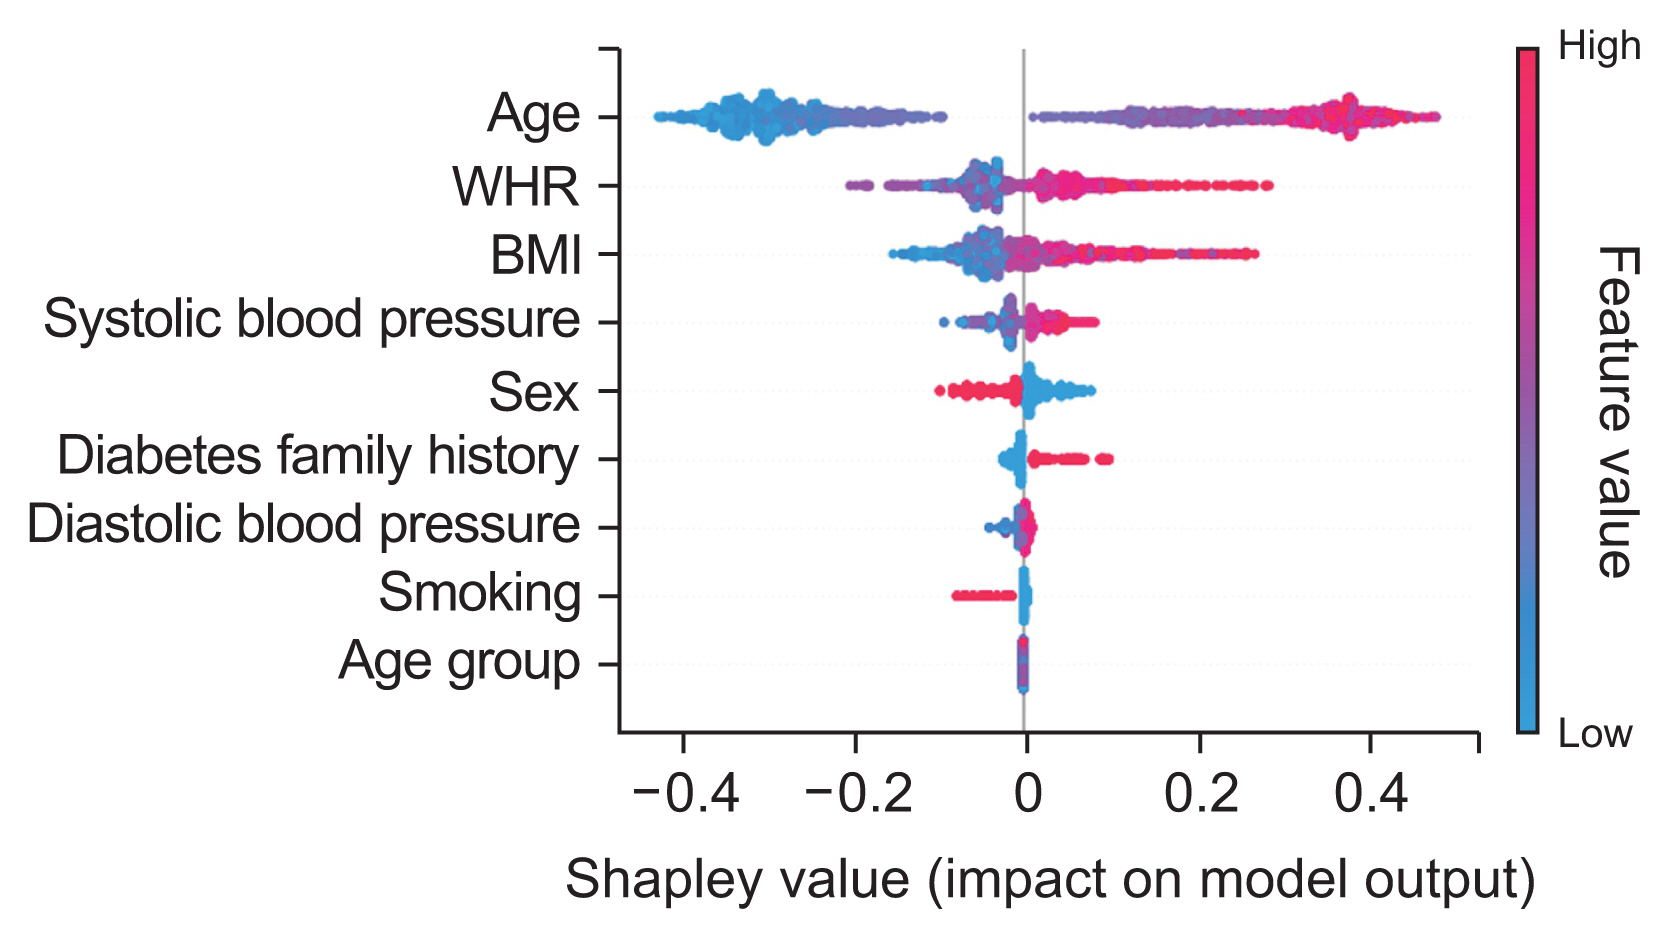
Shapley diagram showing the relative importance of features. WHR: waist-to-hip ratio, BMI: body mass index.
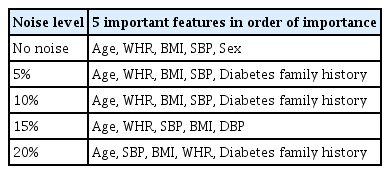
Effects of noise on important features based on Shapley values
Age, WHR, BMI, and systolic blood pressure were consistently ranked among the top five most important features across all noise levels. Consequently, these four features were selected based on their significance in predicting the outcome variable, and subsequent modeling was conducted using these variables.
The modeling utilized several algorithms, including Cat-Boost, random forest, XGBoost, logistic regression, and artificial neural network, as well as the Python programming language. After a tuning procedure that employed a trial-and-error method, the optimal model parameters were identified and applied during the training phase. Figure 6 displays the confusion matrix for the various models.

Confusion matrix for different models: (A) CatBoost, (B) logistic regression, (C) random forest, (D) XGBoost, (E) artificial neural network, and (F) ensemble classifier.
The ensemble model yielded the highest accuracy. Of the 676 records in the test dataset, it correctly predicted 450 records, resulting in an accuracy rate of 0.666. The models’ relatively low accuracy may be attributed to the disproportionate number of normal records compared to abnormal ones. Additionally, the predictive variables may have been insufficient.
Evaluation criteria such as accuracy, sensitivity, specificity, F1-Score, precision, and AUC are presented in Table 3. The models demonstrated nearly identical predictive capabilities. The CatBoost model, however, showed a slight edge with an AUC of 0.737. Following CatBoost, the models were ranked in descending order of performance: random forest, XGBoost, artificial neural network, and finally, logistic regression. The comprehensive model, which included all variables, achieved the highest AUC at 0.736. Notably, the streamlined model that utilized only the top four selected features showed a slight improvement in overall performance. Although the increase in performance was modest, the use of fewer features offers benefits in terms of simplicity, interpretability, and a reduced risk of overfitting.

Comparison of model performance
Figure 7 presents the ROC curve for the various models, showing comparable outcomes. The CatBoost model achieved the highest AUC value of 0.737, surpassing the random forest, XGBoost, artificial neural network, and logistic regression models, which had AUC values of 0.732, 0.725, 0.723, and 0.722, respectively.
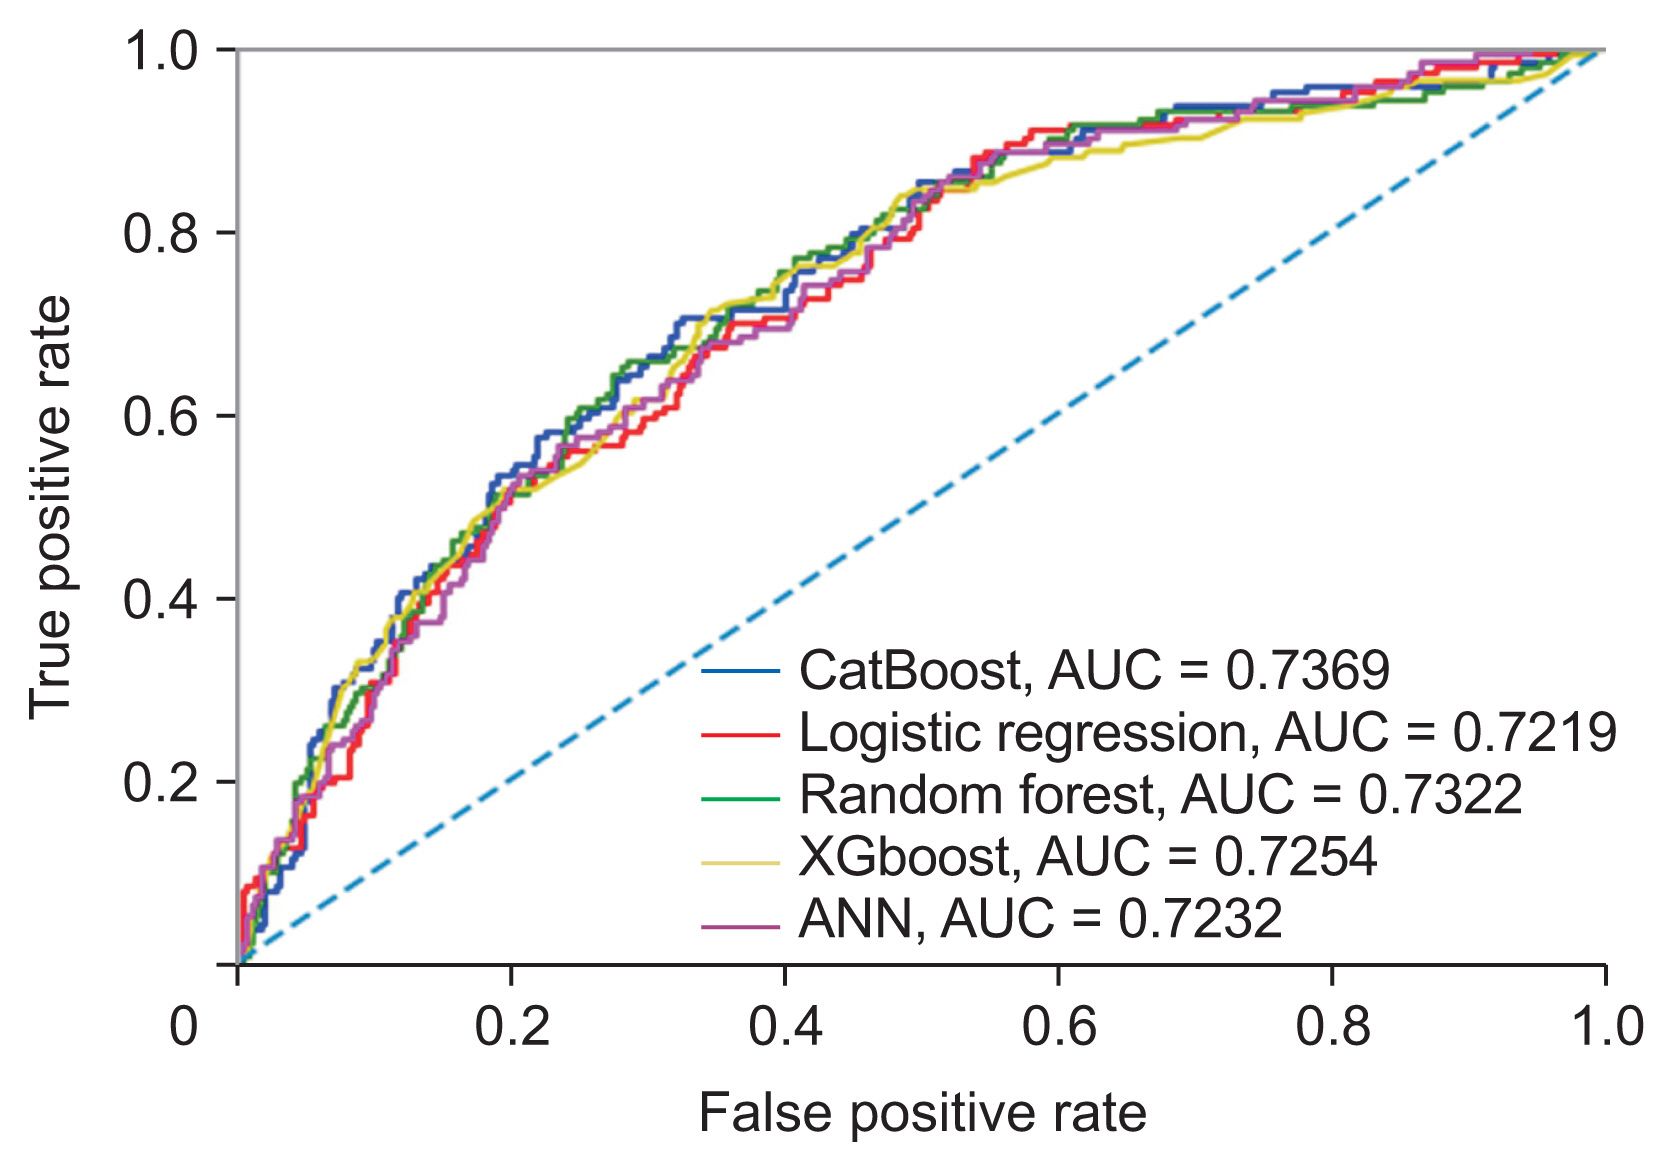
Receive operating characteristic curves of different models. ANN: artificial neural network, AUC: area under the curve.
IV. Discussion
Artificial intelligence offers considerable benefits for event prediction through the use of machine learning algorithms and has proven effective in forecasting diabetes status [28]. In this study, we utilized five machine learning algorithms—CatBoost, random forest, XGBoost, logistic regression, and an artificial neural network—to analyze the dataset. The CatBoost algorithm, which is recognized for its ability to process categorical features directly without the need for pre-processing, exhibited the highest accuracy in terms of model performance. Notably, the CatBoost model delivered the most favorable results in our research, achieving an AUC of 0.737 on the test data. This result confirms the model’s efficacy in predicting FBG status by incorporating relevant risk factors.
In the present study, the Shapley method was employed to identify important features from the 13 characteristics under consideration. The noise analysis shed light on the robustness of the feature selection process. Age and WHR demonstrated the greatest resistance to noise, consistently maintaining the highest Shapley values at various noise levels. This indicates a strong and significant correlation between these characteristics and FBG status. Conversely, systolic blood pressure and body mass index were more susceptible to noise, suggesting a potentially weaker link that could be affected by data variability. Despite some fluctuations in feature relevance due to noise, age, WHR, BMI, and systolic blood pressure were identified as the primary predictors across all noise conditions. These findings align with those of previous research, which has identified age, family history of diabetes, waist circumference, BMI, systolic blood pressure, stress, and physical activity level as some of the most significant risk factors [29].
The current findings indicate that predicting FBG status presents significant challenges. Various factors can affect the outcomes. In many of the models we created, the accuracy was relatively low when compared to other metrics. However, metrics such as sensitivity and the AUC were deemed appropriate. This discrepancy may be due to an imbalanced distribution of data across the model’s output classes, with a preponderance of the dataset representing a normal status. To address this imbalance in the output class, we employed random sampling and the SMOTE technique exclusively on the training data. Consequently, the imbalance persisted in the test data, contributing to the models’ reduced accuracy. Additionally, incorporating more features, such as levels of physical activity and stress, could enhance both the accuracy and the validity of the predictions.
The dataset exhibited a smaller number of records pertaining to subjects with abnormal FBG status in comparison to those with normal status. This discrepancy mirrors the lower prevalence of abnormal blood glucose levels within the general population. It is important to note that the quantity of data records within each category can significantly influence the performance of a machine learning model [30].
The lack of validation by an external cohort is acknowledged as a limitation of this study. Validating the model using an independent dataset would enable an assessment of its generalizability to new populations.
It is important to note that including patients with prediabetes affects the interpretation and application of the model. This inclusion likely improves the model’s ability to predict early diabetes risk, but it may reduce its accuracy in diagnosing the current disease state. As a result, the model is most effective when used to identify individuals at high risk who could benefit from preventive interventions, rather than as a diagnostic tool. However, the model’s accuracy in predicting diabetes alone may be lower than that of models that are specifically developed for individuals with diagnosed diabetes. Further research is needed to optimize models for predicting prevalent diabetes, which should involve using larger sample sizes of patients with diabetes. Despite its limitations in diagnosis, this model offers valuable insights into the combination of risk factors for early prediction, which can inform screening and prevention programs.
Acknowledgments
The authors would like to express their appreciation to the Vice-Chancellor of Research and Technology at Iran University of Medical Sciences and Rasool Akram Medical Complex Clinical Research Development Center (RCRDC) for the support of this work. We also thank the staff of the Vice Chancellor for Health of Shahid Beheshti University of Medical Sciences for their good cooperation.
Notes
Conflict of Interest
No potential conflict of interest relevant to this article was reported.