


I. Introduction
Atherosclerosis is a common condition characterized by the buildup of plaque in the arteries [1]. This accumulation can obstruct blood flow throughout the body. Consequently, when atherosclerosis affects the heartŌĆÖs blood vessels, it can lead to coronary heart disease and heart attacks [1]. Cardiovascular disease (CVD) is the primary cause of death globally, accounting for approximately 17.9 million fatalities annually [2]. The Sample Registration System (SRS) 2019 report from the Ministry of Health Republic of Indonesia ranked heart disease as the second leading cause of death, following stroke. Notably, heart disease is a preventable condition [3]. Early detection and prediction, coupled with the ongoing analysis of Electronic Health Records (EHRs) by computational agents and machine learning (ML), are likely to become essential components in the management of patients with atherosclerotic heart disease (AHD) [4]. ML, a subset of artificial intelligence (AI), employs data analysis techniques to discern patterns and predict behaviors [5,6]. Predictive models developed using ML algorithms can assist in identifying patients with AHD and uncover previously unrecognized patterns of risk factors [7].
Numerous researchers have utilized a variety of ML methods to predict cardiovascular disease. One study [8] applied a random forest (RF) algorithm to predict atherosclerosis in China, using data from a retrospective study and statistical analysis. Park et al. [9] developed several ML models, including a classification and regression tree (CART) decision tree and RF, to predict the presence of coronary artery calcification. This was based on retrospective data from 3,302 Korean patients. Fan et al. [10] built ML models, specifically RF, decision tree, and eXtreme Gradient Boosting (XGBoost), to predict asymptomatic carotid atherosclerosis. This was done using EHRs from 6,553 patients in China. Ward et al. [11] employed logistic regression (LR), RF, gradient boosting (GB), and XGBoost algorithms to predict the risk of atherosclerotic CVD in a diverse patient cohort. Lastly, Terrada et al. [12] developed a medical diagnosis method to aid in predicting atherosclerosis in patients, using medical records from 835 patients.
Most previous studies have concentrated on the performance of ML models or the importance of features, with minimal focus on thoroughly understanding and explaining predictions using interpretable methods [8ŌĆō13]. However, in clinical environments, models that are interpretable are generally favored over black box models [14,15]. Consequently, ML methods that are model-agnostic have been developed to identify informative features and interpret them. A model-agnostic interpretation method, such as Shapley Additive exPlanations (SHAP) framework, uses a dataset and various prediction models as inputs, applies these models to the data, and then identifies the characteristics of data features within each prediction model [16].
The objectives of this study were as follows: (1) to develop a predictive model for AHD using an ML approach and hematology EHR data, (2) to interpret the results of this predictive model using the ML approach, and (3) to construct model-agnostic ML methods for identifying informative features and interpreting them. In order to create a predictive model for AHD, we assessed the effectiveness of RF, XGBoost, and AdaBoost models, utilizing hematology EHR data. We chose to investigate RF, XGBoost, and AdaBoost as these algorithms have previously demonstrated potential in predicting CVD [8ŌĆō10,12,13]. Subsequently, we evaluated the performance of each model to determine which one was superior (H1). Given that ML models are often seen as a black box, and that interpretable models are generally preferred in clinical settings, we incorporated interpretability into our ML model. This allowed us to calculate and examine the influence of features on individual and overall predictions, as well as to evaluate informative features and investigate their interpretability and characteristics. To address the hypothesis regarding how to interpret the predictive model and evaluate informative features (H2), we utilized the SHAP framework. This enabled us to further investigate their interpretability and characteristics.
Few studies have sought to answer the same questions posed in our report. We expect that our methodology will establish a foundation for future advancements by offering evidence and setting the stage for subsequent research on computational agents and ML. These tools are capable of detecting, predicting, and interpreting prediction models using EHRs.
II. Methods
1. Ethics and Data Use Agreement
We obtained EHR data for patients with heart disease from the Indonesia National Heart Center Harapan Kita EHR, under the ethical clearance number LB.02.01/VII/520/KEP014/2021. This data spans from 2016 to 2021. It was unclear when the predictors for each patient were extracted from the EHR (i.e., whether it was on the day the patient was initially diagnosed with AHD or on subsequent days).
2. Data Preprocessing
The EHR system houses both clinical and hematological test data for patients. It has stored records for 6,837 patients who have been diagnosed with heart disease by a physician using International Classification of Diseases 9th or 10th revision (ICD-9/ICD-10) codes. Subsequently, we identified the records of patients with AHD using the ICD-9/ICD-10 diagnosis code I25.1, which indicates AHD including coronary artery disease and coronary artery atheroma. We received 4,702 records from patients with AHD and 2,135 records from patients with no AHD. Patients with no AHD were those who did not have an AHD diagnosis.
The data preprocessing phase encompassed data cleaning, data integration, data transformation, and data reduction [17]. The EHR medical record table included several attributes: (1) patient information, which includes registration date, return date, patient name, medical record code, age, room code, laboratory test code, and doctor name; (2) the ICD code and its description; (3) hematology test attributes, which include erythrocytes, hematocrit, hemoglobin, mean corpuscular hemoglobin, mean corpuscular hemoglobin concentration, leukocytes, thrombocyte, age, and sex. Unfortunately, we were unable to include total cholesterol, triglycerides, high-density lipoprotein (HDL), low-density lipoprotein (LDL), complete blood count with differential (CBC), and lipoprotein in our dataset as these were not recorded in our EHR. Data cleaning was the subsequent step, which involved identifying and rectifying errors or inconsistencies in the data, such as missing values and duplicates. In our dataset, we did not find any duplicate values, and we removed the row that contained missing values. After the data cleaning process, we retained 10 features as input variables. We identified eight numerical attributes: erythrocytes, hematocrit, hemoglobin, mean corpuscular hemoglobin, mean corpuscular hemoglobin concentration, leukocytes, thrombocyte, and age, along with two categorical attributesŌĆösex and diagnosis code (ICD code). Data transformation is the process of converting the data into a format suitable for analysis. For the categorical attribute of sex, we converted ŌĆ£femaleŌĆØ to 0 and ŌĆ£maleŌĆØ to 1; for the diagnosis code, we converted ŌĆ£patient with AHDŌĆØ to 1 and ŌĆ£patient with no AHDŌĆØ to 0. We utilized the EHR diagnosis column as the data class label to identify and predict AHD patients. Table 1 displays all predictor attributes and their categorical values. All categorical values were established based on Indonesian medical laboratory testing standards for adults.
3. Machine Learning Algorithms for Detection and Prediction
The prediction experiments utilized RF, XGBoost, and Ada-Boost algorithms. RF is an ensemble of high-performing trees that are amalgamated into a single model. Notably, this algorithm surpasses the performance of the decision tree algorithm [18]. XGBoost, meanwhile, is an optimized distributed gradient boosting library, designed to be highly efficient, flexible, and portable [14]. AdaBoost is an ML approach that was originally developed as an ensemble method to enhance the performance of binary classifiers [19]. A variety of ML techniques used in heart disease prediction are outlined in Table 2 [9,15,19,20ŌĆō23]. The parameter tuning for RF, XGBoost, and AdaBoost is presented in Table 3.
4. Performance Measures
We used a confusion matrix to evaluate the models by deriving the following metrics: true positives, true negatives, false positives, and false negatives [24]. We calculated accuracy, precision, F1-score, and recall. We also calculated the area under the receiver operating characteristic curve (AUC) value. The receiver operating characteristic (ROC) curve is a measure of the predictive quality of a classifier. The optimum position is thus in the plotŌĆÖs upper left corner, where false positives equal 1 and true positives equal 0. The AUC denotes the degree or measure of separability. This shows how well the model can differentiate among classes. A higher AUC means that the model better predicts class 0 as 0 and class 1 as 1 [25].
5. Model-Agnostic Interpretation
ML models are often perceived as black boxes, accepting specific features, and producing predictions. Generally, in clinical scenarios, models that are interpretable are favored over black box models. In a computerized environment, an agnostic approach is one that can operate across various platforms [26].
SHAP is a game-theoretic approach used to interpret the output of ML models. This method ranks attributes based on their contribution to the model, and it can visually display the relationship between these attributes and the results. The absolute value of an attribute signifies its influence, while its positive or negative value indicates the attributeŌĆÖs predictive power for atherosclerotic heart disease. SHAP allows for the calculation of a featureŌĆÖs impact on both individual and global predictions [27]. The modelŌĆÖs g value is calculated using the following formula (1), where p is the number of attributes, z = [z1, z2,ŌĆ”, zp] is a simplification in the input, where z represents the data prediction attributes and is 1, and the unused attribute has a z value of 0. Furthermore, Žåi Ōłł ŌäØ reflects each attributeŌĆÖs contribution to the model [27].
The higher the SHAP value, the greater the positive contribution of the attributes, and vice versa [28].
In our study, we utilized the SHAP model to generate SHAP values for our test dataset. Subsequently, we created a SHAP summary bar plot for global interpretability and a separate bar plot for local interpretability, both pertaining to the prediction model. The steps of our proposed research study are depicted in Figure 1.
III. Results
1. Machine Learning AlgorithmŌĆÖs Performance for Detection and Prediction
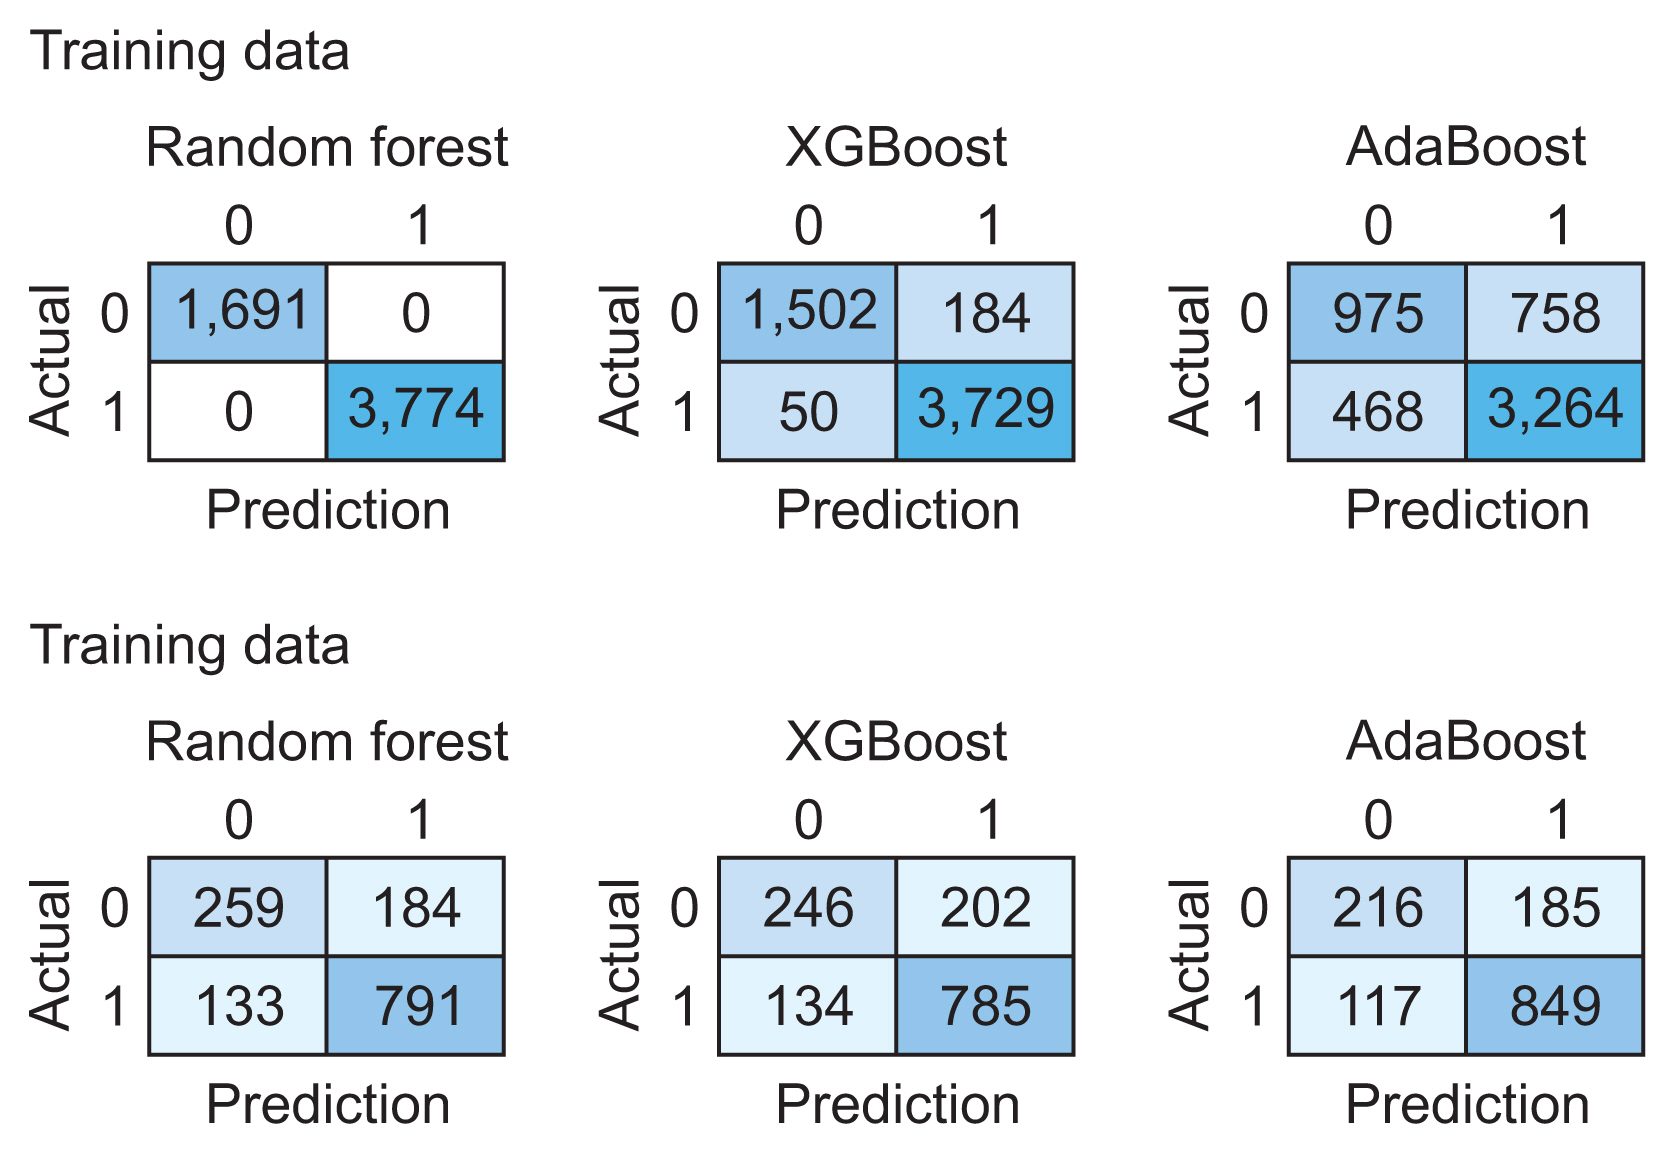
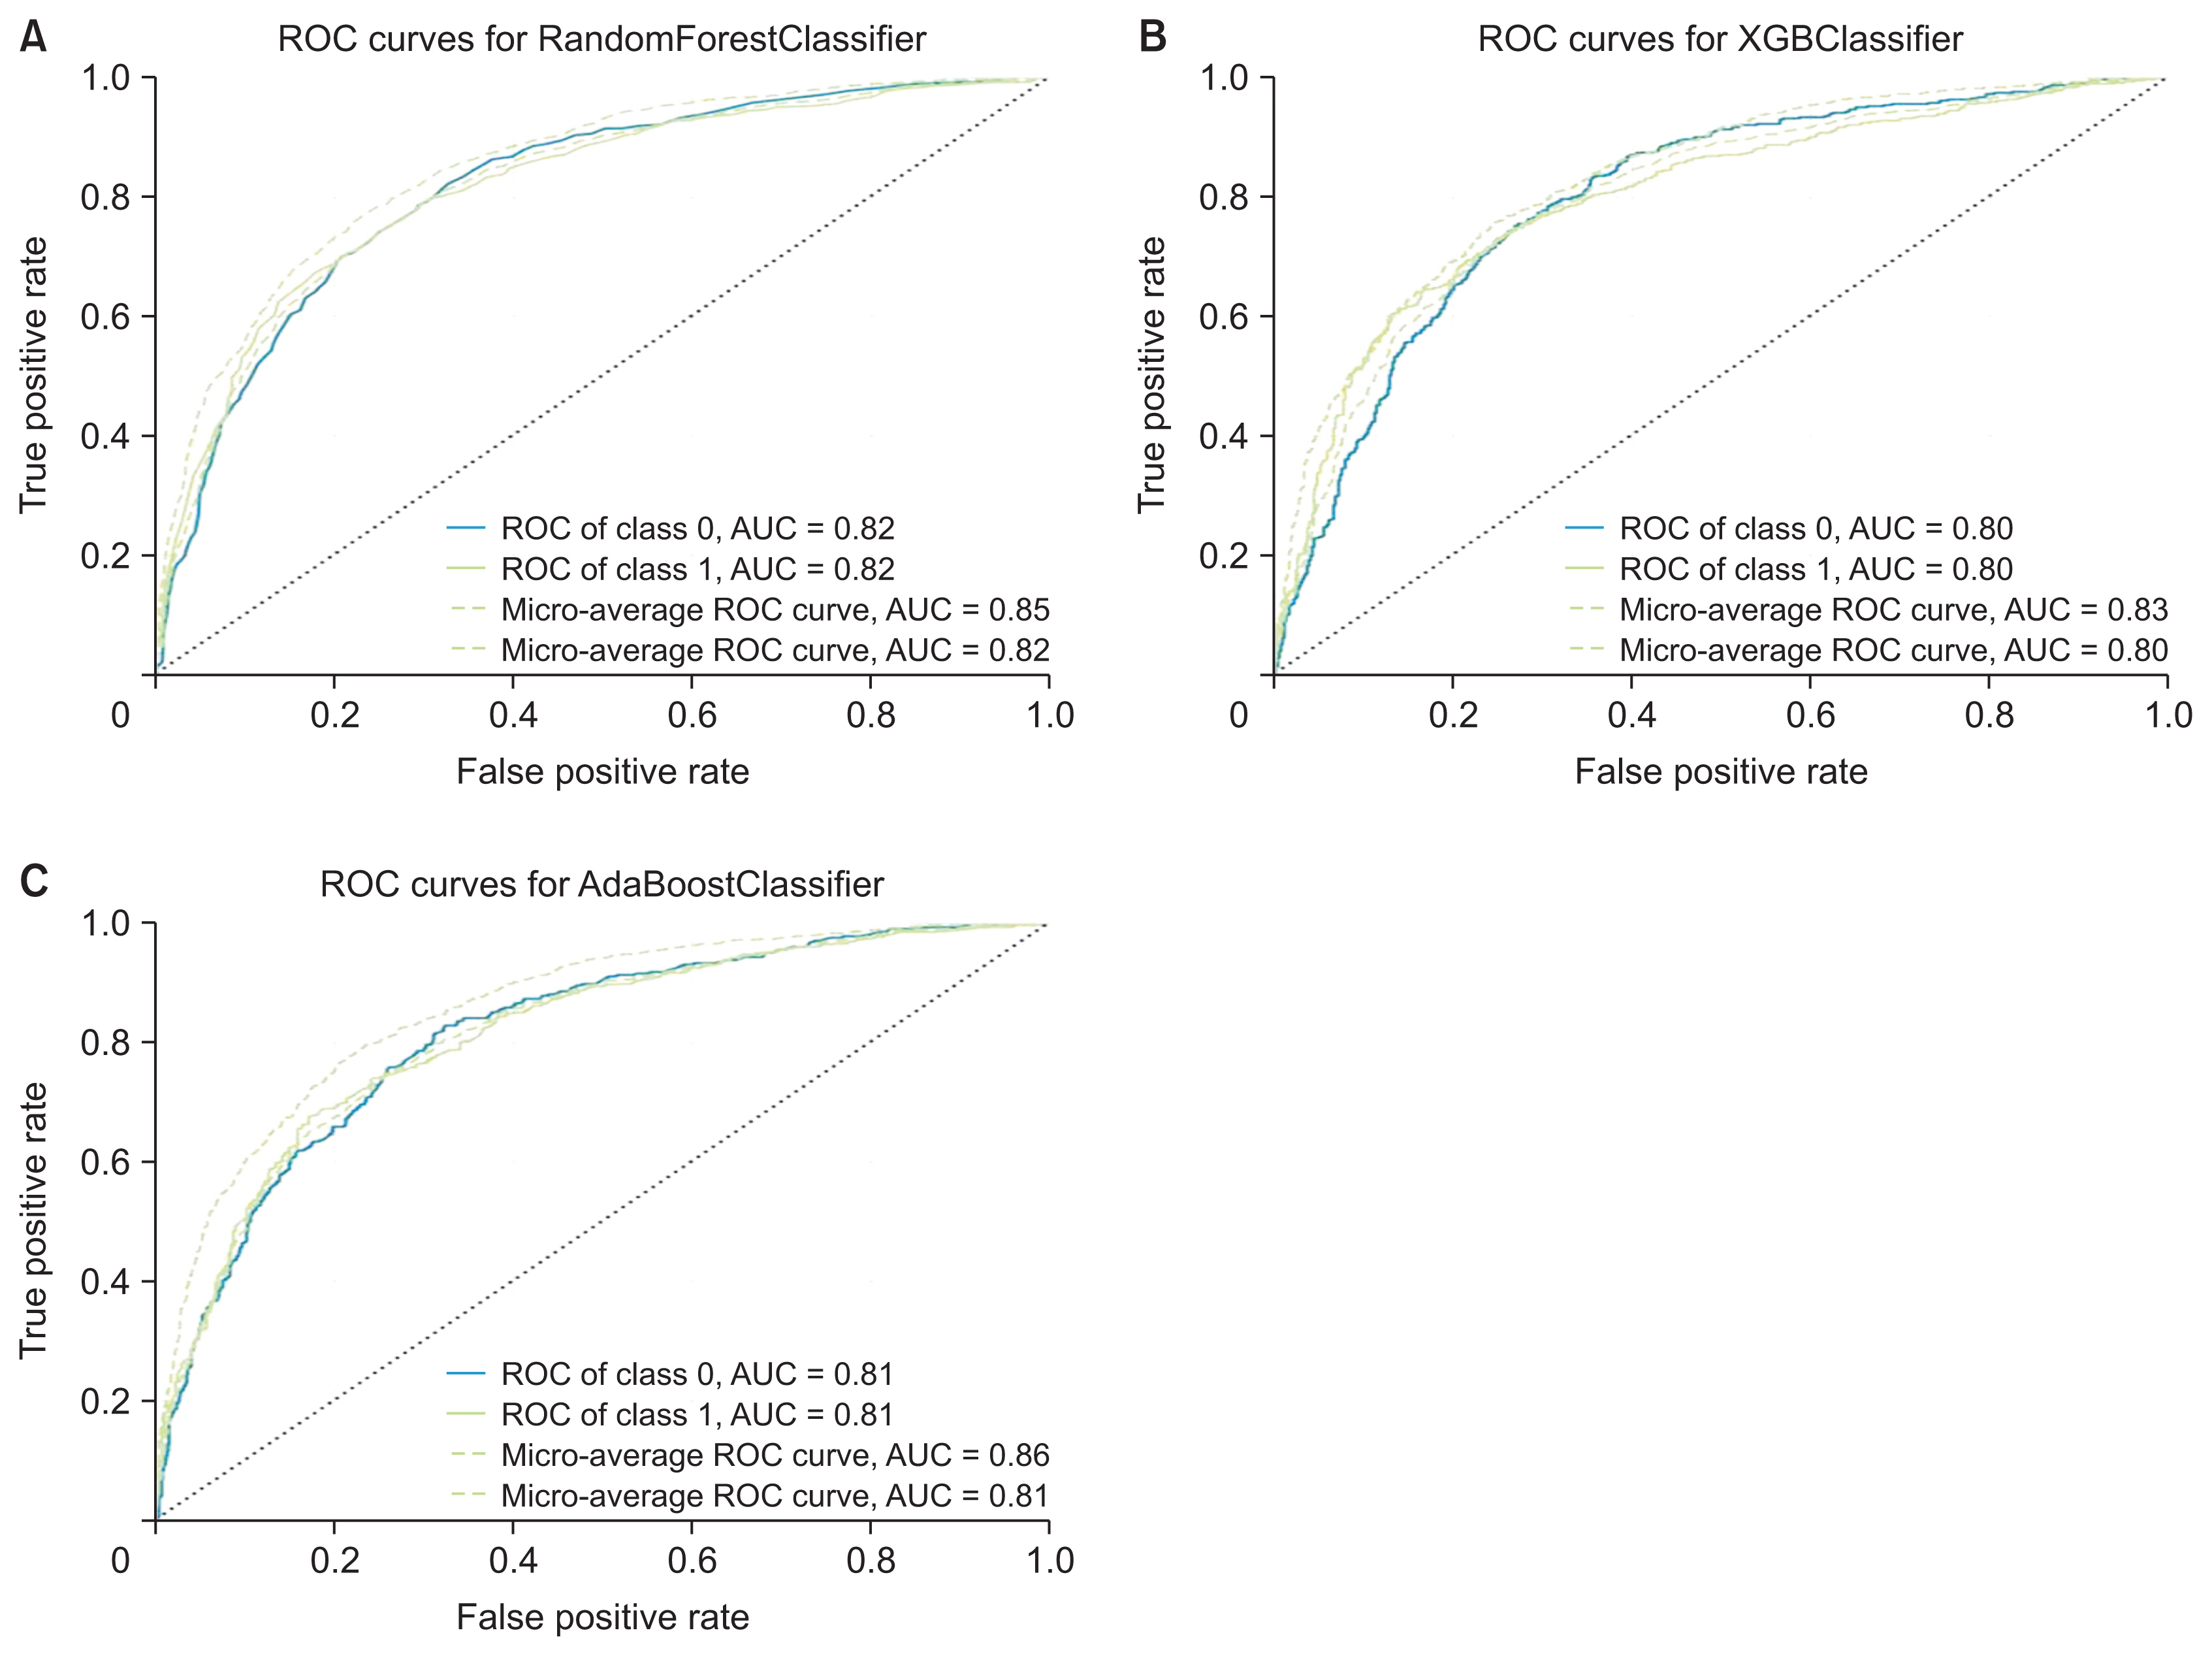
We utilized 6,837 patient records in our study. The diagnosis code was employed as the label in our model. For the ML model to be trained, the dataset needs to be divided into training and testing data [16]. We randomly split the dataset into two parts using the hold-out method, allocating 80% of the data for training (n = 5,470) and the remaining 20% for testing (n = 1,367). Figure 2 presents the confusion matrix of the training and testing data for each algorithm. Table 4 illustrates the performance of RF, XGBoost, and AdaBoost when applied to the test set. Accuracy is a measure of how many positive and negative observations were correctly classified. Precision addresses the question of what percentage of positive identifications were indeed correct. The F1-score is the harmonic mean of precision and recall, and it is not solely based on the accuracy value. Recall addresses the question of what percentage of actual positives were correctly identified [24,25]. Figure 3 showcases the ROC-AUC curve for RF, XGBoost, and AdaBoost. A ROC curve plots the true positive rate on the Y-axis and the false positive rate on the X-axis, both globally and on a per-class basis. The ideal point is located in the upper left corner of the plot, where false positives are 0 and true positives are 1. The AUC quantifies the relationship between false positives and true positives. A higher AUC indicates a better overall model [15].
2. Model-Agnostic Interpretation
Given that AdaBoost surpassed nearly all other classification and prediction metrics, we employed SHAP to elucidate the predictions of a single instance (a patientŌĆÖs record), by determining the contribution of each feature to the predictions. The SHAP Python library was utilized to compute SHAP values and generate charts. We applied both global and local SHAP interpretability to demonstrate the comprehensive contribution of the feature to both global and local interpretability.
A global feature significance plot was generated by inputting a matrix of SHAP values into the bar plot function. This process assigned the global importance of each feature to correspond with the mean absolute value of that feature across all samples. The x-axis represents the average absolute SHAP value of each feature. The features are organized in descending order based on their impact on the modelŌĆÖs prediction. This arrangement takes into account the absolute SHAP value, meaning it is irrelevant whether the feature positively or negatively influences the prediction. Figure 4 presents a global feature importance plot for the AdaBoost algorithm, which was used to detect and predict AHD. This plot was created using a bar type in the Python library. Hemoglobin was the most significant attribute for detecting and predicting arteriosclerotic heart disease in patients, followed by leukocytes, hematocrit, sex, thrombocytes, mean corpuscular hemoglobin, age, mean corpuscular hemoglobin concentration, and erythrocytes.
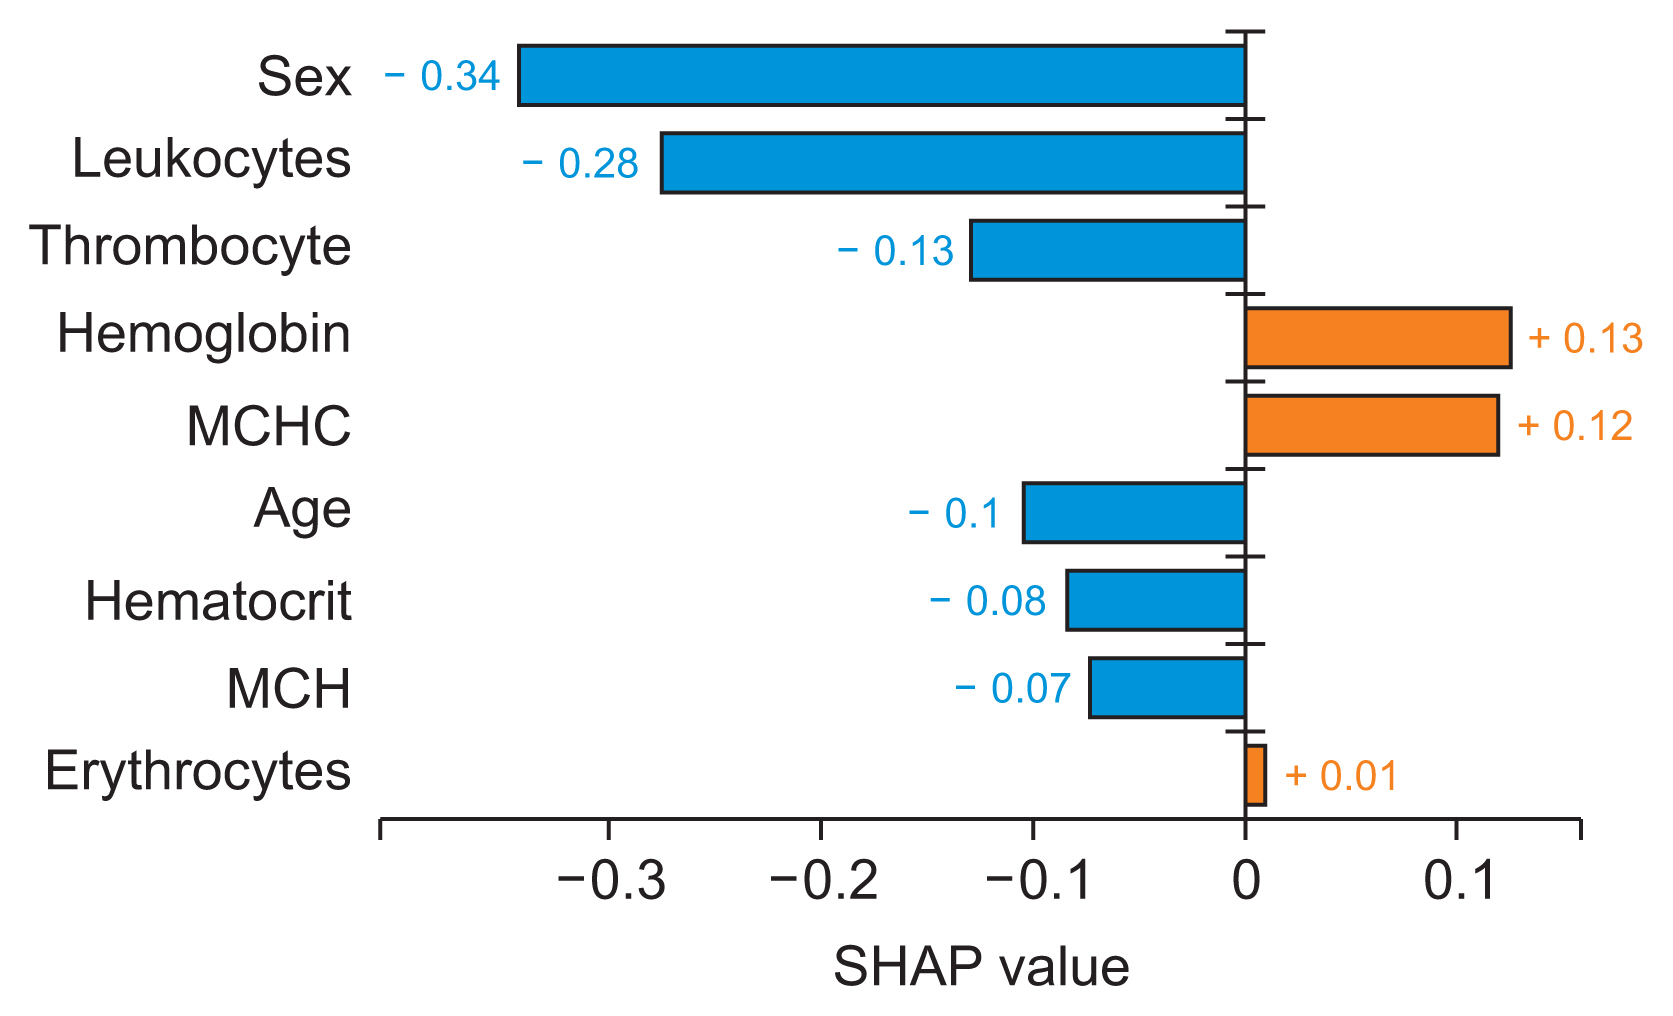
Next, we used the plots of individual data points to evaluate the implications on a case-by-case basis. These plots illustrate the primary features that influence the prediction of a single observation, along with the magnitude of the SHAP value for each feature. The bar plot is zero-centered to emphasize the contributions of different variables. Each bar corresponds to the SHAP value of a particular feature. Positive shifts are represented by red bars, while blue bars denote negative shifts. Figure 5 provides a local interpretation of the AdaBoost algorithmŌĆÖs ability to identify and predict AHD, using a bar plot from the Python library. Hemoglobin and mean corpuscular hemoglobin concentration are indicated by red bars, signifying positive shifts, while leukocyte, hematocrit, sex, thrombocyte, mean corpuscular hemoglobin, age, and erythrocyte are represented by blue bars, indicating negative shifts that affect the prediction of a single observation.
IV. Discussion
1. Findings
In this study, we developed a ML model to predict AHD using EHR hematology data. We evaluated three models: RF, XGboost, and AdaBoost. Our experiment demonstrated that AdaBoost outperformed the other models in nearly all classification and prediction measures (accuracy, precision, F1-score, recall), with the exception of AUC, where it ranked second, slightly below the AUC value of RF (H1). Given that AdaBoost surpassed RF and XGBoost in almost all classification and prediction measures, we employed SHAP analysis to uncover insights and patterns that were not readily discernible from the initial AdaBoost features. A global interpretability analysis using the SHAP summary_plot method with a bar plot type revealed that hemoglobin is the most critical attribute for detecting and predicting AHD patients. This was followed by leukocyte, hematocrit, sex, thrombocytes, mean corpuscular hemoglobin, age, mean corpuscular hemoglobin concentration, and erythrocytes (H2). In addition to examining the global trends in feature impact, we also used the local interpretability SHAP bar plot method to explore the contribution of individual features to individual predictions. In this context, hemoglobin and mean corpuscular hemoglobin concentration (represented by the red bar) had a positive impact, while leukocytes, hematocrit, sex, thrombocytes, mean corpuscular hemoglobin, age, and erythrocytes (represented by the blue bar) had a negative impact on the AHD prediction of a single observation (H2).
The clinical implications of our research are as follows: (1) For interpretation and prediction, we processed complex, heterogeneous data from EHR to predict patients with AHD. This enhances our understanding of the patientŌĆÖs condition. (2) For comprehension, we interpreted the prediction model and evaluated informative features. We also investigated their interpretability and characteristics with the aim of explaining the predictions of an instance (patientŌĆÖs record). This was achieved by calculating the contribution and impact of each attribute to the predictions. (3) For decision support, we utilized the previous steps to predict clinical outcomes. Our findings indicated that hemoglobin was the most crucial feature for detecting and predicting AHD patients, as evidenced by the SHAP value. Both hemoglobin and mean corpuscular hemoglobin concentration demonstrated positive shifts in predicting a single observation. Previous research has corroborated some of our findings, thus validating our approach to evaluating informative features of the ML prediction model and investigating their interpretability and contributions to prediction. Lee et al. [29] and Goel et al. [30] concluded that both low and high hemoglobin concentrations were associated with increased cardiovascular and all-cause mortality. This aligns with our finding that hemoglobin has a positive impact on individual predictions of AHD.
The technical implication of our research is that we uncovered trends that have seldom been investigated before. Most prior studies have concentrated on the performance of ML models or the importance of features, with little focus on fully understanding and explaining predictions using interpretable methods. In clinical settings, interpretable models are often favored over black box models [26]. Previous research has explored RF, XGBoost, and AdaBoost for heart disease prediction, yielding better results than ours. A previous study [21] utilized RF and achieved ROC-AUC of 0.802, but it involved a small sample size of 498 subjects. Another study [15] employed XGBoost and achieved a prediction accuracy of 91.8%. Furthermore, yet another study [19] used Ada-Boost and achieved a prediction accuracy of 100%. However, these studies did not employ interpretable methods for ML to understand and explain prediction results, an aspect that was addressed in our study.
Finally, our proposed ML model, along with the interpretability model, holds promise as tools for detecting and predicting AHD patients, as well as elucidating the prediction results. Our study was not designed as a prospective investigation observing disease progression over time. Instead, our proposed methodology involved a post-hoc analysis of hematological EHR data, from which we sought to extract valuable information. Utilizing this information, we constructed a prediction model for arteriosclerotic heart disease, in addition to a machine-learning agnostic model, both based on ML techniques.
2. Limitations
This preliminary study aimed to understand and explain predictions made by ML models using an interpretable method. Our research indicates that ML has significant potential to enhance clinical investigation. One of the primary challenges for ML approaches in interpreting results is the extraction of meaningful concepts and attributes from raw data and datasets. This includes building prediction models, understanding and evaluating the performance of these predictions, and interpreting the results of these predictions. At present, our study only utilized structured data from hematology EHRs and excluded information from a variety of tests used in diagnosing heart conditions. Blood tests that record characteristics such as total cholesterol, triglycerides, HDL, LDL, CBC, and lipoprotein could be considered comprehensive attributes for model prediction in future studies. These tests are used to determine the risk of CAD. In future research, we need to expand the ML model used in this study and acquire different comprehensive attributes. These attributes should contain additional information about the patientŌĆÖs medical tests that may contribute to AHD. This will enhance the performance of our proposed prediction model. Furthermore, the impact of the directionality of the features that demonstrated the significance of a feature, and whether it has a positive or negative impact on prediction, should be validated with future medical research.