


I. Introduction
Adverse drug reactions (ADRs) are a significant concern for public health, as they can cause hospital admissions and rank among the leading causes of death [1,2]. According to the Food and Drug Administration, the number of ADRs has been steadily increasing over the years, tripling from 2006 to 2014 [3]. Drug-induced liver injury (DILI), in particular, stands out as one of the primary reasons underlying ADRs in real-world treatment, significantly affecting patient safety and drug development [4,5]. Despite the importance of predicting DILI risk for ensuring safety, adverse hepatic effects on health remain unpredictable, and there is insufficient evidence to support risk factors for DILI resulting from medications [4,6].
Therefore, many researchers have focused on identifying the early hepatotoxic risk for future intervention using artificial intelligence (AI) and big data [4,5,7]. A study of Jaganathan et al. [4] presented an accuracy of 0.811 using a molecular-level support vector machine in 2021. Chen et al. [7] developed a multi-source-based prediction model using the ResNet-18 deep neural network. However, these studies had two main limitations. One is an insufficient standardized multicenter validation study, which would obtain more reliable results through acceptable validation. Due to the risk of leaking patient information and many laws related to protecting patient information, multicenter studies encounter some hurdles. The other limitation lies in the black-box nature of AI. Most research has utilized conventional statistical methods or deep learning techniques [4,5,7]. Although the performance of these methods is sufficiently high, the prediction results lack explainability, which is a necessary component for clinical implementation. The absence of explainability makes it difficult to implement models in clinical environments.
Multicenter research has been conducted using many standardized models such as Patient-Centered Outcomes Research Network, National Institute Health Common Data elements, and Observational Medical Outcomes Partnership (OMOP) Common Data Model (CDM) [8–10]. CDM-based studies showed effective results due to the advantage of having an optimized data structure and terminology system for multicenter studies. OMOP-CDM is superior to other CDM models in terms of content coverage, integrity, and integration. Most medical center data have been converted into OMOP-CDM [11]. Furthermore, in 2016, the US Food and Drug Administration (FDA) Sentinel, a specialized system for drug surveillance [12], was initiated. While research using this system has been conducted on specific areas such as pharmacoepidemiology and hemorrhage in the USA, its application for DILI has not been explored [13].
In terms of model explainability, several techniques such as grad-cam, Shapley values, and partial dependent plots have been suggested [14–16]. However, most of these methodologies were primarily designed for image or tabular data. The interpretability multivariate long short-term memory (IMVLSTM) model was recently published, which considers time-based explanations [17]. To the best of our knowledge, there has been no application of time-based explanations in DILI research.
To address these research gaps, we developed and validated a multicenter-based explainable time-series AI model for predicting DILI using data from six hospitals in Korea.
II. Methods
1. Study Design
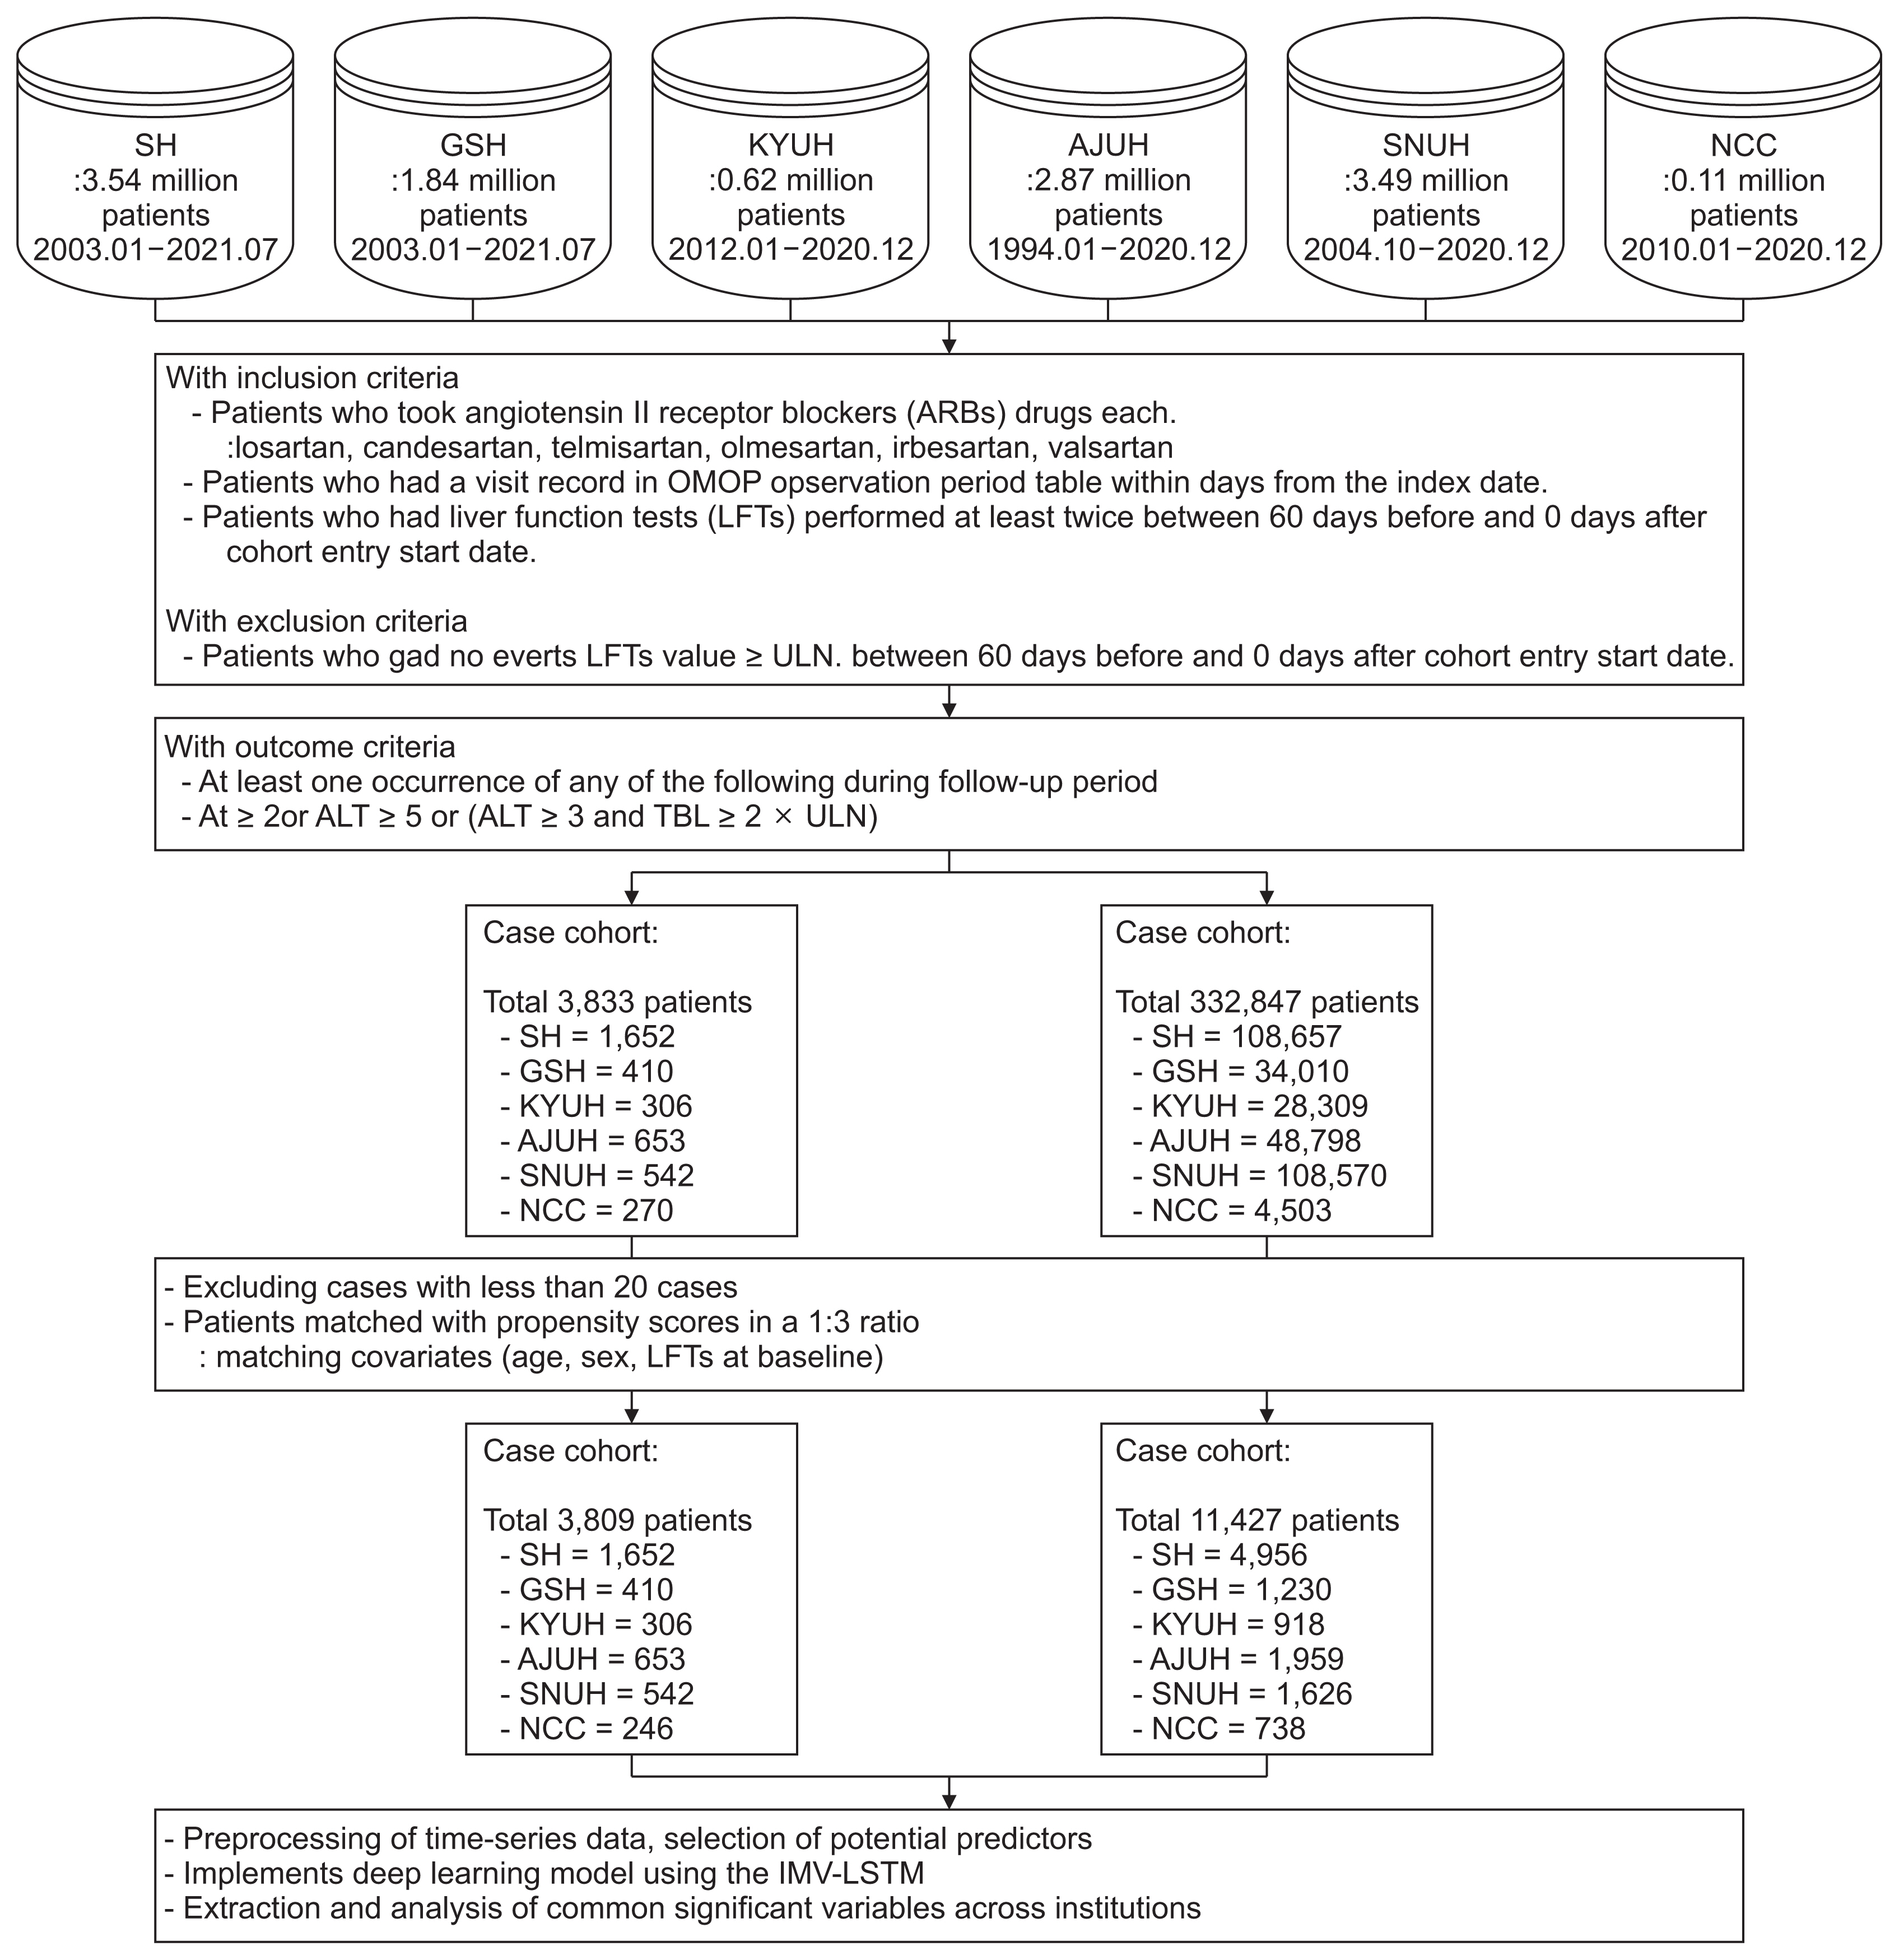
This study is a retrospective cohort analysis using a standardized CDM of Electronic Health Records (EHRs) from six hospitals in South Korea to predict DILI. The data sources include Severance Hospital (SH), Gangnam Severance Hospital (GSH), Konyang University Hospital (KYUH), Ajou University Hospital (AJUH), Seoul National University Cancer Hospital (SNUH), and the National Cancer Center (NCC). The study utilized OMOP-CDM version 5.3.1. In order to identify risk factors for DILI, we constructed cohorts based on each hospital and drug. The distributed research networks (DRNs)’s based on CDM encompassed a vast population of approximately 12.47 million individuals from 1994 to 2021. From this extensive dataset, we curated a final cohort consisting of 15,236 subjects, comprising 3,809 cases and 11,427 controls. The detailed study design can be found in Supplementary Table S1.
This study was approved by the Institutional Review Committee of Severance Hospital (No. 4-2021-1209), Gangnam Severance Hospital (No. 3-2021-0005), Konyang University Hospital (No. KYUH 2021-10-003-001), Ajou University Hospital (No. AJIRB-MED-MDB-21-676), Seoul National University Cancer Hospital (No. E-2207-151-1342), and the National Cancer Center (No. NCC2022-0184).
2. Definition of Drug-Induced Liver Injury
In this research, we employed criteria for defining DILI classification stages that align with the “injury” category. These were: (1) an alanine aminotransferase (ALT) elevation ≥5 times the upper limit of normal (ULN), (2) an alkaline phosphatase (ALP) elevation ≥2 times the ULN, or (3) an ALT ≥3 times the ULN accompanied by a total bilirubin concentration above 2 times the ULN [16].
3. Cohort Definition
This study aimed to predict DILI by focusing on six selected drugs in the category of angiotensin II receptor blockers (ARBs): losartan, candesartan, telmisartan, olmesartan, irbesartan, and valsartan. These specific drugs were carefully selected from a pool of eight ARBs commonly reported in the literature and frequently encountered in hospitals [18,19]. In addition, a drug was selected as a target drug if at least 20 cases of DILI were recorded in the six hospitals participating in the study (Table 1).
For the case cohort, we included patients who had been administered any one of the six ARBs. The index date for this target cohort was determined as the initial administration date of the ARBs. Initially, we included patients who met the criteria for DILI within 60 days after the index date. The control cohort was defined as patients who did not exhibit DILI within 60 days after the index date. To minimize confounding factors compared to cases, we performed propensity score matching (PSM) using the K-nearest neighbor algorithm based on age, sex, and baseline liver function tests (LFTs) at the time of enrollment, maintaining a 1:3 ratio between controls and cases. The LFTs utilized in the matching process included aspartate aminotransferase (AST), ALT, ALP, and total bilirubin (TBL). The inclusion criteria mandated that the visit record be at least 30 days prior to the index date, with the patient having undergone at least two LFTs within 60 days preceding the index date during the pre-observation period. Exclusion criteria encompassed cases where the measured LFT value exceeded the ULN value. To provide an overview of the cohort construction process, we have presented a diagram in Figure 1. For accessibility, the cohort definitions created in ATLAS are available as JSON files on GitHub [20].
4. Candidate Predictors for the Time-Series
In this study, we extracted candidate predictors from various domains within the OMOP-CDM by querying per-patient observational data using Python’s SQL query tools. Candidate variables were selected from all concepts used in the person domain of the CDM (sex, age), and in four main domains: measurement, drug exposure, condition occurrence, and procedure occurrence. We handled laboratory tests as continuous variables and the rest as dichotomous variables. To select the predictors, we conducted statistical tests to assess the significance of the difference between the cohort’s enrollment time and the onset date of DILI. For continuous variables, we employed the paired t-test, while for dichotomous variables, we used the McNamar test. To organize the data in a time-series format, we created a table where the candidate variables were pivoted into columns and dates were represented in rows. Missing values were handled by forward-filling for laboratory test values and diagnoses, and zero-filling for medications and treatments. To predict DILI, the data were split over a 4-week window size of the sequential data with a 2-week shift into the prediction period.
5. DILI Prediction Modeling
For DILI prediction modeling, we utilized an advanced LSTM model called the IMV-LSTM module. This model is designed to predict and interpret multivariate time series data [16]. As illustrated in Supplementary Figure S1, we introduced the IMV-LSTM model, which enhances the conventional LSTM model by considering the temporal aspect of each variable. This model utilizes multivariate time series data to expand hidden states for each variable, enabling the computation of variable attention and temporal attention scores. These scores reflect the importance of both variables and time in the model’s interpretation.
For DILI prediction, independent datasets were meticulously curated for each drug within each hospital. Subsequently, these datasets were partitioned into training, testing, and validation sets, maintaining a balanced distribution of 6:2:2. The training process encompassed training each model for 200 epochs, adopting a batch size of 64 and a learning rate of 0.001. To mitigate overfitting, we implemented early stopping using the Adam optimizer after 20 epochs. The performance evaluation of each model was conducted based on the area under the receiver operating characteristic curve (AUROC) value on their respective internal test sets. Additionally, supplementary metrics such as accuracy, precision, F1-score, and the area under the precision-recall curve (AUPRC) were also presented to provide a comprehensive assessment of model performance.
In this study, DILI prediction models were created for each hospital and drug, and each model had a different selection of candidate variables. To interpret the predictors in each model, variable-wise attention scores and temporal-wise attention scores were extracted from all trained models. These scores were then aggregated by calculating an overall temporal attention score, which was obtained by taking a weighted average of the temporal attention value over the variable attention value for each predictor variable. The resulting scores were plotted as a heatmap for interpretation.
After assembling the cohort from individual institutions through the DRNs, the execution code utilized by the primary hospital, which was publicly available on GitHub [20], was shared with each participating hospital. Subsequently, the code was executed, and only non-sensitive results were obtained and consolidated.
III. Results
1. Demographic and Clinical Characteristics
In this study, a total of 336,680 patients were included in the cohort across six institutions. Among them, 3,833 patients were identified as experiencing DILI, resulting in an overall incidence rate of 1.15% for all ARBs. Among the drugs, losartan (1.30%) had the highest incidence rate, followed by valsartan (1.28%), candesartan (1.21%), irbesartan (1.07%), telmisartan (1.0%), and olmesartan (0.85%). Regarding the incidence by hospital, NCC had the highest incidence (6%), followed by SH (1.52%), AJUH (1.34%), GSH (1.21%), KYUH (1.08%), and SNUH (0.5%). However, olmesartan (14 cases) and irbesartan (10 cases), with fewer than 20 case samples in the NCC, were excluded from the analysis.
2. Model Performance
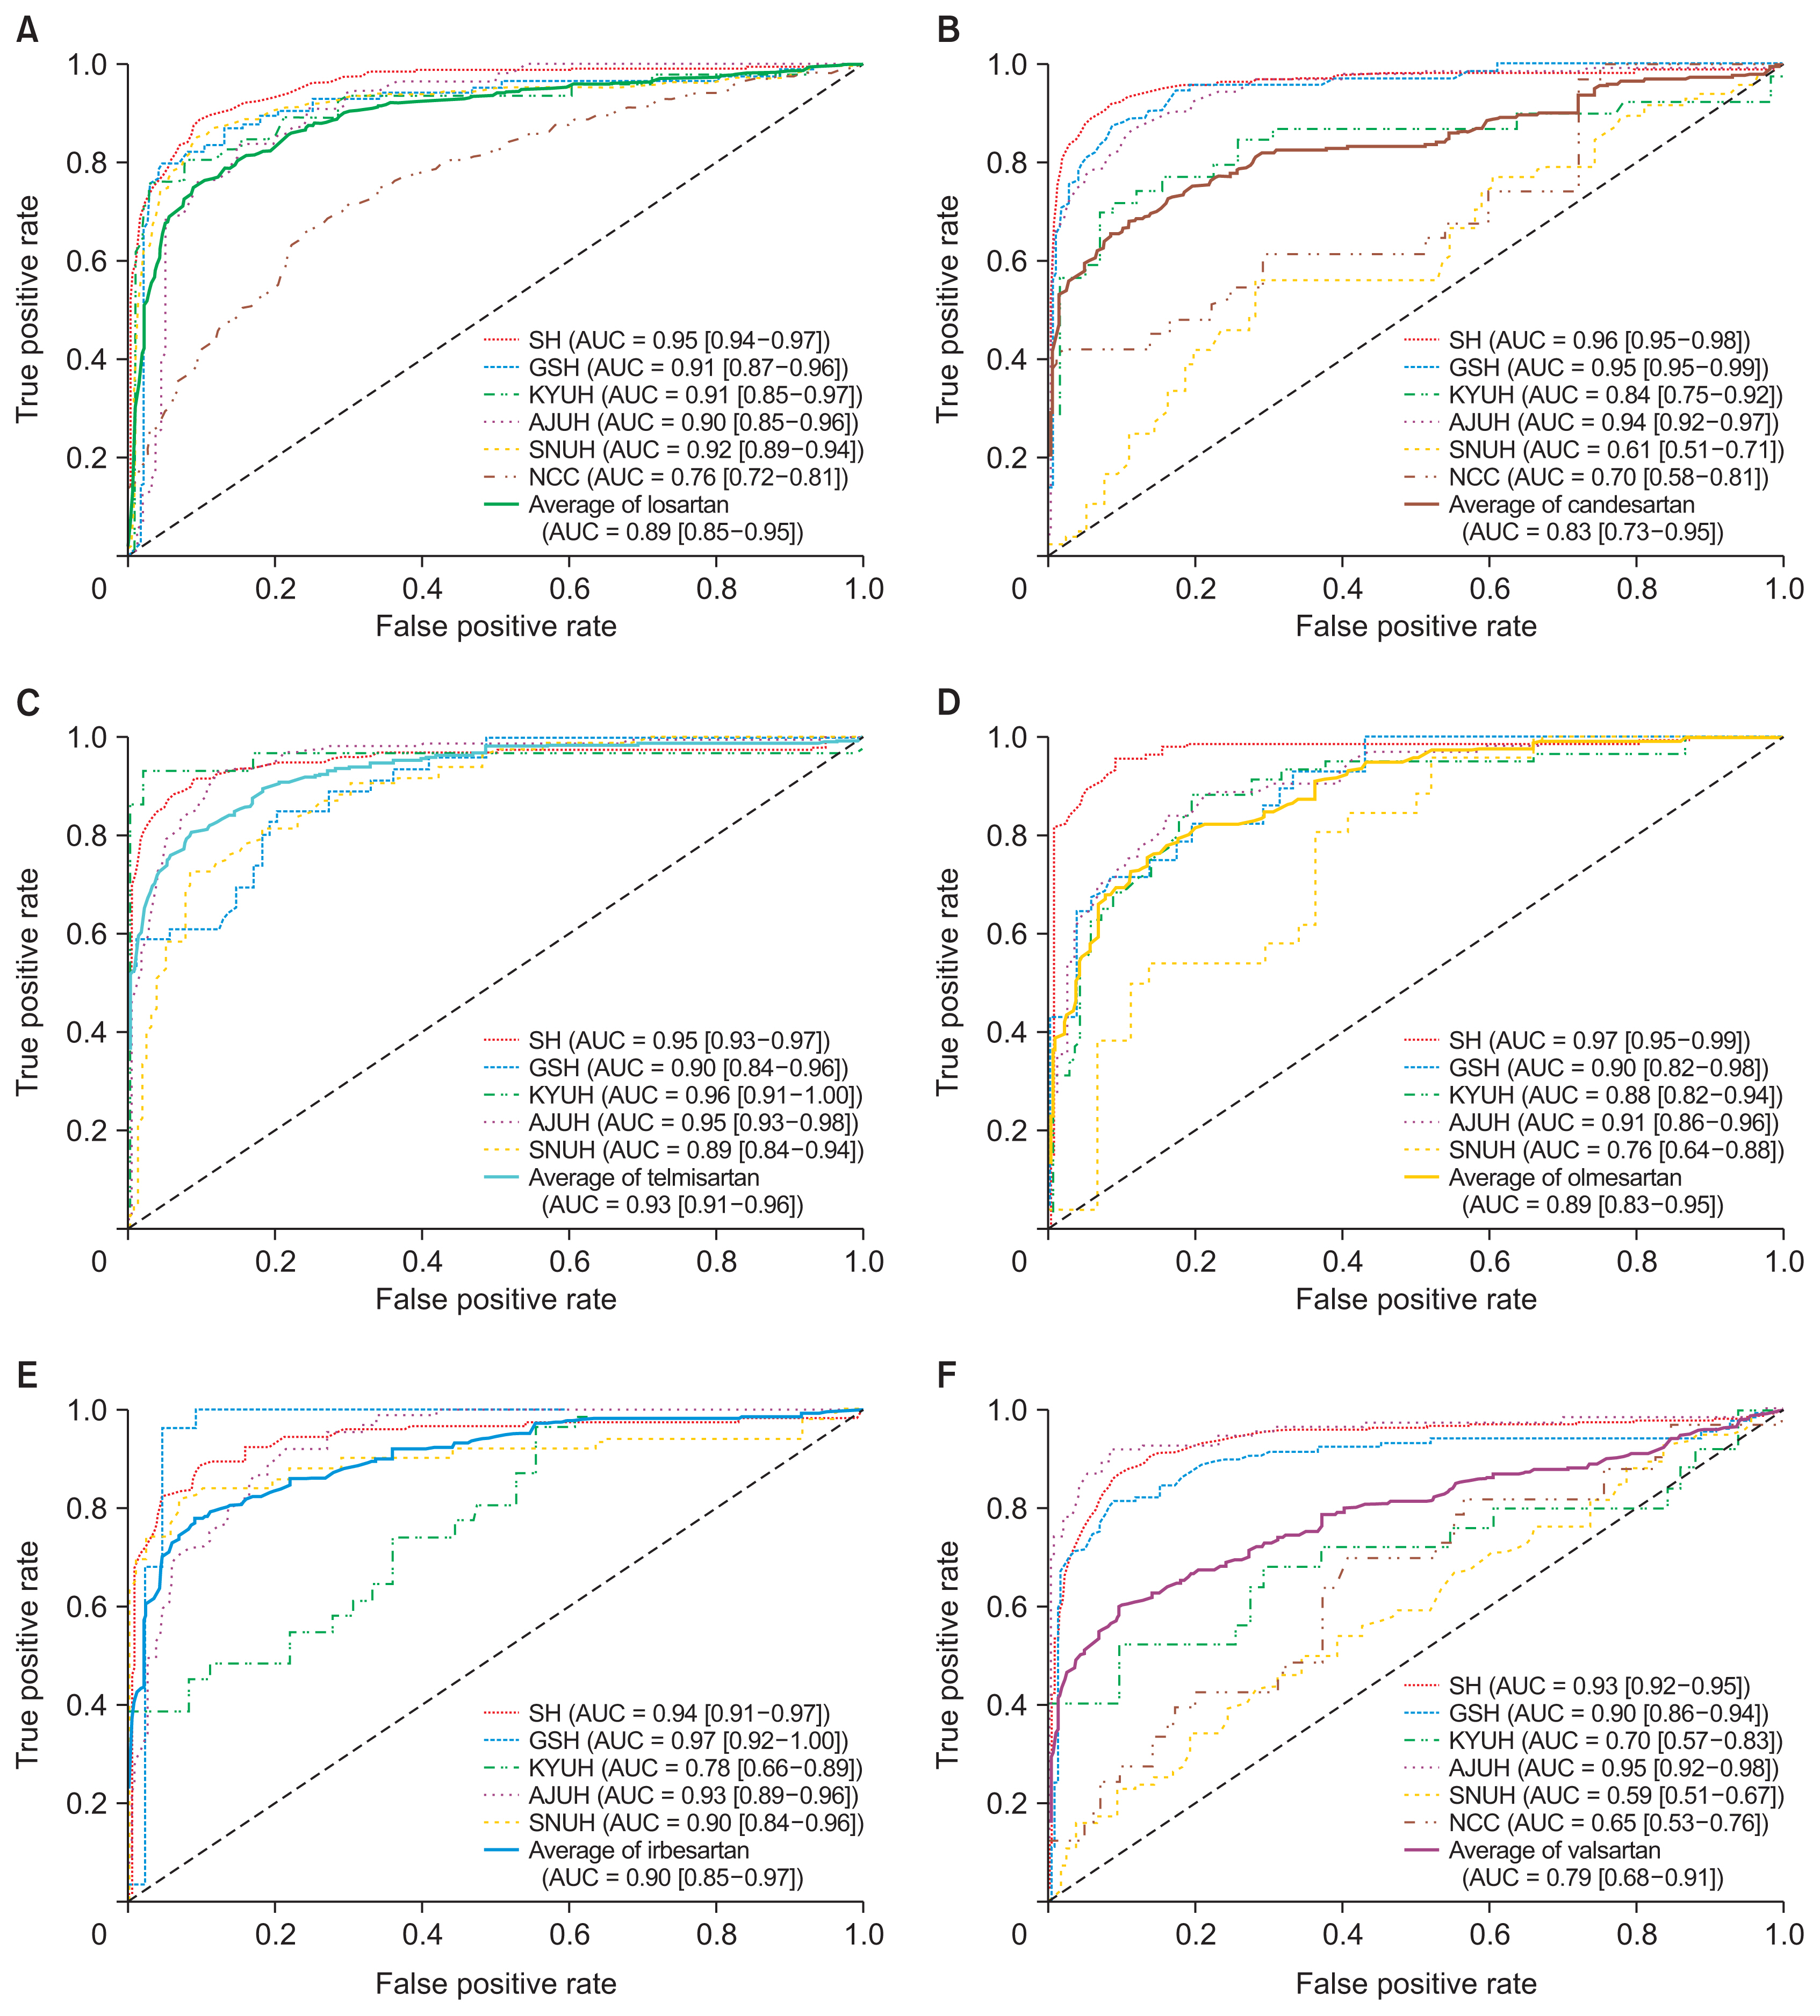
To evaluate the DILI predictive model, the AUROCs for each drug and each hospital are shown in Figure 2. Telmisartan had the highest average AUROC (0.93; 95% confidence interval [CI], 0.91–0.96), followed by irbesartan (0.90; 95% CI, 0.85–0.97), losartan (0.89; 95% CI, 0.85–0.95]), olmesartan (0.89; 95% CI, 0.83–0.95), and candesartan (0.83; 95% CI, 0.73–0.95]), with valsartan having the lowest average AUROC (0.79; 95% CI, 0.68–0.91). The results indicate distinct variations in drug performance across different hospitals. For example, candesartan had the highest AUROC at SH (0.96; 95% CI, 0.95–0.98) but the lowest at SNHU (0.61; 95% CI, 0.51–0.71). Irbesartan showed the highest performance at GSH (0.97; 95% CI, 0.92–1.00) but the lowest performance at KYUH (0.78; 95% CI, 0.66–0.89).
To confirm the robustness of the DILI prediction model, additional performance metrics were calculated for the trained models. These metrics are shown in Table 2, with an overall average AUPRC of 0.76, an F1 score of 0.71, an accuracy of 0.85, and a precision of 0.79. Telmisartan at KYUH had the highest AUPRC value (0.95), followed by candesartan and olmesartan at SH (0.91). However, there were some poorly trained or overfitted models based on the F1-score, including candesartan at SNUH (0.17), valsartan at SNUH (0.12), and valsartan at NCC (0.23).
3. Aggregated Attention Scores of the DILI Prediction Model
In order to interpret the DILI prediction model, we demonstrated each contributor variable’s temporal attention values, which were weighted aggregations from the model for each institution and drug (Figure 3). The last week of hematocrit (0.36) showed the highest attention scores, followed by albumin (0.34), hypertensive disorder (0.33), prothrombin time (0.32), lymphocytes (0.32), and cholesterol (0.3). These variables displayed an increasing trend in their attention scores. In addition, the temporal pattern was verified by visualizing the distribution of the actual data of the matching variables. The attention scores for all variables across all hospitals are presented in Supplementary Table S2.
IV. Discussion
In this study, we developed and validated a DILI prediction model using IMV-LSTM for considering time-based explanations, using data from six hospitals based on a CDM for a multicenter study without data transfer. We confirmed the association between ARBs and DILI, consistent with previous literature reporting an incidence rate of less than 2%. We also observed subtle differences in the occurrence rates among different ARB drugs. The time-series-based learning model achieved a high average AUROC value of around 0.9, indicating excellent predictive performance. A comprehensive interpretation of the trained models highlighted the significant impact of indicators such as hematocrit, albumin, hypertensive disorder, prothrombin time, and lymphocytes, which are increasingly highlighted from 4 weeks to 1 week prior to the occurrence of DILI. However, considering the influence of other biases, further examination is necessary. This study holds significance as it adopted the protocol used in the FDA Sentinel for clinical post-marketing surveillance purposes and adapted it to the DRN setting, which is operated by national agencies [21]. This aligns the study with established protocols and enhances its applicability for real-world monitoring of drug safety.
A multicenter study requires a standardized process and terminological system. We used the most common and major DILI ADR terminology set and protocol, which can be a cornerstone for further research. Moreover, we shared the defined SQL query, specification documentation, and ATLAS definitions on GitHub. Finally, we have distributed open-source packages for the public to contribute to DILI research.
There have been few multicenter-based studies on this issue. To the best of knowledge, this is the first multicenter and national-level study using a CDM for DILI prediction, which is important for reliability, providing more significant results with big data and protecting patients’ private information from leaking. In particular, we adopted a time-related attention mechanism to reveal the importance of variables at each time point. Explainability is one of the essential components for clinical implementation, and our study results can provide patient-level explanations, which is a strong point for future applications.
Nonetheless, there are some limitations of our study. Firstly, the overall incidence of DILI was relatively low, being less than 2%. Despite this limitation, we employed PSM and utilized multicenter data to enhance the robustness and validity of our analysis. Secondly, the CDM had certain limitations in terms of the coverage and granularity of specific DILI-related features. As a result, we may not have been able to consider a wide range of variables that could potentially contribute to the prediction of DILI. Despite these limitations, our study provides valuable insights into the prediction of DILI in patients taking ARBs by leveraging multicenter data and utilizing a comprehensive time-series deep learning approach. Future research could advance our understanding of DILI and ability to predict DILI by implementing federated learning and utilizing multi-institutional DRNs at the national level.