

I. Introduction
A gene expression profile provides a snapshot of the transcriptional level in a cell under specific conditions. It is widely used in biological analyses, including identification of genes that show expression patterns associated with certain phenotypes, identification of molecular markers that can be used to diagnose a disease state, and inference of the regulatory relationships of genes corresponding to a biological process [1]. The representative way to analyze an expression profile is to identify differentially expressed genes (DEGs) or co-expressed genes related to certain phenotypes. In addition, researchers can also compare expression patterns of profiles with those of other profiles. This comparison can provide an alternative way to query large-scale gene expression repositories, such as the Gene Expression Omnibus and ArrayExpress, in a content based manner [2-5]. To support comparison of expression patterns, various expression similarity search methods have been devised.
Since the advent of the Connectivity Map [6], which provides large-scale libraries of expression profiles corresponding to human cell lines treated with diverse small molecules, the usage of expression similarity search has been extended to drug discovery and development. The Connectivity Map also provides a comparison method to measure similarities between a query gene signature and these reference profiles. To measure the similarity, a query gene signature comprising up- and down-regulated genes from the user is required. The Connectivity Map calculates the score of each reference profile by estimating whether the up-regulated genes exist at the top of the reference profile and whether the down-regulated genes exist at the bottom of the reference profile. The usefulness of the dataset and comparison approach is proved by the performance of case studies related to drug repurposing, unveiling of the mechanism of action of uncharacterized small molecules, the mimicry of a certain biological state, etc. This innovative approach has led to the development of diverse methods to large-scale analysis of drug response profiles [7-12]. Although these variant methods have adopted different pattern matching approaches to measure similarity, the major concept of similarity measurement, which is the use of the up- and down-regulated gene signature from the query profile, is still commonly used.
Co-expressed gene sets can be identified from drug response profiles using clustering methods [13]. In clustering, it is assumed that the expression patterns of co-expressed gene sets are correlated in all conditions. Alternatively, biclustering can be used to search gene sets that are correlated in a subset of the conditions [14]. Significantly perturbed or newly generated co-expressed gene sets from a drug response profile can be more appropriate to explain the expression states of cells treated with a certain drug. Several studies have identified differentially co-expressed genes known to be involved in cancer, even though their expression levels were not significantly changed [15-17]. For such reasons, genes with differential co-expression patterns can be another valuable signature to characterize drug treatment profiles in addition to DEGs.
In this paper, we propose a novel method to measure the similarities between drug response profiles by combining DEGs and dilated cardiomyopathy (DCMs) simultaneously. Our method shows significant performance improvement in comparison to other approaches in a test with Connectivity Map data. We construct a drug-drug network using our method and find well clustered drugs having the same target proteins. Using the proposed method, drug-associated collaborative cellular mechanisms can be identified as well as drugs having similar gene expression responses.
II. Methods
1. Construction of Drug Dataset
The drug response data was downloaded from the Connectivity Map website (http://www.broadinstitute.org/cmap/). It contains 6,100 gene expression profiles of 5 cell lines treated with 1,309 distinct small molecules. The expression profiles were grouped by batch ID, and then each group was normalized by robust multi-array average. After the extraction of expression values from each experiment, they were merged into a single matrix. The merged expression profiles were further processed with limma package to normalize the expression intensities between different arrays using R [18].
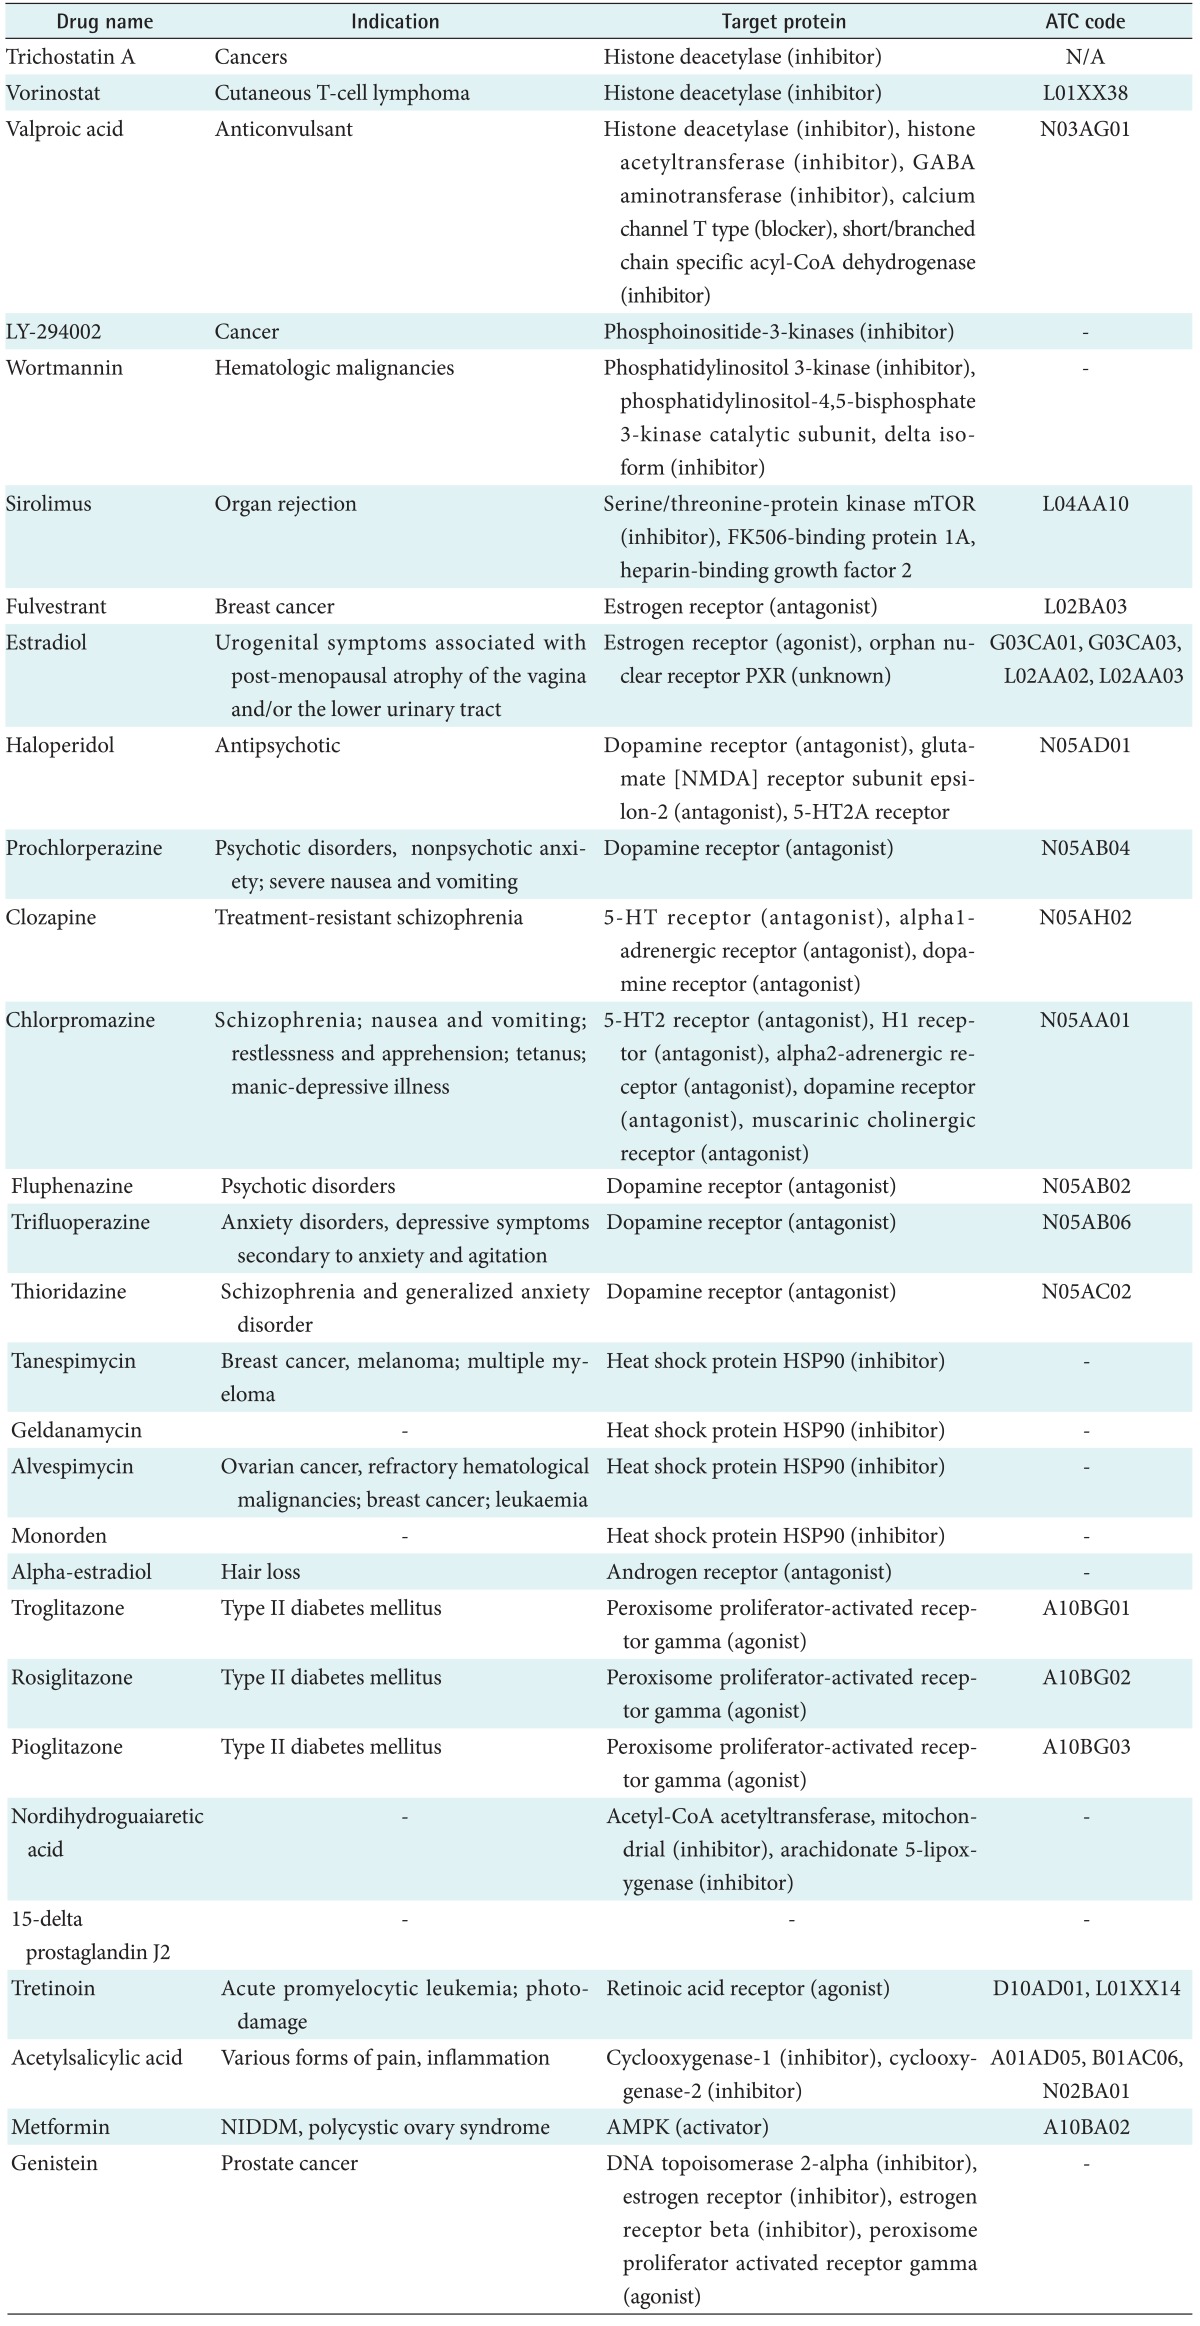
Among the 5 cell lines, we used 3 cell lines (PC3, human prostate cancer cell lines; MCF7, human breast adenocarcinoma cell line; HL60, human promyelocytic leukemia cells) for this study because only a few experiments had been performed with the other two cell lines (SKMEL5, ssMCF7). The small molecules measured at least 10 times were selected for this research, and 29 target drugs passed this criterion. After the selection, we collected pharmaceutical information on the 29 selected drugs from drug databases. The drug information includes target proteins, the Anatomical Therapeutic Chemical classification code, and drug indication as listed in Table 1.
As a final step, we randomly selected 10 experiments from each drug to reduce bias by the number of experiments. For instance, trichostatin A was experimented with 181 times. In contrast, metformin was measured only 10 times.
2. Construction of Previous Differential Expression Similarity Search Methods
For gene-level similarity analysis, 5 different methods were implemented. First, the differential expression profiles of all genes were compared by using Spearman rank correlation (CellMontage) [4]. The other 4 methods used gene signatures, which comprise a preselected number of top/down DEGs, extracted only from the query profile. The Connectivity Map uses Kolmogorov-Smirnov statistics to measure the correlation pattern of two drug response profiles. Iorio et al. [8] measured the Gene Set Enrichment Analysis score. Cheng et al. [11] calculated the cosine similarity between two differential expression profiles that can be calculated as a dot product of two vectors. Zhang and Gant [7] devised a method that orders genes based on their absolute value of differential expression. Based on the ranking, the importance of a gene is allocated by the absolute value of its rank rather than its differential expression value. The direction of regulation is maintained by additionally allocating importance with the sign of its rank. Based on the reassigned query gene signature and reference expression profile, the connection strength between them is calculated.
3. Identification of Differentially Co-expressed Gene Module Signature
A co-expressed gene module, a group of genes, shows correlated expression pattern in all samples. In comparison with the module, genes consisting of DCMs do not need to be correlated across all conditions. The genes only need to be correlated in one of two predefined conditions: control or drug treatment. Therefore, we can identify two types of DCMs. A down-correlation module is a gene group which shows correlation in control samples, and the correlation completely disappears or is significantly reduced after drug treatment. In contrast, the correlation of certain genes, or an up-correlation module, can be newly generated after drug treatment. We identified DCMs which satisfy the following two conditions: 1) DCMs are composed of significantly co-expressed gene pairs in one of the two conditions and 2) the gene pairs consisting of identified modules show significant differential co-expression compared to the other condition.
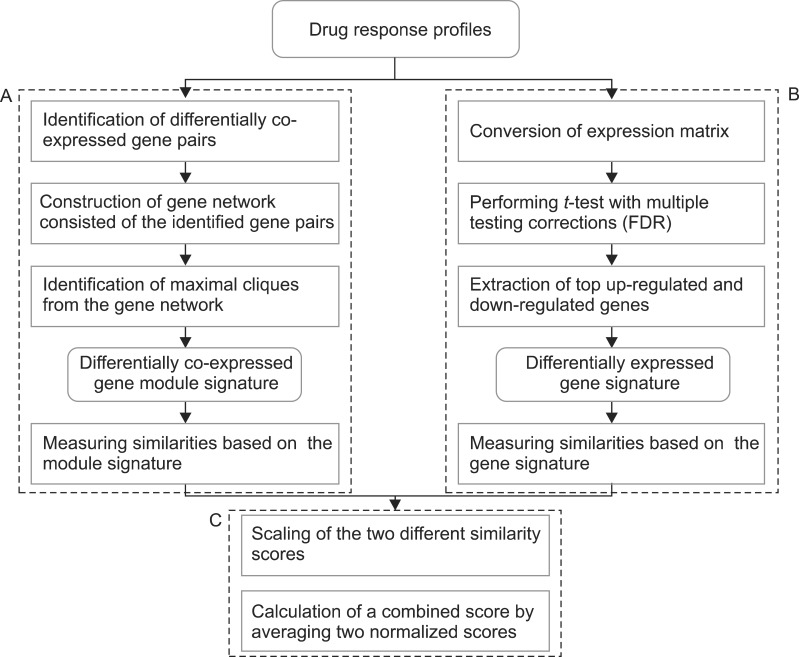
The overall procedure to identify DCM signatures is illustrated in Figure 1. To identify a significant co-expressed gene pairs in the two conditions, we measured the Pearson correlation coefficient (PCC) of all possible combinations of gene pairs and used them to find the distribution of correlations in each condition. In the correlation distribution, we selected the top 5% of gene pairs in the distribution and defined them as significantly co-expressed gene pairs. Among the significant gene pairs, we further selected gene pairs which showed significant differential co-expression. For the selection, we also found the distribution of differential co-expression by measuring all possible differences of co-expressions of gene pairs in the two conditions. The top 5% of the gene pairs were assumed to be significant differential co-expression pairs. The gene pairs that satisfied the two conditions were used to form the gene differential co-expression network. In the network, each gene pair was assumed to be a seed group, and each seed group is expanded by identifying the maximal clique in the network. A maximal clique is a sub-network, the nodes of which are fully connected with all other nodes.
The detailed expansion method was performed with the following procedures. If we found a down-correlation module, the seed groups were sorted based on the co-expression value in the control samples. Among the sorted seed groups, the group with the highest co-expression value was selected for expansion. Based on the selected seed group, we searched neighbor genes connected to all member genes of the seed group. The distance to a neighbor was measured by averaging the co-expression values between the neighbor and member genes in the group. Among the neighbors, the gene with the highest co-expression values was selected for merging. This merging step was iteratively performed until there was no neighbor gene that was fully linked to members of the currently expanded module. If the expansion of the selected seed group was finished, the genes included to the expanded module were removed from the sorted gene pairs. With the remaining gene pairs, the expansion of the next seed group was iteratively performed. The identified modules are maximal cliques in the gene co-expression network which comprise gene pairs that have significantly co-expressed in the target condition and have a higher differential co-expression value compared to the other condition. The up-correlation module is also searched with the same procedures by searching with co-expressed gene pairs in drug treatment samples. We set the minimum module size as 6 in this research.
4. Identification of Differentially Expressed Gene Signature
In the Connectivity Map, the transcriptional response of each drug is measured from independent experiments varying diverse conditions including different cell lines. Therefore, even though experiments are performed with the same drug, they have significantly different expression values in the control samples. The representative way to identify significantly DEGs in two different conditions is to perform a t-test. The t-test finds genes that have a slight variance of expression values in each condition and significant changes of expression values between the two conditions. The expression inconsistency of each gene in control samples can hamper the identification of DEGs using the method. Therefore, we converted the expression value of each gene into a new value by adapting these simple formulas:
Here, EControl and EDrug denote the original expression values of each drug response experiment. This simple conversion can reduce the inconsistency of expression values in control samples by shifting the original values and focusing more on the degree of differential expression values. By using the converted expression profiles, we performed a t-test with a false discovery rate (FDR) multiple testing corrections of 0.05 to the profiles. To identify significant DEGs, we extracted 100 up-regulated genes and 100 down-regulated genes with the lowest p-value.
5. Differential Expression Similarity Search with Identified Gene Signature
We performed a similarity search between drug response profiles with the identified DCMs and DEGs. Before calculation of the combined score of the two different signatures, the differential expression similarity based on each signature was measured independently. For the calculation of the DCM-based similarity score, the modules were identified from the query profile. We calculated the differentially co-expressed gene module-based similarity score (DCS) between two profiles, namely, the query profile and reference profile:

Here, DC denotes the differential co-expression value of a gene pair in a certain condition. We calculated two different types of DCs because there are two different types of modules in the module signature, that is, an up-correlation module and down-correlation module. DCM denotes the similarity score of each module. In each module, there are n possible combinations of gene pairs. For each gene pair, we calculated the difference between the DC from the query profile and the DC from the reference profile. The DCS was measured by averaging the score of all identified DCM signatures.
To calculate the DEG-based similarity score, SimDEG, we retrieved DEGs from the query profile. We averaged the differential expression values of each selected gene because there are multiple instances in the query and reference profiles. Based on the DEGs, we measured the PCC between the query profile and reference profile. After calculating two similarity scores, SimModule and SimDEG, we scaled them because they had different ranges of scores. We scaled each score between 0 and 1:
III. Results
1. Performance Comparison of Differential Expression Similarity Search Methods
We measured the performance of several similarity search methods by calculating the area under the receiver operating characteristic (ROC) curve, or the area under the curve (AUC). Figure 1 shows the overall performance of each method. For the performance estimation of previous similarity search methods, we used differential expression information from each instance. For the gene signature-based methods, we extracted 100 up-regulated genes and 100 down-regulated genes from query instances to use them as gene signatures. After measuring the performance of previous methods, we found that there is no significant performance difference between previous similarity search methods that use differential expression information only from the input query profile. If a certain similarity search method shows good performance by allocating highly positive similarity scores between the expression profiles treated with the target drug, the other methods also show good performance for the target drug. If a certain method cannot effectively find similarities between instances measured with the target drug, the others also cannot find the connections between them. These results indicate that, although the development of an effective similarity measurement method is important, the extraction of appropriate response signatures from drug response profiles was more important.
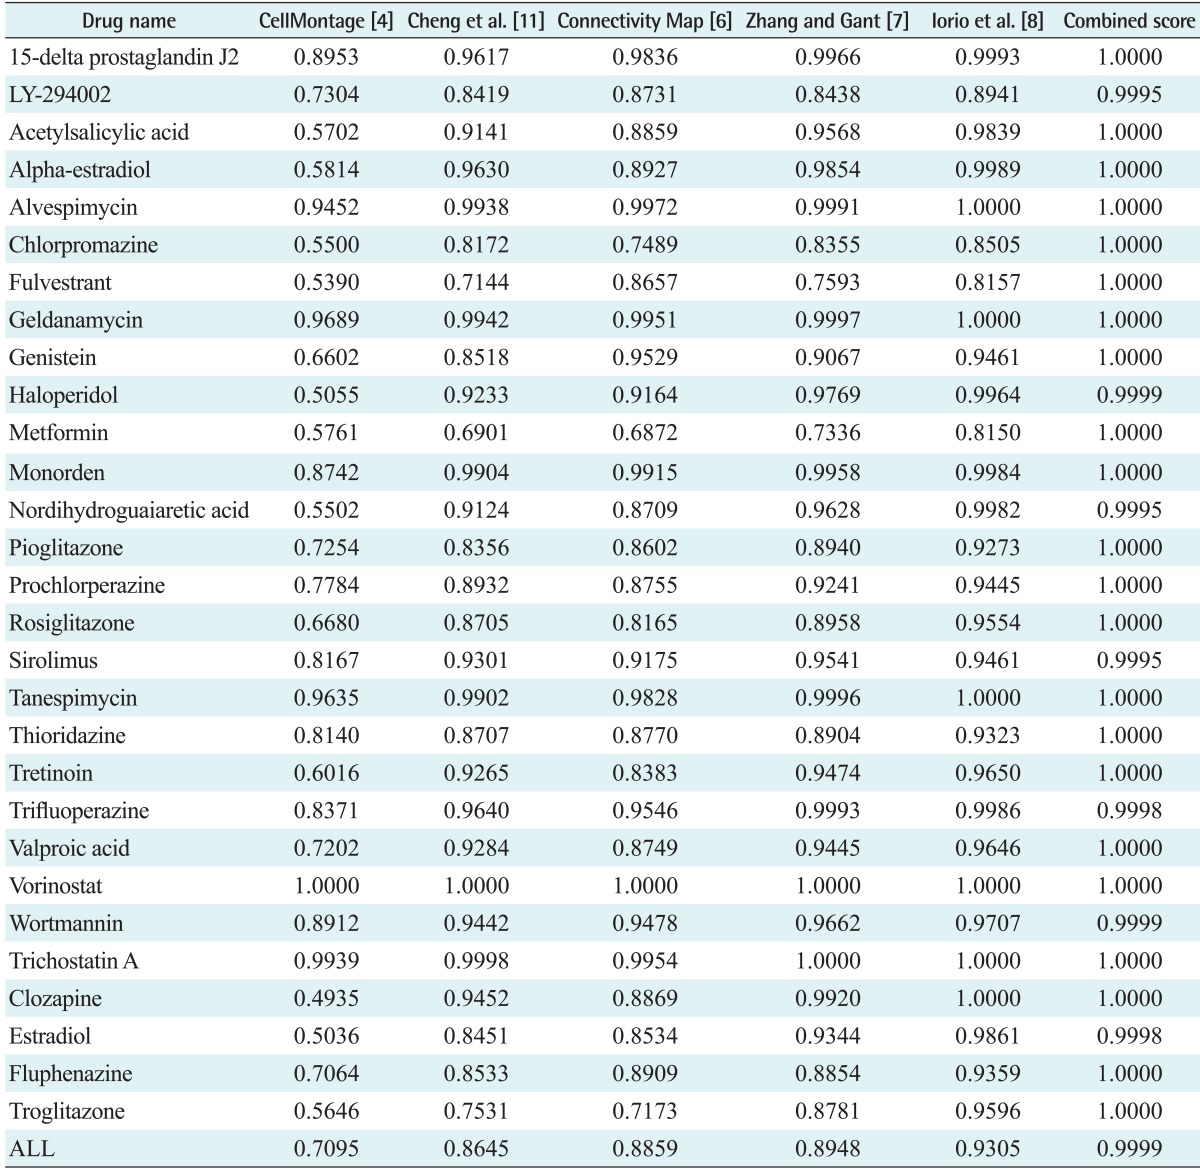
To compare our method with previous differential expression similarity search methods, multiple experiments were needed to measure co-expression between all pairs of genes and to perform a t-test for each gene. Therefore, we randomly selected 10 sub-experiment groups, which comprised 3 experiments, from each drug. We used all 10 experiments of each drug to infer the DCM signature and DEG signature. We tested our similarity search method using the combined score and previous methods for the 29 selected drugs listed in Table 2. Our novel similarity search method achieved very high performance compared to previous methods as shown in Figure 2. This means that, although the DCMs and DEGs were identified from the target drug, the extracted gene signatures can be specific features for the target drug, which can be distinguished from other drugs, in addition to common features that are fairly representative properties for target drug response profiles.
2. Construction of Drug Network
After the performance measurement, we checked whether an identified gene signature can be effectively used to find novel associations between drugs and to find instances treated with the same drug. For this purpose, we made drug-drug networks based on predicted similarity results among the 29 selected drugs. We calculated similarity scores based on the identified gene signature of each drug. The two similarity scores,  and
and  , have different values because their query signatures are different from each other. Therefore, from the Equation (9), we defined the similarity score given to drugs A and B as in previous research [8]:
and , have different values because their query signatures are different from each other. Therefore, from the Equation (9), we defined the similarity score given to drugs A and B as in previous research [8]:

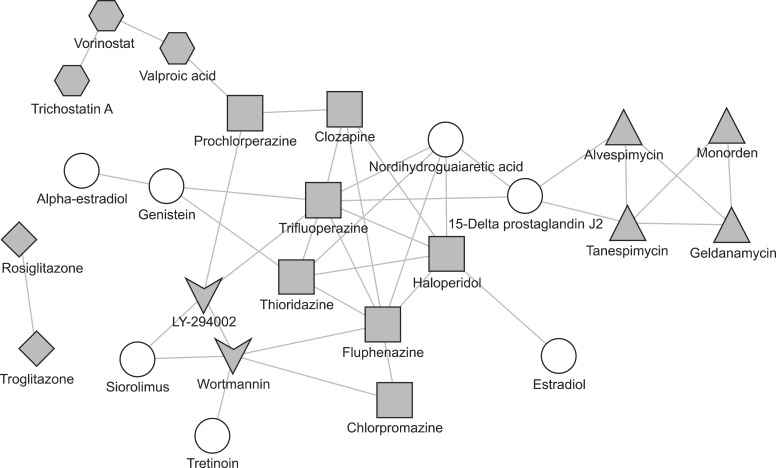
After the similarity measurement, we could get  pairwise distances. To estimate the significance threshold for the distances, we used the empirical probability distribution function of these distances as in previous research [8]. In this research, we chose the significance threshold value as the upper bound of 10% of the empirical probability distribution. After filtering the pairwise distances using this threshold, we drew drug networks from the predicted similarities between drugs as illustrated in Figure 3. We grouped 25 drugs based on their target proteins. There were five target groups including 18 drugs. Those five groups of drugs are well clustered in this similarity network. Seven round-shaped drugs which have heterogeneous targets are scattered in the network. Some connections found in this similarity network between drugs for different known targets may imply the possibility of drug repositioning.
pairwise distances. To estimate the significance threshold for the distances, we used the empirical probability distribution function of these distances as in previous research [8]. In this research, we chose the significance threshold value as the upper bound of 10% of the empirical probability distribution. After filtering the pairwise distances using this threshold, we drew drug networks from the predicted similarities between drugs as illustrated in Figure 3. We grouped 25 drugs based on their target proteins. There were five target groups including 18 drugs. Those five groups of drugs are well clustered in this similarity network. Seven round-shaped drugs which have heterogeneous targets are scattered in the network. Some connections found in this similarity network between drugs for different known targets may imply the possibility of drug repositioning.IV. Discussion
We introduced a novel computational method for similarity search of drug response profiles. The main idea of our method is the use of combined signatures of DCMs and DEGs. Integrating co-expressed gene modules can be more robust for various datasets with various numbers of samples and diverse conditions. The method was evaluated using searching experiments with data obtained from a profile library of cell lines treated with the same drug and identifying known drug groups that share the same pharmaceutical action. We demonstrated the high performance of our method with a 0.99 AUC score for searching the same drug by combined signature.
Drug repositioning is possible using the connection between drugs. Therefore, we predicted a drug-drug network to reveal the association between drugs. Although valproic acid is an anticonvulsant drug, it is associated with vorinostat and the same target protein. Thus, valproic acid can be a valuable drug for cutaneous T-cell lymphoma after clinical testing. Moreover, association between drugs can indicate a novel target. In our network, nordihydroguaiaretic acid targeting Acetyl-CoA acetyltransferase is similar to thioridazine, trifluoperazine, fluphenazine, and haloperidol targeting dopamine receptors. Therefore, we can infer that nordihydroguaiaretic acid has a novel target, dopamine receptors.
There were several limitations of our study. We used drug response profiles from the Connectivity Map. These profiles were obtained from only 5 cancer cell lines. It is limited in precisely measuring drug response profiles in relation to other diseases except several cancers. Therefore, it is necessary to investigate the drug response of disease-associated cell lines. For instance, to identify similar drugs for diabetes mellitus drugs, we need the drug response profiles in diabetes mellitus-associated cell lines, such as liver or adipocyte cell lines. Moreover, the number of samples for most drugs in drug response profiles is small. We only used the 29 selected drugs with more than 10 samples because DCMs need to calculate correlation in sufficient samples. Finally, we expected that response profiles using protein expression show better results than those using mRNA expression.