I. Introduction
In Korea, there has been an explosive growth in medical science as reflected by the vast increase in research articles for the past decades. In the core of such growth, medical schools have done a major role for the researches. According to the 2007 Report of Korean Ministry of Education, Science and Technology, the number of articles published through the journals indexed in Science Citation Index (SCI) database by Korean researchers has been increased to 25,494 and the number of articles of clinical medical science was 4,277, which occupies 16.77% [
1]. The SCI publication status of Korean medical science field reported by National Medical Academy in 2006 revealed that the accumulated number of SCI articles is 19,695 for biomedical research and 26,023 for clinical medicine [
2]. Also, the number of articles by Korean medical schools has shown huge expansion in recent years. The total number of searched SCI Expended (SCIE) articles of the 40 medical schools during 1997 to 2008 was 35,469 and the number of SCIE articles per year by medical schools has increased from 1,024 in 1997 to 8,462 in 2008 [
3].
In the meantime, the scientometric analysis allowed scientists to gain insight into the structure of research fields and co-authorship by identifying and mapping interpretable and homogenous clusters of articles and authors from the diverse medical research fields. Such visualization of scientific networks is more than simply creating intriguing pictures. The images of social networks among medical schools may provide investigators with new insights about network structure and would help the researchers to communicate with others. These also may provide much useful information for a number of stakeholders, such as potential students, employers of graduates, university administrators, potential donors, funding agencies, and governments. The social science structure can be conceptualized as a network of social science ties among the medical schools, because they transmit behavior, attitudes, information, or goods. Social network analysis offers the methodology to analyze social relations; it tells us how to conceptualize social networks and how to analyze them.
Thus we analyzed the structural and special characteristics of social networks among the medical schools to provide inside knowledge of medical field's structure, its dynamics, and potential paradigm developments.
II. Methods
1. Data
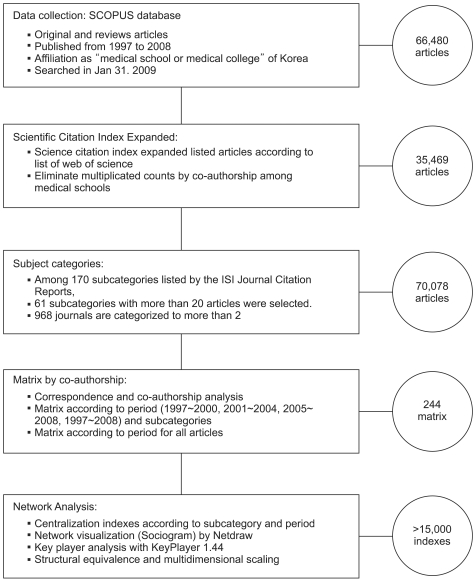
To identify distinct homogenous clusters of published articles, we used all journals listed under the subject category "Medicine," according to the Journal Citation Reports® (JCR; Thomson Reuters, New York, USA), as data sources for our analysis. Using the database of the SCIE (Thomson Reuters), original articles and review articles published from 1997 to 2008 were collected. The archives of the SCIE articles of each medical school were extracted from SCOPUS® database (Elsevier BV, Amsterdam, Netherlands), which is one of the largest abstract and citation database of research literature and quality web sources. In the SCOPUS® database, the articles were sorted with the command designed to extract only full papers (original article and reviews) and to confine the affiliation as "medical school or medical college." The method used in our study has been described in detail in previous report [
3]. In brief, twelve years of archives of the SCIE articles of each medical school from the year 1997 to 2008 were 35,469 but the sum of the number of SCIE of the medical schools was 51,480 due to the multi-institution, multi co-authoring articles. From the 170 subject categories of the JCR in the scope note [
4], 61 subcategories having more than 20 published articles were analyzed. Some of the journals are classified into two or three subject categories simultaneously. So the total numbers of articles according to the categories are increased to 70,078. After then, the data was compiled into a matrix of network contacts for the 40 medical schools for analysis. Each steps and results are summarized in
Figure 1. Furthermore, the SCIE articles were classified to three groups (1997-2000, 2001-2004, 2005-2008) according to the published year to analyze differences according to the year.
2. Matrix
The authors studied networks of medical schools in which two medical schools are considered connected if they have coauthored a paper together. This seems a reasonable definition of scientific acquaintance: the scientists who have written a paper together must be connected academically. Thus it was intended that social network analysis would be applied to this matrix to identify levels of interorganizational communication, clusters of co-authoring activity, and leading medical schools. If the medical school having the corresponding author coauthored other medical schools, the relationship was set to be 'invite and invited.' Other co-authors with non-medical school or outside Korea were not included into analysis.
3. Centralization, Centrality
We used UCINET [
5] and Pajeck ver. 1.25 (Bajaglij V & Mrvar A, Ljubljana, Slovenia) to analyze the indices. UCINET [
5] is a social network analysis software with which the computational aspects of analysis, including calculating various measures (
eg, centrality, cohesion, brokerage) among others, as well as hypothesis testing can be performed. Pajek is a program, for Windows, for analysis and visualization of large networks and is freely available, for noncommercial use at web site [
6]. Also, NetDraw ver. 2.090 (Analytic Technologies, Lexington, KY, USA) were used to draw sociogram. NetDraw is social network visualization software with which graphic representation of networks including relations and attributes can be drawn. We analyzed four centralization indices (degree centrality, closeness centrality, betweenness centrality) and Eigenventor centrality index as suggested by Freeman [
7]. The network measurement methods were applied to, one for individual node (vertex) and one for entire network.
4. Key Player Analysis
We used KeyPlayer ver. 1.44 (Analytic Technologies) program for identifying an optimal set of nodes in a network. The program performs a procedure to find sets of key players in a social network [
8]. The basic algorithm of this method is to lengthen the average distance between pairs of nodes by judiciously deleting key nodes with the key assumption of the algorithms is that the optimal selection of key players depends on what they are needed for.
The program runs for the purposes: 1) crippling the network by removing key nodes, and 2) selecting which nodes to either keep under surveillance or to try to influence via some kind of intervention. Accordingly, two generic goals are articulated, called KPP-POS and KPP-NEG. KPP-POS is defined as the identification of key players for the purpose of optimally diffusing something through the network by using the key players as seeds. KPP-NEG is defined as the identification of key players for the purpose of disrupting or fragmenting the network by removing the key nodes. We used distance weighted reach criterion method (KPP-NEG).
5. Structural Equivalence
To locate the position of the medical schools with similar behaviors in the network, we used a method called convergence of iterated correlations (CONCOR) which categorizes structurally similar medical schools into a group. CONCOR is a promixity measure tool for algorithms for approximate structural equivalence suggested by Breiger et al. [
9]. It measures the degree to which two nodes are structurally equivalent by measuring the degree to which their columns are identical. In an adjacency matrix, the correlation of the value of the medical school is taken. The value is settled to 0 or 1 by repeatedly calculating the correlation coefficient.
6. Multidimensional Scaling
To plot the proximities between network nodes, multidimensional scaling (MDS) was done with a superset of classical MDS that generalizes the optimization procedure to a variety of loss functions and input matrices of known distances with weights. According to the period, metric MDS was performed and the scattergrams of the network node (medical schools) were compared. Given a matrix of proximities (similarities or dissimilarities) among a set of items, the program finds a set of points in k-dimensional space such that the Euclidean distances among these points corresponds as closely as possible to the input proximities. The data may represent similarities or dissimilarities. If similarities exit, large values of X (i,j) will draw i and j close together on the MDS map. If dissimilarities exit, large values will push i and j apart on the map.
III. Results
1. Centralization According to Period
The centralization of the scientific publication network among medical schools was analyzed with matrix generated from 35,469 SCIE articles published from 1997 to 2008. The degree of centralization of the scientific network has been relieved through the period by all the centralization indices. The degree improved from 0.5634 in period 1997-2000 to 0.2740 in period 2005-2008. Indgree and outdegree indices showed similar pattern. Also the betweenness, closeness and Eigenvector indices showed reduced centralization degrees (
Table 1). Especially, the decrease of Eigenvector index was profound (from 0.2410 in early period to 0.0475 in late period).
2. Centralization According to Subcategories
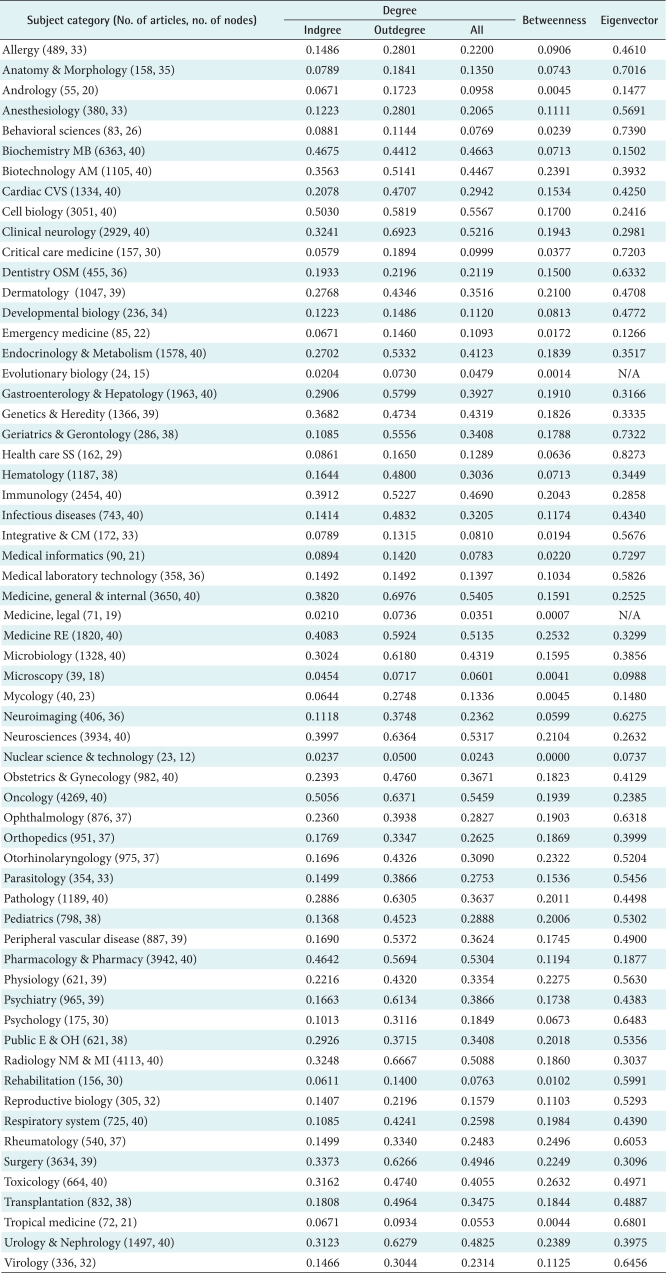
The centralization degree of the scientific publication network among medical schools according to subcategories was analyzed. The number of articles and involved node (medical schools) according to subcategories are described in
Table 2. Among the subcategories, 'Cell biology' (0.5567), 'Oncology' (0.5459), 'Medicine general & internal' (0.5405), 'Neuroscience' (0.5317), 'Pharmacology and Pharmacy' (0.5304), and 'Clinical neurology' (0.5216) showed high degree of centralization. Indegree and ourdegree indices were highest in 'Oncology' (0.5056) and 'Medicine, general & internal' (0.6976), respectively. Betweenness and Eigenvector centralization was highest in 'Toxicology' (0.2632) and 'Health care science and services' (0.8273), respectively.
3. Centrality Changes According to Period
1) Degree centrality
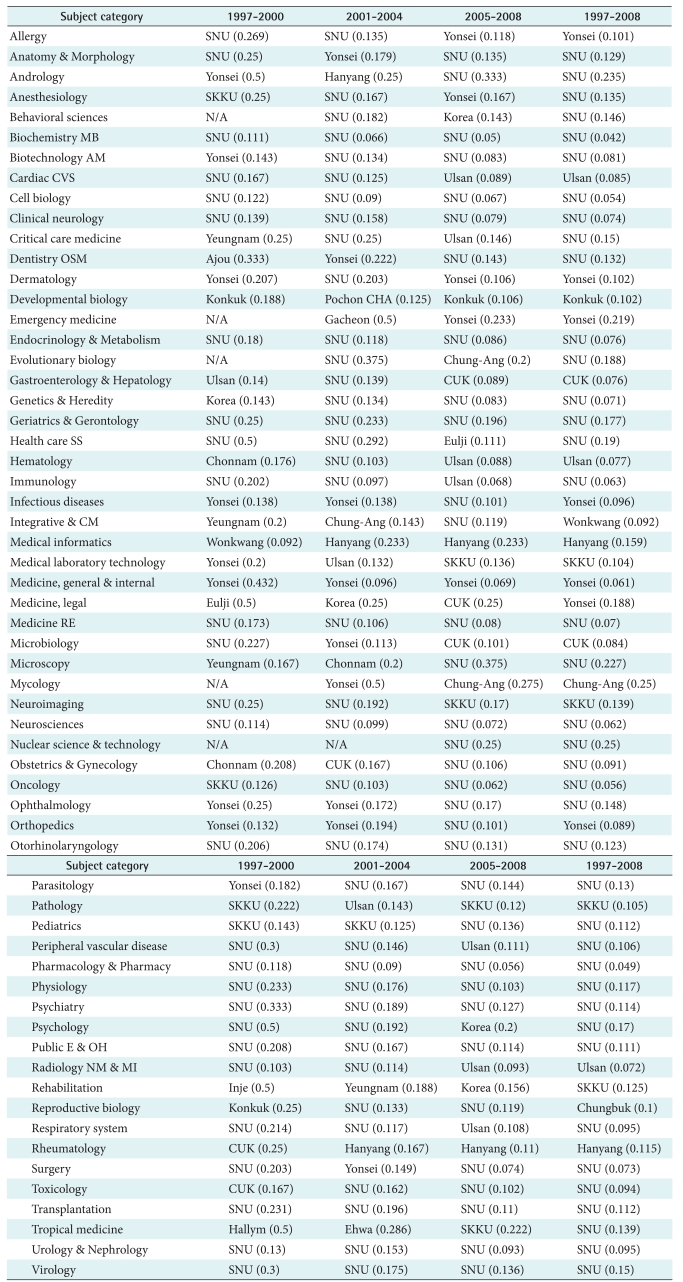
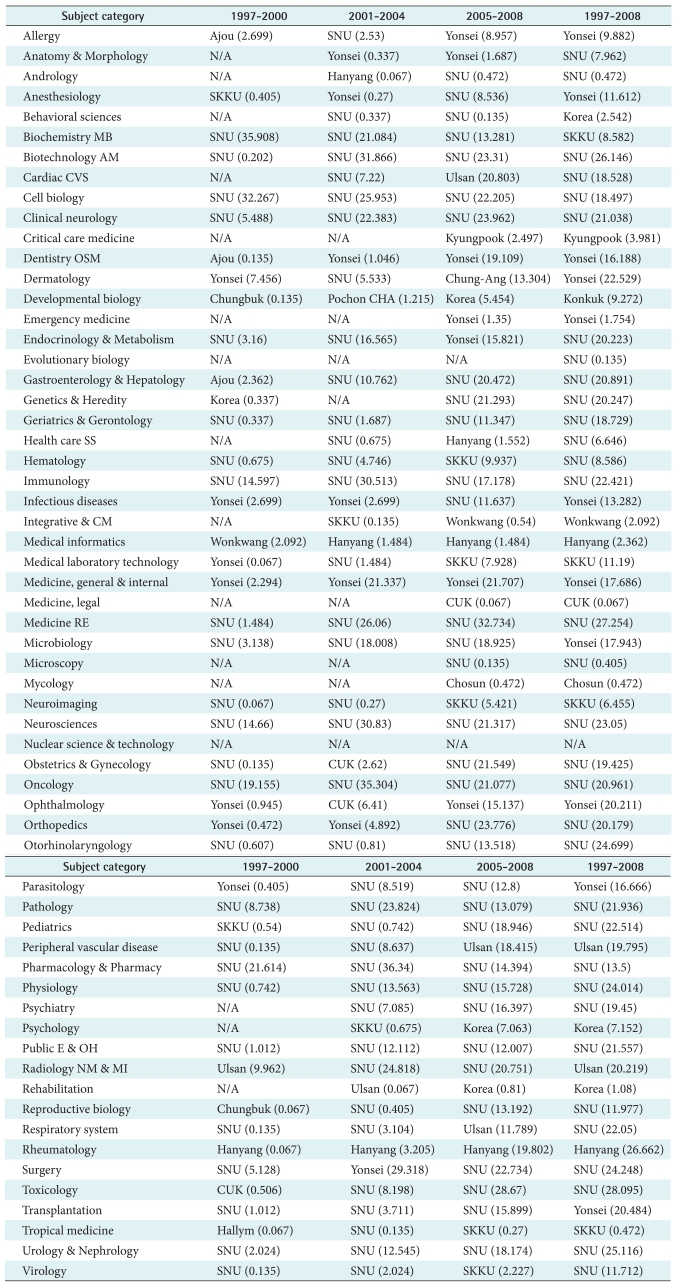
The degree centrality of node (medical schools) for each subcategory was compared according to the period 1997-2000, 2001-2004 and 2005-2008. The medical school having highest centrality index is listed in
Table 3. Though the centralization index of the network was decrease recently, the number of subcategories where the top 4 medical schools are highest was increased. In period 1997-2000, the number of subcategories where those four medical schools were highest was only 41 (67.2%). In period 2005-2008, the number was increase to 48 (78.6%). Through the period 1997-2008, Seoul National University (SNU) was highest in 39 subcategories among 61 subcategories (63.9%). Yonsei, Sungkyunkwan and Ulsan University were highest in 7, 4, and 3 subcategories respectively. Four medical schools are occupying 53 subcategories among 61 subcategories occupying 86.8% of the subcategories.
2) Betweenness centrality
The medical school having highest betweenness centrality index is listed in
Table 4. In period 1997-2000, the number of subcategories where those four medical schools were highest was only 35 (57.4%). In period 2005-2008, the number was increase to 48 (78.7%). Through the period 1997-2008, SNU was highest in 33 subcategories among 61 subcategories (54.1%). Yonsei, Sungkyunkwan and Ulsan University were highest in 11, 4, and 2 subcategories respectively. Four medical schools were occupying highest in 50 subcategories among 61 subcategories occupying 82% of the subcategories.
3) Eigenvector centrality
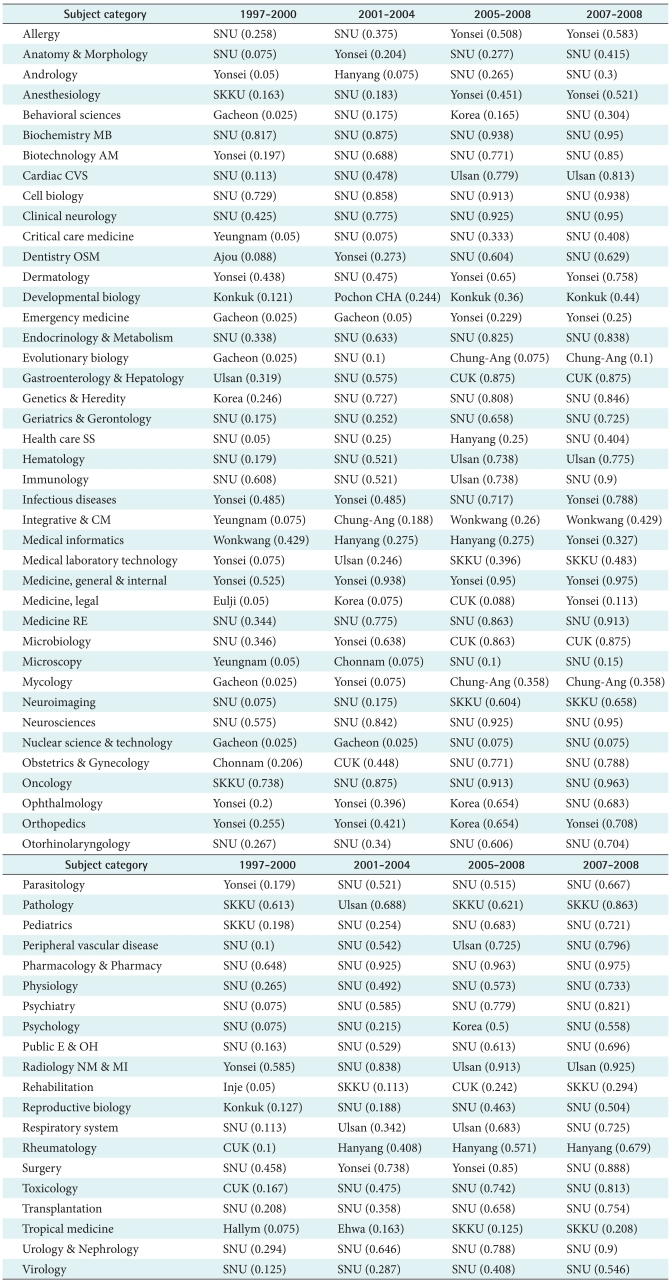
The medical school having highest Eigenvector centrality index is listed in
Table 5. Unlike degree centrality and betweenness centrality, Eigenvector centrality was not changing through the year. In period 1997-2000, the number of subcategories where those four medical schools were highest was 45 (73.8%). In period 2005-2008, the number was slightly increased to 47 (77%). Through the period 1997-2008, SNU was highest in 38 subcategories among 61 subcategories (62.3%). Yonsei, Sungkyunkwan, and Ulsan University were highest in 6, 5, and 3 subcategories respectively. Four medical schools were occupying highest in 52 subcategories among 61 subcategories occupying 85.2% of subcategories.
4) Sociogram
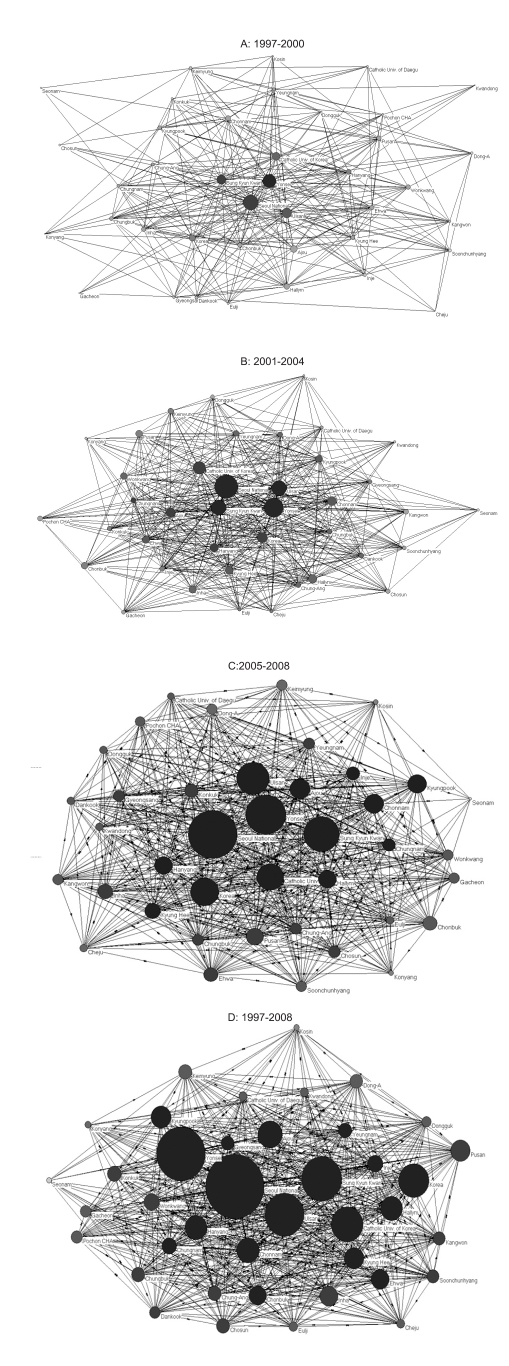
The network among medical schools was drawn by Pajek. The network diagrams are demonstrated in
Figure 2. The nodes (medical school) located at center have high degree of centrality. The size of the circle means the number of SCIE articles during the period. During 1997-2008, there has been dramatic increase of SCIE publications and networks among medical schools. Those results are reflected as the size of the nodes and arcs (arrows) where the arc AŌåÆB means corresponding school B invited A as co-author. In the earlier period, the network was not dense. However it becomes dense in later period. As the network among medical school is increased, the degree centrality of the network is decreased from 0.5364 to 0.2740.
4. Key Players Analysis
The 'key player' of each subcategory was compared according to the period 1997-2000, 2001-2004 and 2005-2008. The 'key player' medical school is listed in
Table 6. SNU was appeared as 'key player' in 37 subcategories (60.7%). Yonsei, Sungkyunkwan, and Ulsan University were 'key player' in 9, 5 and 3 subcategories, respectively. Those four medical schools are occupying 54 subcategories (88.5%) as 'key player.'
5. Structural Equivalence
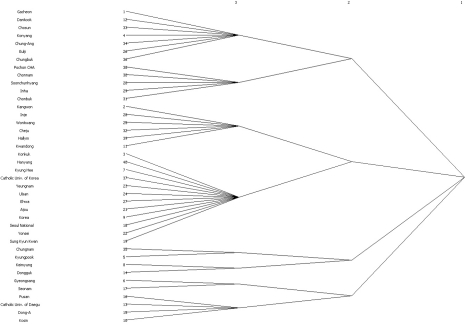
The results of CONCOR and cluster diagram generated by UCINET are demonstrated in
Figure 3. Medical schools having similar pattern of behavior in the network are tied together (R
2=0.240). The analysis produced eight groups and the medical schools in a group may be regarded as a 'Clique.' Group A was 'Gacheon,' 'Dankook,' 'Chosun,' 'Konyang,' 'Chung-Ang,' 'Eulji,' and 'Chungbuk.' Group B was 'Pochon CHA,' 'Chonnam,' 'Soonchunhyang,' 'Inha,' and 'Chonbuk.' Group C was 'Kangwon,' 'Inje,' 'Wonkwang,' 'Cheju,' 'Hallym,' and 'Kwandong.' Group D was 'Konkuk,' 'Hanyang,' 'Kyung Hee,' 'Catholic Univ. of Korea,' 'Yeungnam,' 'Ulsan,' 'Ehwa,' 'Ajou,' 'Korea,' 'Seoul National,' 'Yonsei,' and 'Sungkyunkwan.' Group E was 'Chungnam,' and 'Kyungpook.' Group F was 'Keimyung' and 'Dongguk.' Group G was 'Gyeongsang,' and 'Seonam.' Group H was 'Pusan,' 'Catholic Univ. of Daegu,' 'Dong-A,' and 'Kosin.'
6. Multidimensional Scaling
The results of MDS are presented in
Figure 4. Before 2001, only five medical schools are included inside 0.5 metric (inner most circle). In 2005-2008, eight to nine medical schools are included inside 0.5 metric. Before 2001, many of the medical schools are not included even in 1.5 metric (outer circle). But in period 2005-2008, most of the medical schools are included inside 1.5 metric. Through the period, only one medical school (Seonam, Korea) is outside the 1.5 metric.
IV. Discussion
1. Centralization According to Period
Centrality denotes 'how network is structured' and 'how a node contributes to the network' and it can be characterized by the nature of the flow of information. Usually the term 'centrality' is restricted to the idea of point centrality, while the term 'centralization' is used to refer to particular properties of the graph structure as a whole. The value of degree centrality of a vertex (node, medical school) is its degree while the value of degree centralization of a network is the variation in the degrees of vertices divided by maximum degree variation which is possible in a network of the same size [
10]. The value may denote 'point (node) centrality' or 'graph (network) centrality.' Practically, the degree centrality of a network denotes 'how the network is well connected.' It is an index of exposure to what is flowing through the network and can be interpreted as opportunity to influence and be influenced directly.
1) Degree centrality
The degree centrality of the network among medical schools of Korea for the aspect of SCIE publication changed from 0.5364 in period 1997-2000 to 0.2740 in period 2005-2008. The result reveals that the centrailization of the network becomes less profound recently. This is because that as the competitions among medical schools for the SCIE publication become profound, the number of SCIE publication by medical schools has been dramatically increased [
3]. Thus the need to communicate among medical schools was increased. Also indgree and outdegree centrality of the network showed marked decrease, too. Indegree of a node (medical school) is the number of arcs it receives (being invited as co-author) and outdegree of a node is the number of arcs it sends (invited others as co-author). Thus the decrease of indegree and outdegree centrality means that the ratio of 'being invited' or 'invite' by specific medical schools from total number of SCIE publication was decreased. In other word, more medical schools were 'inviting' or 'being invited' and co-authorship was enhanced. These findings are visualized in sociogram (
Figure 2). In the figure, the size of the circle reflects the number of articles of each medical schools and the arc denotes invite or be invited by direction of arrow. At earlier period (1997-2000), the size of the circle was small and the arcs were sparse. But in later period (2005-2008), the size of the circle becomes larger and the network gets denser. As a result, the degree centrality was relieved.
2) Closeness centrality
Closeness centrality denotes 'how far from all others, how long information takes to arrive.' It is an inverse measure of centrality and is an index of expected time until arrival for given node of whatever is flowing through the network. A simple explanation of this is 'central player hears things first.' The degree of closeness centrality of the network changed from 0.6210 in period 1997-2000 to 0.2501 in period 2005-2008. The meaning of the results is 'the velocity of information flow' becomes faster.
3) Betweenness centrality
The betweenness centrality denotes 'how often a node lies along the shortest path between two other nodes' and it is an index of potential for gatekeeping, brokering, and controlling the flow. It is usually interpreted as indicating power to access to diversity of what flows and to synthesize or organize a team. The betweenness centrality changed from 0.1824 in period 1997-2000 to 0.0110 in period 2005-2008. The results mean the oligopolies of the network by several medical schools are resolving rapidly.
4) Eigenvector centrality
Eigenvector centrality denotes 'being connected to the well connected (a popularity & power measure).' A node has a high score if connected to many nodes that are themselves well connected. This is an indicator of popularity and it tends to identify centers of large cliques. The Eigenvector value changed from 0.2410 in period 1997-2000 to 0.0475 in period 2005-2008. The results can be interpreted as more medical schools are having more diverse relationships among themselves than early period.
2. Centralization According to Subcategories
1) Degree centrality
The degree centrality according to research field was analyzed. The subcategories showing high degree of centralization were 'Cell biology,' 'Oncology,' 'Medicine, general & internal,' 'Neurosciences,' and 'Pharmacology & Pharmacy.' These findings suggest that the researches in these subcategories are concentrated to several medical schools and coauthorship is not shared well. In the
Table 6, we can see which medical schools are 'key players' in the subcategories. SNU is presenting as highest centrality (
Table 3), highest betweenness (
Table 4), and highest Eigenvector node (
Table 5) and it is defined as 'key player' (
Table 6) in all those subcategories showing high degree of centralization except 'Medicine, general & internal.' The subcategory 'Medicine, general & internal' needs cautious interpretation. This subcategory includes 52 kinds of journals with 3,650 articles. Also, the subcategory includes "Journal of Korean Medical Science" and "Yonsei Medical Journal" and the numbers of articles of the journals are 2,020 and 1,299, respectively. Among the 1299 articles of the Yonsei Medical Journal, Yonsei University published 800 articles. Thus the centralization of the subcategory 'Medicine, general & internal' was largely affected by Yonsei University. The journals of other subcategories are mostly published outside of Korea so that those intervening are not happened.
2) Betweenness centrality
Again, the betweenness centrality is an index of potential for gatekeeping. Thus the medical schools having highest betweenness indices are controlling the flow of information and can be regarded as an organizer of multicenter researches of the subcategories. The subcategories showing high degree of betweenness centrality were 'Toxicology,' 'Medicine, research & experimental,' 'Rheumatology,' 'Biochemistry & Molecular biology,' and 'Urology & Nephrology.' For these subcategories, SNU showed highest betweenness centrality index in 'Medicine, research & experimental,' 'Toxicology,' and 'Urology & Nephrology.' For subcategory 'Biochemistry & Molecular biology' and 'Rheumatology,' Sungkyunkwan and Hanyang were highest, respectively. Unlike centralization degree, several medical schools are positioned as 'gate keeper.'
3) Eigenvector centrality
Eigenvector centrality is a measure of the importance of a node in a network. It assigns relative scores to all nodes in the network based on the principle that connections to high-scoring nodes contribute more to the score of the node in question than equal connections to low-scoring nodes. Thus the Eigenvector centrality depends both on the number and the quality of its connections: having a large number of connections still counts for something, but a vertex with a smaller number of high-quality contacts may outrank one with a larger number of mediocre contacts [
11]. Eigenvector centrality turns out to be a revealing measure in many situations. The subcategories with high Eigenvector indices are 'Health care services and science (SNU),' 'Behavioral sciences (SNU),' 'Geriatrics & Gerontology (SNU),' 'Medical informatics (Hanyang),' and 'Critical care medicine (SNU).' Still, SNU was turned to be the most 'popular' in the network.
3. Key Player
One of the purposes of the uses of centrality measures is to identify key players in social networks that are considered important. Diverse centrality measures such as degree centrality, closeness, betweenness, and eigenvector centrality were described above. Degree centrality is to define the influence of a player in the network is measured by evaluating the degree with which these players may reach. Betweenness centrality is to define the flow of information, the degree of a messages sent through the network frequently pass through specific players. Eigenvector centrality is to define 'who is popular among popular' which means they represent centers of large cliques in the graph. In spite of their simplicity, those centrality indices have shown to be a robust and effective way to identify key players. However, the performance of centrality measures was varied under the conditions of imperfect data [
12]. Thus Borgatti [
8] provides the following formal definition of the set of key players problem:
"Given a social network (represented as an undirected graph), and a set of k nodes (called a kp-set of order k) such that, 1. (KPP-Neg) Removing the kp-set would result in a residual network with the least possible cohesion, 2. (KPP-Pos) The kp-set is maximally connected to all other nodes." The program KeyPlayer ver. 1.44 is developed by Borgatti himself to find a solution of key players problem. We used distance weighted reach criterion method (KPP-NEG) with the goal consists of identifying those k-players that, if removed, will disrupt or fragment the network. As shown above, the degree of centralization was relieved through the period. However, the number of key players has been shrunk through the period. The four medical schools, SNU, Yonsei, Sungkyunkwan, and Ulsan University were 'key player' 54 subcategories (90%). In earliest period (1997-2000), the number of medical schools as 'key player' was 15, but it changed to 12 and 10 in period 2001-2004 and 2005-2008, respectively. Also, the occupation by those four medical schools was increase from 40 subcategories in earliest period to 46 subcategories in latest period. Thus even though centralization degree is relieved and the 'key players' are changing dynamically, the significance of those four medical schools is still going profound inside the scientific network of medical schools of Korea.
4. CONCOR Analysis
Through a series of CONCOR analyses of the squared matrix, it has been possible to establish the different groups of the organization [
13]. These analyses allow us to get closer to what is the informal organizational chart of the organization. The assumption of this is that two nodes are structurally equivalent to the extent that they have identical relations with every other node. Thus the medical schools of same cluster don't necessarily mean to have relationship with each other. It only means that they behavior alike. The group 'D' has highest number of corresponding articles and the ratio of corresponding articles inviting other medical schools per co-authoring articles invited by other medical schools (CA/CO). And Group 'D' is very productive and shows high centrality degree (density), betweenness and Eigenvector (
Table 7). Medical schools in group 'D' can be regarded as that they are much productive and actively communicate in the network. Group 'E' is relatively productive and actively communicates but the number of articles per year is much smaller than group 'D.' Group 'G' has low number of articles and low ratio of corresponding/coauthoring (invite/invited). But group 'G' had a relatively high betweenness index which means the medical schools of this group have relatively high frequency of critical location among medical schools' geodesic paths. Group 'H' has productivity in middle but they do not communicate much with other medical schools.
5. Metric MDS
MDS is the most common technique used in perceptual mapping. MDS is a statistical technique for taking the preferences and perceptions of respondents and representing them on a visual grid. The current results clearly show that more medical schools are moving to center (
Figure 4). The result may be considered with the result of CONCOR. The group 'D' on CONCOR analysis is mostly located in the center circle. Another common thing of this group is that the medical schools of group 'D' are mostly located in or nearby Seoul. We can find geographic closeness affect the result. The medical schools of 'Kyungsang' or 'Chonla' or 'Chungchungnamdo' are closely located in
Figure 4D. However, the standardized residual sum of squares (STRESS) was 0.391 after 62 iterations, thus the fidelity of this analysis is poor.
Metric MDS coordinates 0.5 encompass four medical schools (SNU, Yonsei, Sungkyunkwan, and Catholic University of Korea) initially (period 1997-2000). In period 2001-2004, Ulsan University was added. In period 2005-2008, Ulsan University was out and Korea University and Hanyang University was added to make six medical schools are inside 0.5 circle. The results do not necessarily mean the productivity of Ulsan University was poor in period 2005-2008. It only means Ulsan University is not alike to the other major producing medical schools. For example, Ulsan University might have been developing a newer network with foreign institute.
In conclusion, all the centralization indexes analyzed showed that the degree of centralization in the network of medical schools was relieved through the period. Especially, betweenness centrality of the network showed dramatic change which means the role of a specific "gatekeeper" is minimizing. Also Eigenvector centrality is decreasing which can be interpreted as monopolization of information is resolved. Key player analysis showed that SNU has been a constant 'key player' through the period and through the subcategories. CONCOR and mertic MDS showed some similarities exist among medical schools with geographic location. In this article, the social scientific network among the medical schools in Korea has been examined. Through the understanding of the network among medical schools in Korea, a strategy to strengthen the basis of researches may be improved.
Acknowledgements
This research was supported by the Kyung Hee University Research Fund in 2006 (KHU-20060342).
References
1. Ministry of Education, Science and Technology. Analysis of NSI DB for SCI publications of Korea, 2007. 2008. Seoul: Ministry of Education, Science and Technology.

2. Lim JK, Kim WK, Sung SY, Lee CS, Lim JH, Jeong JB, et al. Korea medical research report. KMR Report 2006. 2007. Seoul: National Academy of Medicine of Korea.

3. Kang JO, Park SH. Current status of scientific citation index expanded article publications and relationship with the human resources of medical schools in Korea. J Korean Soc Med Inform 2009;15:321-340.

5. Borgatti SP, Everett MG, Freeman LC. UCINET for windows: software for social network analysis (version 6). 2002. Harvard (MA): Analytic Technologies.

7. Freeman LC. Centrality in social networks conceptual clarification. Soc Netw 1978-1979;1:215-239.

8. Borgatii SP. Identifying sets of key players in a social network. Comput Math Organ Theor 2006;12:21-34.

9. Breiger RL, Boorman SA, Arabie P. An algorithm for clustering relational data with applications to social network analysis and comparison with multidimensional scaling. J Math Psychol 1975;12:328-383.

10. Nooy WD, Mrvar A, Batagelj V. Exploratory social network analysis with Pajek: structural analysis in the social sciences. 2005. New York: Cambridge University Press.

11. Newman ME. In: Blume LE, Durlauf SN, The mathematics of networks. editors. The new palgrave encyclopedia of economics. 2007. 2nd ed. Basingstoke (NH): Palgrave Macmillan.

12. Ortiz-Arroyo D, Hussain DM. In: Ortiz-Arroyo D, Larsen HL, Zeng D, Hicks DL, Wagner G, An information theory approach to identify sets of key players. editors. Intelligence and security informatics. 2008. Heidelberg: Springer Berlin; p. 15-26.

13. Molina JL. The informal organizational chart in organizations: an approach from the social networks analysis. Connections 2001;24:78-91.


